 Andreas Züttel
 Noris Gallandat1,2
- 1Laboratory of Materials for Renewable Energy (LMER), Institute of Chemical Sciences and Engineering (ISIC), École Polytechnique Fédérale de Lausanne, EPFL, Lausanne, Switzerland
- 2Empa Materials Science and Technology, Dübendorf, Switzerland
- 3Laboratory of Organometallic and Medicinal Chemistry (LCOM), Institute of Chemical Sciences and Engineering (ISIC), École Polytechnique Fédérale de Lausanne, EPFL, Lausanne, Switzerland
- 4Emeritus Empa and ETH Zürich and Université de Fribourg, Fribourg, Switzerland
- 5Formerly Empa Materials Science and Technology, Dübendorf, Switzerland
- 6WPI-Advanced Institute for Materials Research (WPI-AIMR), Tohoku University, Aoba-ku, Sendai, Japan
Fossil fuels and materials on Earth are a finite resource and the disposal of waste into the air, on land, and into water has an impact on our environment on a global level. Using Switzerland as an example, the energy demand and the technical challenges, and the economic feasibility of a transition to an energy economy based entirely on renewable energy were analyzed. Three approaches for the complete substitution of fossil fuels with renewable energy from photovoltaics called energy systems (ES) were considered, i.e., a purely electric system with battery storage (ELC), hydrogen (HYS), and synthetic hydrocarbons (HCR). ELC is the most energy efficient solution; however, it requires seasonal electricity storage to meet year-round energy needs. Meeting this need through batteries has a significant capital cost and is not feasible at current rates of battery production, and expanding pumped hydropower to the extent necessary will have a big impact on the environment. The HYS allows underground hydrogen storage to balance seasonal demand, but requires building of a hydrogen infrastructure and applications working with hydrogen. Finally, the HCR requires the largest photovoltaic (PV) field, but the infrastructure and the applications already exist. The model for Switzerland can be applied to other countries, adapting the solar irradiation, the energy demand and the storage options.
Highlights
• Renewable energy covers up 70% of the annual energy demand, is limited to day/night storage and low cost, and the remaining 30% is challenging (seasonal storage).
• A pure electric energy system with battery storage is very expensive and resource demanding.
• The energy system based on hydrogen (HSY) is slightly more expensive than the electricity (ELC) based one and requires the development of hydrogen infrastructure and hydrogen applications.
• The energy system based on synthetic hydrocarbons is two times as expensive as ELC.
• Only HCR enables production of jet fuel, and current infrastructure and applications can still be used.
• The cost of synthetic fuel is about 0.5 CHF/kWh but is expected to decrease with time.
• Production of renewable energy and synthetic fuel close to the equator reduces the cost by 35%.
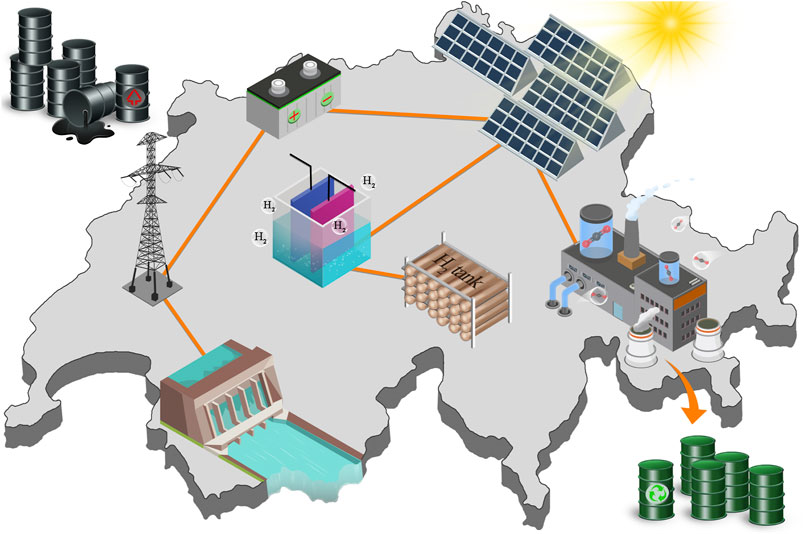
GRAPHICAL ABSTRACT
1 Introduction: The Global View
With the analysis and modeling of the depletion of oil fields by M. King Hubbert (Hubbert, 1956) (1956), it was realized that the global reserves of fossil fuels are limited. His model was largely validated by the 1973 oil crisis and the report “Global 2000” by the Club of Rome (Barney, 1988). The release of CO2 from the combustion of fossil fuels and the possible impact on climate, however, had already been predicted in 1896 by Svante Arrhenius (Arrhenius, 1896). Only a hundred years later did it become generally accepted that the increase in CO2 in the atmosphere (Petit et al., 1999) causes an increase in the average global temperature and that global warming would have an impact on the environment (Mann et al., 1999). Limited fossil resources and global warming, together with the growing population and economic dependence on energy consumption, have driven the need for a global energy turnaround. Today, the goal is to limit the increase in the CO2 concentration in the atmosphere and to introduce a closed material cycle for energy resources, as well as for all other materials used in products, in order to provide more energy and materials with less impact on the environment (circular economy).
The current global energy demand (Our World in Data, 2020) is close to 1.6·1014 kWh/year, which corresponds to an average power of 18 TW. We express energy consumption as energy per capita and divide by time (e.g., year) in order to obtain power. Since all energy consumption is always in a specific period of time, it can always be written as an average power without any interpretation or loss of information. The growth of photovoltaic (PV) and wind power in Germany between 2008 and 2018 from 6 to 45 GWp and from 24 to 60 GWp (installed peak power) (BMU, 2008), respectively, demonstrated that already within a decade, the installed peak power from renewable energy can reach and exceed the average electric power consumption (61 GW is the annual average in Germany).
The globally installed peak power for PVs has been growing exponentially for the past 20 years, with a growth rate of approximately an order of magnitude every 5 years (+47%/year). The growth rate of wind power is somewhat smaller, and the produced energy of PVs is predicted to surpass that of wind power in 2024.
Extrapolating the exponential growth of the average produced power of renewable energy conversion (Figure 1) indicates that the global energy demand of 24 TWp will be reached by the average power of installed renewable energy in 2032. As can be seen in Figure 1, the growth is slowing down in recent years as the fitted line is above the actual installed power for PV, wind, solar thermal, and the sum of all renewables (total); however, it is still growing exponentially.
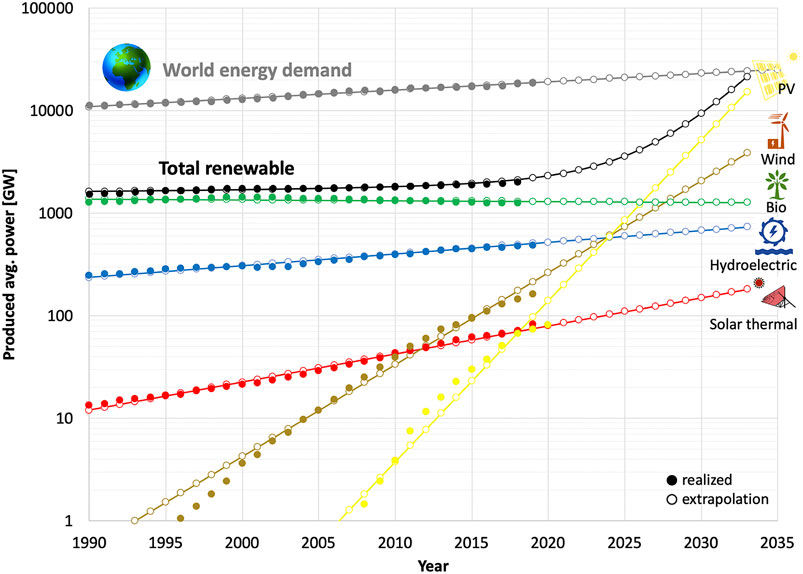
FIGURE 1. Global average power produced by renewable energy converters (CleanTechnica, 2020a).
The intermittent character of solar and wind power requires storing a significant amount of the annually produced energy, because of the seasons and the high energy density required in mobility. Therefore, the main technical challenge is not to generate renewable energy but to store the energy in a usable form, i.e., to realize the conversion of renewable energy into a storable energy carrier and to build the necessary storage capacities and distribution networks.
Improving the efficiency of energy conversion is not considered in this study. In 1865, in his book “The Coal Question,” Jevons (Jevons et al., 1865) showed that an increase in efficiency leads to an increase in energy demand. A more efficient process is economically more beneficial and consumes less resources; hence, the process is applied more often and by more users. As a consequence, more energy is used, in analogy to a product in sale leading to more consumption.
In this paper, using Switzerland as an example, energy demand, conversion power, storage capacities, and economic consequences of switching to a net-zero CO2 emission energy system based on PV and hydropower are analyzed. The reasoning and models are explained in detail, and the technical and economic consequences of such an energy turnaround are discussed. For the first time, the technical and economic impact of a complete replacement of fossil fuels with renewable energy (PV and hydroelectric) are quantified, and the case of a purely electric energy economy is implemented and compared with the production of energy carriers (e.g., hydrogen and hydrocarbons). The paper aims to illustrate the feasibility of a renewable energy supply and to quantify the challenges of the seasonal energy storage.
2 Energy Demand in Switzerland
The energy demand in Switzerland is analyzed and published annually by the Federal Office of Energy (Bundespublikationen, 2016) (Figure 2). We need to distinguish between the total energy demand, the primary energy demand, and the end use of energy. The total energy demand is significantly larger than the primary energy demand because of the energy imported in products, and the primary energy demand is larger than the end use of energy because of the efficiency limitations for electricity production. Today in Switzerland, approximately 53% of the electricity is produced by fully renewable hydroelectric power plants, 36% is produced by nuclear power plants (with an average efficiency of 25% from heat to electricity), and the remaining 11% are obtained from biofuels (<5.7%), waste incineration (<2.7%), PVs, and wind turbines. Thus, the electricity production of Switzerland is almost free of CO2 emission. In addition, Switzerland has a lower overall energy consumption of 6 kW·capita−1, against 8.2 kW·capita−1 in Great Britain. In Switzerland, the waste heat produced by nuclear power plants is not used with few exceptions, following the political decision of the people to avoid increasing the dependence on nuclear power plants for heat and electricity during the wintertime.
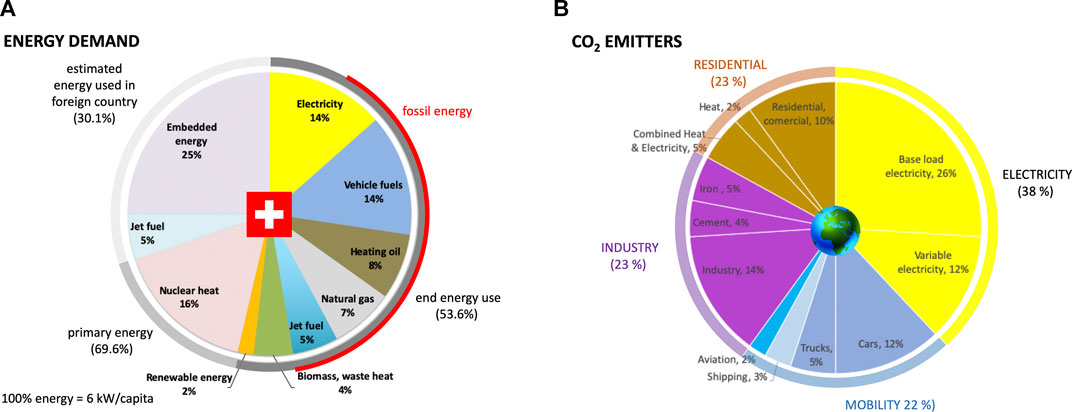
FIGURE 2. (A) Energy demand in Switzerland (100% = 6 kW·capita−1). The dark gray section corresponds to the end energy (3.2 kW·capita−1 = 54% of which 2.4 kW·capita−1 = 40% is non-renewable). Primary energy consumption (4.2 kW·capita−1 = 70%), which includes nuclear waste heat, is middle gray. The remaining 30% for embedded energy and jet fuel corresponds to the energy imported in products or used in foreign countries (light gray). The fossil fraction of the end energy use is marked red and amounts to 39.6% (left). (B) Global carbon dioxide (CO2) emissions (100% = 33.9 Gt CO2/year in 2014) for electricity production, mobility, industry, and residential (Davis et al., 2018) (right).
There is a linear relationship between energy consumption per capita and GDP per capita (Creutzig et al., 2015), which most countries of the world follow, with a slope of 2.5 kWh/CHF for GDP <13 kCHF/(capita·year). The CO2 emission intensity of the economies (Ritchie and Roser, 2020) worldwide is slowly decreasing from 0.44 kg/CHF to 0.34 kg/CHF in 1994 and 2014, respectively, owing to increases in efficiency and the growth in renewable energy. Converting (with 25% efficiency) the CO2 emissions per CHF into energy per CHF leads to 2.5 kWh/CHF, which is in perfect agreement with the amount of energy per CHF. This means, in turn, that the world economy is generating 0.4 CHF/kWh or 4 CHF/liter of fossil fuel.
The end use energy demand in Switzerland reached saturation or even slightly decreased in recent years. The end energy is complemented by nuclear waste heat, leading to the primary energy consumption. All imported embedded energy and the process energy of imported products are additional energy provided to the people in Switzerland. According to MacKay, (2009), the embedded energy amounts to 25% of the total energy demand in Great Britain. For this analysis, it is assumed that in Switzerland, the embedded energy also amounts to 25% of the total energy demand. Furthermore, jet fuel represents the jet fuel supplied in Switzerland and not the jet fuel used by Swiss passengers returning to Switzerland.
Mobility: A recent governmental statistical evaluation (Bundesamt für Statistik, 2010) showed that an average Swiss person travels 13,432 km/year on the road and 11,000 km/year in the air. The average consumption of airplanes is 3.7 L kerosene per capita per 100 km (Bartz et al., 2016). Therefore, the kerosene given in Figure 2 for the end use considers internal flights and those leaving Switzerland but not flights taken by Swiss people from other departure points such as return flights (half of the overall kerosene consumption). The annual average flight time is 18.3 h (with an average speed of 601 km/h). The average consumption of gasoline and diesel by cars is 4.65 L per capita per 100 km, and the annual average time spent in cars is 22.9 days (with an average speed of only 24.4 km/h).
The energy transition to a fossil-free energy economy requires the generation of the end energy (3.3 kW·capita−1) from renewable energy. Currently, 0.86 kW·capita−1 is produced from renewable generation including biomass and the electricity production from nuclear power corresponds to 0.24 kW·capita−1. The nonrenewable end energy is 2.02 kW·capita−1.
The energy consumption of a car (Kendall et al., 2017) with an internal combustion engine is W (kWh/100 km) = [0.015 m (kg)—2.1], and that of a battery-electric car is W (kWh/100 km) = 0.005 m (kg). This difference represents a potential reduction in the end energy consumption of vehicles by 0.62 kW·capita−1. Furthermore, the space-heating requirement could be provided by heat pumps with thermal storage or reduced by diminishing the thermal losses. High temperature heat such as cooking or industrial processes would replace gas by direct electric heating which would not significantly improve efficiency. The following analysis distinguishes the two cases shown in Table 1. In the first case, the fossil fuels are replaced by synthetic fuels and the electricity, currently produced by nuclear power, is produced from renewable energy (PV and wind). In the second case, the fossil fuels are replaced with electricity, except the jet fuel, which is replaced by synthetic fuel, produced from renewable energy (PV and wind).
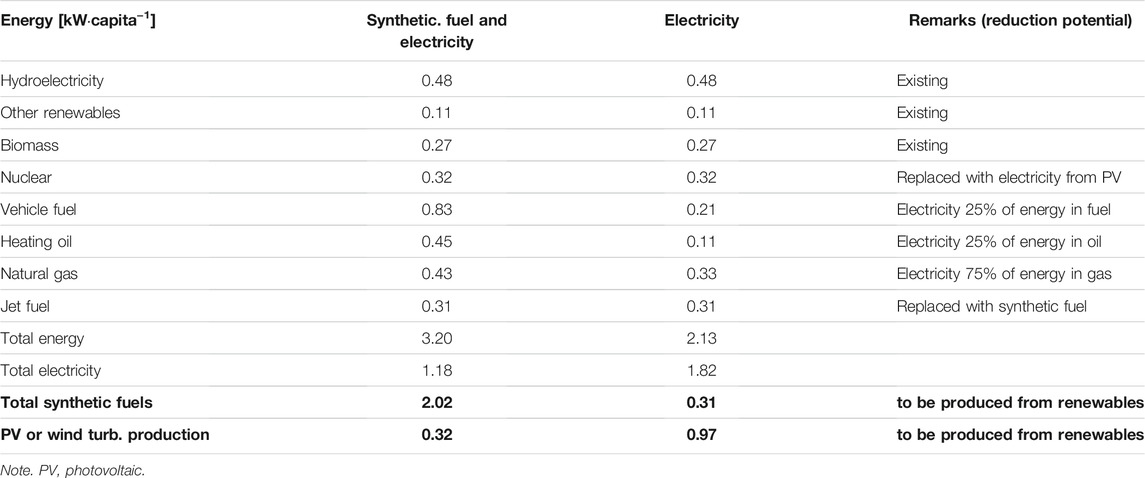
TABLE 1. End energy use in Switzerland in case of an energy carrier, e.g., fossil fuels, hydrogen, and synthetic hydrocarbons, and in the hypothetic case of complete electrification.
The monthly energy demand in Switzerland can vary between the different regions and is therefore approximated by the simplified average monthly demand shown in Figure 3.
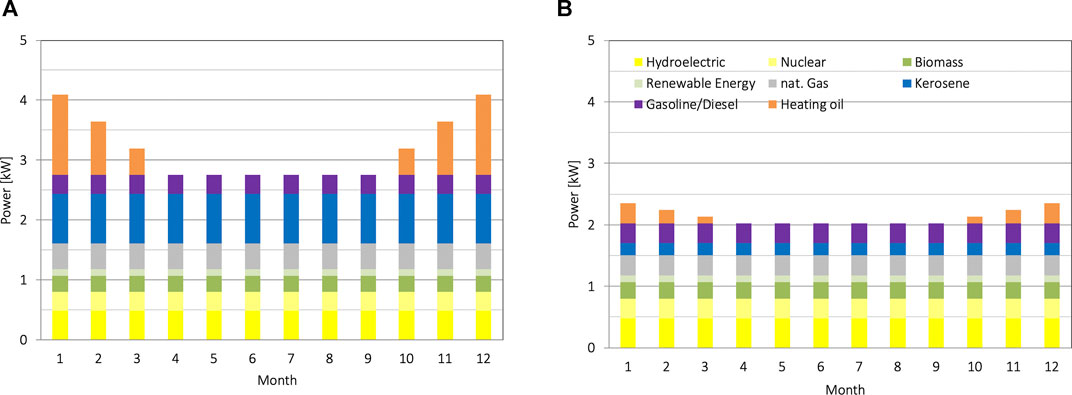
FIGURE 3. (A) Monthly demand for energy in Switzerland. (B) Calculated monthly demand for electricity in Switzerland, if all energy is electric except the jet fuel.
The current monthly average energy demand is 3.2 kW with a maximum in winter of 4.1 kW (127%) and a minimum of 2.75 kW (86%) in the summer. The calculated monthly average electricity demand including the saving described above is 2.1 kW with a maximum of 2.4 kW (110%) in winter and a minimum of 2.0 kW (95%) in the summer. Therefore, the electrification of the vehicles and heating reduces the annual average energy demand by 34% and the difference between summer and winter from 41% to 15%.
2.1 Potential of the Production of Electricity by Photovoltaics
In Switzerland, renewable energy can be obtained from hydropower, wind turbines, PVs, solar thermal photochemical devices, and biomass. Whereas hydropower combined with storage lakes allows for storage of energy and production on demand, the potential of wind power is limited, affording a ratio of peak power to average power of between 3 and 5 (Boccard, 2009) (inverse capacity factor).
The solar irradiation (Solargis, 2020) in Switzerland (Global Solar Atlas, 2020) is on average 1,100 kWh m−2 year−1 (Pavg = 125 W m−2). For simplicity, we assume that in addition to hydroelectricity, future renewable energy will be generated by PVs (Tröndle et al., 2019) (Table 2) with an efficiency of 20% and 200 WP m−2, resulting in an annual production of 220 kWh m−2 year−1 (125 W m−2). The population density (Worldometer, 2020) is 8.42·106/41,285 km2, which corresponds to 4,900 m2·capita−1. The urban area in Switzerland is 7.5% of the area of the country (Bundesamt für Raumentwicklung, 2020); therefore, there is a 370-m2·capita−1 urban area.
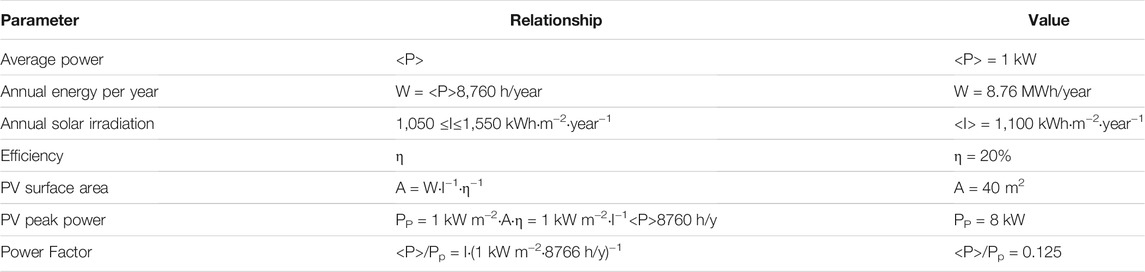
TABLE 2. Relationship between the relevant parameters of photovoltaics (PVs), e.g., average power of 1 kW.
The additional energy demand of 1 kW·capita−1 PV produced electricity leads to an area of 40 m2·capita−1.
Therefore, as a zero-order approximation, to meet the nonrenewable energy demand requires covering at over 10% of the urban area in Switzerland with PVs. An additional area is needed to produce the synthetic fuel for aviation.
2.2 Economics of Photovoltaic Electricity Production, Energy Conversion, and Storage
The economic analysis focuses on the current capital cost (CAPEX) of the PV panels and the energy storage system with an extrapolation to the future based on the past cost developments. The costs of installation, land surface area, and buildings for the energy conversion and storage systems are not considered because these costs vary significantly depending on the location and are small compared with those of the components. In order to compare the different storage options, which exhibit very different lifetimes and capacities, the cost of the released energy from the storage considering the corresponding efficiencies was determined. The capital cost (CAPEX or C) is assumed to be amortized during the whole life time (n years) and an interest of Z = 2%/year on the capital. From the cost series
where the operating cost (OPEX) is added and, in the case of a storage system also the cost of the energy (CC) provided to the system. Finally, this sum is divided by the annual energy received from the energy system (Ey) and the result is the cost of the energy per energy unit (CE).
2.2.1 Photovoltaic
The price of PV panels (Solar Choice, 2020) decreased from 30 kCHF/kWp in 1979 to 1.6 kCHF/kWp in 2012, which corresponds to a cost reduction of an order of magnitude in 27 years, or −8.9%/year. Following this pattern, we would expect the cost in 2020 to have decreased to 750 CHF/kWP. However, today, some panels in the EU are already offered (Photon-Solar, 2020) for a price <400 CHF/kWp with an efficiency close to 20%. The panels last for >20 years, and a recent survey in Switzerland showed that most panels are still working after 30 years (SWI, 2020). The cost of installation increases the cost of photovoltaics to ≈1,200 CHF/kWp including the rack installed.
2.2.2 Batteries
The price of Li-ion batteries (Fleer et al., 2017) is currently 200 CHF/kWh (2018) and decreased between 2008 and 2018 by an order of magnitude, or −20%/year. The cost of Li-ion batteries is decreasing exponentially and is expected to converge to 150 CHF/kWh around 2030 (Nykvist and Nilsson, 2015). The capacity of Li-ion batteries (Placke et al., 2017) increases with time and converges to 250 Wh/kg. The Tesla Powerwall (CleanTechnica, 2020b) has a capacity of 13.5 kWh and weighs 125 kg, resulting in a gravimetric energy density of 108 Wh/kg and costs 7,600 CHF for the battery only and 9,600 CHF to 15,600 CHF including installation (563 CHF/kWh). Lead-acid batteries are somewhat cheaper than Li-ion batteries; however, the costs per stored 1 kWh of energy are comparable (200 CHF/kWh). Therefore, we consider the data for Li-ion batteries for the cost estimation and assume the batteries have a lifetime of 8 years and make 250 full cycles. The storage of electricity by means of hydropower in a storage lake reaches a typical gravimetric energy density [Δh = 500 m, η = 82% (Horizons, 2020)] of 1.1 Wh/kg (1.1 kWh·m−3), and the capital cost is close to 2,000 CHF/kW (4 CHF/kWh) resulting in a storage cost of electricity of <0.1 CHF/kWh (International Renewable Energy Agency, 2012). The estimated time of operation of a hydropower plant is 80 years.
2.2.3 Hydrogen
The price of hydrogen is currently around 10 CHF/kg and is strongly dependent on the electricity cost (approximately 90% of the cost is electricity cost for large-scale electrolysis). Currently, operational proton exchange membrane (PEM) electrolysis (with an efficiency of 50%) consumes 80 kWh electricity per 1 kg of hydrogen; therefore, the price of energy in the form of hydrogen is 0.25 CHF/kWh. However, large-scale electrolysis, e.g., Lurgi™ 4 MW alkaline electrolysis or NEL hydrogen electrolysis, reaches 4 kWh/Nm3, which corresponds to 88% efficiency (Gallandat et al., 2017). The minimum cost of electrolyzers, based on the higher heating value of the produced hydrogen (HVV H2), is 3,000 CHF/kW, corresponding to approximately 1,500 CHF/kWel. (for electrolyzers with a power >10 kW in China and >3 MW in the EU/US). While the Lurgi alkaline electrolyzers have a typical lifetime in permanent operation of 30 years modern electrolyzers are expected to work for 10 years before the stack has to be replaced.
The cost of hydrogen storage depends on the type and size of the storage (Amos, 1998). Hydrogen can be stored as compressed gas, as liquid, and in hydrides. Compressed hydrogen storage on a small scale (<1,000 kg H2) costs <250 CHF/kg (<6.2 CHF/kWh) but requires a compressor. Composite high pressure hydrogen vessels cost 15–25 CHF/kWh. Large compressors (4 MW) cost 1,000 CHF/kW, and compressed gas vessels (>200 kg H2) cost 1,323 CHF/kg H2. We assume a lifetime of 10 years for pressurized vessels with 10 cycles per year. Large-scale underground storage (20 MPa) costs 8.80 CHF/kg H2 (0.22 CHF/kWh). The overall CAPEX for underground hydrogen storage, including compression is estimated to be 2.5 CHF/kWh. Metal hydride cost <2,500 CHF/kg H2 (<62 CHF/kWh). Very little change is observed in the cost of metal hydride (25 CHF/kg) over the last 15 years. Liquid hydrogen storage requires a liquefier that costs 44.1 kCHF/(kg·h) and a Dewar that costs 441 CHF/kg for 45 kg H2. The PEM fuel cells exhibit an efficiency of up to 60% and cost 1,000 CHF/kW. Fuel cells are expected to work for 10 years under permanent operation.
2.2.4 Synthetic Fuels
The minimum energy necessary for CO2 capture depends on the CO2 concentration and at 10% (in typical flue gas) and 400 ppm (in air) amounts to 36 and 120 Wh/kg (Lackner et al., 2012), respectively, the latter being less than 5% of the heating value of the hydrocarbon produced from CO2 and hydrogen. The cost of CO2 capture from air is estimated to be <0.5 CHF/kg CO2, and with optimization (Fasihi et al., 2019) of the energy source and the process, the cost may be reduced to <0.22 CHF/kg CO2. An example of an installed system for the capture of CO2 from air captures 2,500 kg CO2 per day with a capital investment of 3.6 million CHF [1,500 CHF/(kg CO2/day)]. The estimated energy requirement for CO2 absorption is 300 Whel./kg CO2 for air ventilation and 2 kWh/kg CO2 for desorption of CO2 (Vogel, 2017). Whereas the ventilation energy is electric energy, the desorption heat can be provided by waste heat sources (>100°C), if they are available.
The current synthesis of alkanes from CO2, e.g., octane (8CO2 + 25H2 ➝ C8H18 + 16H2O), converts 7 kg CO2 with 1 kg H2 to 2.3 kg octane and conserves 57% of the energy in hydrogen. The exothermic reaction provides 2.3 kWh of heat at >200°C per 1 kg CO2 which can be used to supply the desorption heat required by the capture process. The synthesis plant Pearl GTL facility in Qatar (Pearl GTL, 2020) produces 140,000 barrels of oil per day (10 GW) and has a cost of 18 billion CHF. This unique example shows that on a large scale, the synthesis of hydrocarbons (Fischer-Tropsch synthesis) requires an investment of close to 2,300 CHF/kW.
While batteries store electricity directly, a hydrogen-based economy requires the production of hydrogen, and for storage, and the applications to be made compatible with hydrogen. Going from hydrogen to hydrocarbons requires the capture of CO2 from atmosphere and the synthesis of hydrocarbons. In the case of methane (synthetic natural gas) also the storage of methane needs to be considered while the applications already exist. Finally, for liquid hydrocarbons, we only need to consider the synthesis since the storage and distribution infrastructure as well as the applications are already established.
Figure 4 shows the capital cost for the energy carriers as a function of the gravimetric energy density in order to have a measure for the amount of resources (material weight) needed to store a certain amount of energy. The capital cost does not reflect the real cost of storage since the life time and the stored amount of energy are very different for the various energy carriers, but it is used to calculate the resulting energy cost.
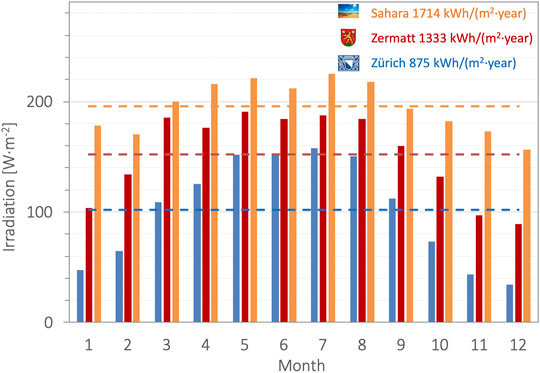
FIGURE 4. Monthly average solar irradiation. Dotted lines represent the annual average intensity. Ref. www.meteonorm.com.
2.3 Energy Conversion Efficiency
The size of the photovoltaic array required depends on the solar irradiation, the end energy demand, and the energy conversion efficiency. The efficiencies are affected by the thermodynamic limits and the technical feasibility, and are shown in Figure 5. The output electricity from the PV panels is considered as 100% following by the transformation and transport of the electricity. This part of the conversion chain is always necessary independent of the final energy carrier used. In the case of the electric energy system (ELC) the storage of electricity is needed due to the day/night cycle and the seasonal variation of the solar irradiation. The storage in batteries and in pumped hydropower plants is considered. Batteries offer an efficiency of around 90% while hydroelectric power plants have a round trip efficiency <72%.
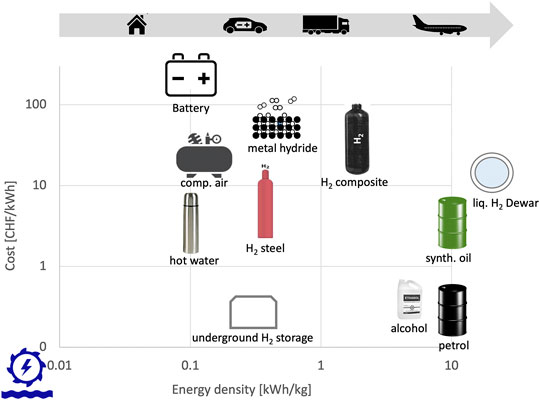
FIGURE 5. Capital cost of energy storage versus the gravimetric energy density.
3 Results
3.1 Storage Requirement
The storage requirement is determined by the difference between the time profile of PV production and the energy demand. For PVs, day/night storage is generally required to cover overnight demand and to balance the power variation during the day, while seasonal storage depends on the seasonal variation in PV production and energy demand over the different seasons. The minimum day/night storage capacity to average the solar power over day and night during all days of the year is given by 50% of the maximum daily PV production in July and is, therefore, close to 0.25% of the annual energy generation.
The size of the seasonal storage is determined by the distribution of the annual solar intensity at a specific location on the globe. It becomes smallest close to the equator, with almost no seasonal variation in intensity and a solar irradiation intensity greater than twice that in Switzerland. In locations where the heating requirement in winter is small and air conditioning contributes significantly to the energy demand in summer, the shape of the demand and the PV production curves is similar, reducing the need for seasonal storage. However, since the maximum energy demand in Switzerland occurs in winter, coinciding with the period of minimum PV generation, seasonal storage is necessary.
This is different in locations where the no heating in winter is required and air conditioning contributes significantly to the energy demand in summer. In such locations the shape of the demand and the PV production curves are similar.
For a PV production equal to the annual energy demand, a maximum size of the storage is necessary. The higher the solar intensity, the faster the necessary storage size decreases with increasing PV production.
The three locations shown in Figure 6 also show that for a large part of the year (74%, 83%, and 89% for Zürich, Zermatt, and the Sahara, respectively), only day/night storage is required. The size of the storage was computed based on the energy from solar intensity (Figures 7–9) and the energy demand profile (Figure 3). Even with significant over-capacity, day/night storage is beneficial, as it makes the electrical grid more resilient and decreases the power in the grid due to the peak shaving during the day significantly from the peak power to less than twice the average power of the PV.
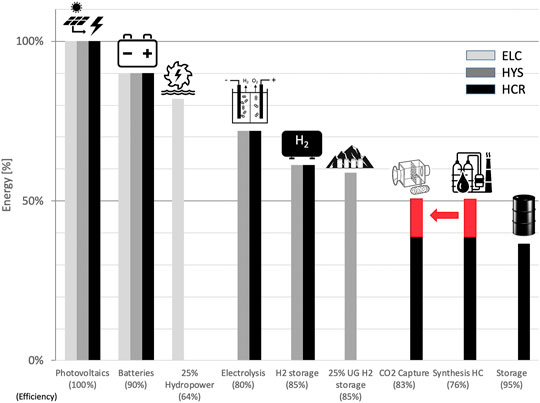
FIGURE 6. Efficiency loss along the conversion chain [light gray for substitution of fossil fuels through electrification (ELC), dark gray for substitution of fossil fuels by hydrogen (HYS), and black for substitution of fossil fuels by synthetic hydrocarbons (HCR)] relative to the electricity produced by photovoltaic (PV) (100%).
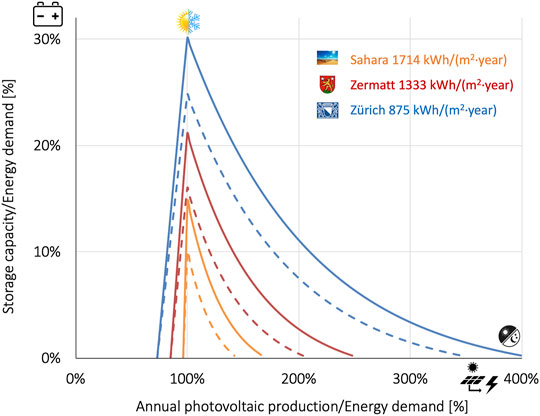
FIGURE 7. Necessary energy storage capacity (S) as a function of the annual PV production (PVy) in relation to the annual energy demand (Figure 3A line, Figure 3B dotted line). The curves maximum represents the seasonal storage and the minimum limit is a day/night storage of 0.25% of the annual energy demand.
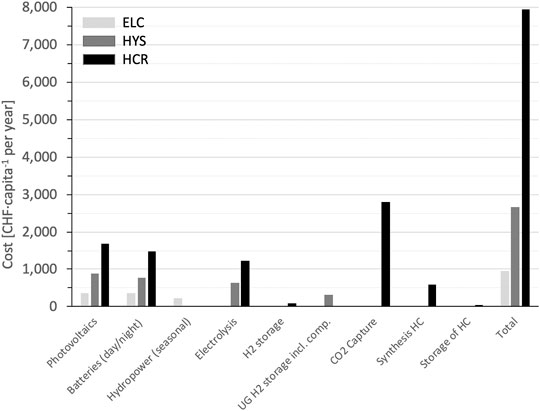
FIGURE 8. Cost (OPEX incl CAPEX interest) of the individual energy systems ELC (electricity cost ≈958 CHF), HYS (hydrogen cost ≈2656 CHF) and HCR (hydrocarbon cost ≈7896 CHF). OPEX, operational cost;; CAPEX, capital cost.
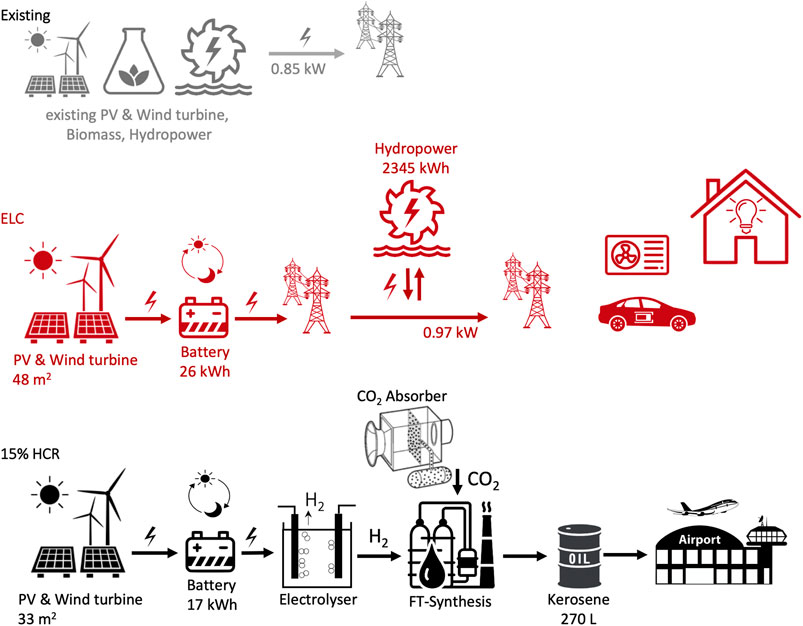
FIGURE 9. Schematic energy conversion and storage system for the electricity-based system ELC including the existing production of renewable energy and the production of synthetic hydrocarbons as jet fuel (per capita).
3.2 Renewable Energy Generation and Demand
Three approaches to fossil fuel replacement are considered:
ELC: Full electrification of all energy demand including heat and transport, except for aviation, with all new generation by PV.
HYS: Replacement of fossil fuels with hydrogen, except for aviation, produced from renewable electricity during the summer time.
HCR: Replacement of fossil fuels with synthetic hydrocarbons, e.g., octane, produced from renewable energy and CO2 capture from the atmosphere.
In order to replace fossil and nuclear fuels for all uses, three different energy systems are analyzed, which use a combination of these approaches.
In an electrified energy system based on ELC, except for jet fuel, which is replaced by synthetic fuels as in HCR (100% ELC + 15% HCR), electrification increases efficiency and reduces the energy demand significantly, however a large electricity storage is necessary.
In a hydrogen based energy system, adopting HYS to replace fossil fuels with hydrogen, the ELC approach is used to replace nuclear-produced electricity with electricity from renewable generation, and jet fuel is replaced with synthetic fuels as in HCR (33% ELC + 100% HYS + 15% HCR), the need for seasonal storage is met by storing hydrogen.
A hydrocarbon-based energy system using HCR, with nuclear-produced electricity replaced with renewable generation as in ELC (33% ELC + 100% HCR), has the advantage that storage and applications remain unchanged, and no additional infrastructure is required except for the carbon capture and hydrocarbon plants themselves. However, overall energy conversion losses require the largest PV installation of the three energy systems.
In all three energy systems the energy economy is CO2 neutral and based on renewable energy, mainly PV. Table 3 contains the components of each energy solution.
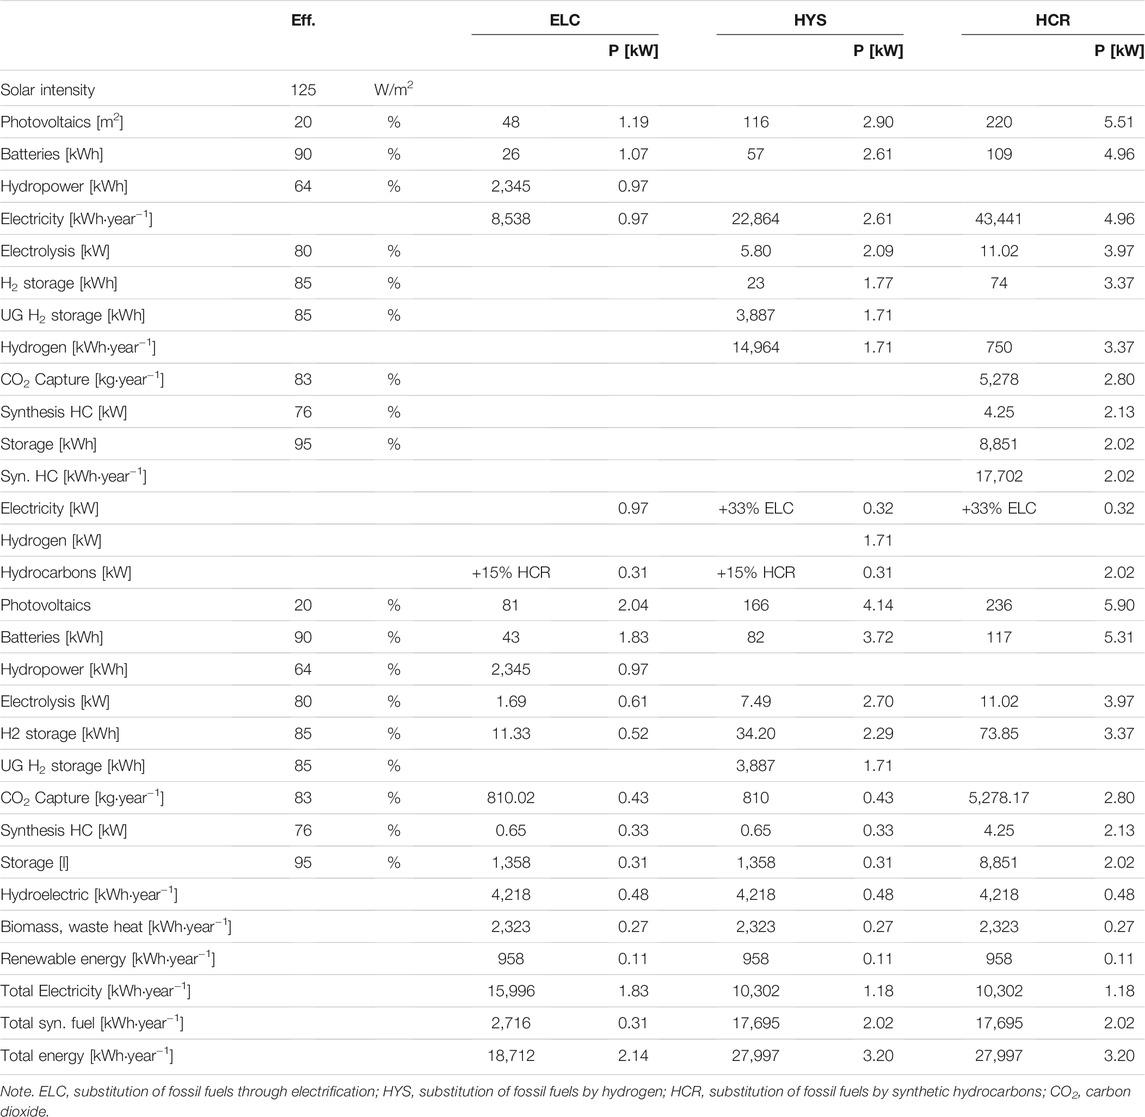
TABLE 3. The size of the key components per capita and year of the three energy systems in Switzerland (ELC left, HYS middle and HCR right) with an average solar irradiation of 1,100 kWh·m−2·year−1 (125 W/m2).
The PV surface area required in the ELC approach is slightly larger than the average living area of 46 m2·capita−1 in Switzerland; the production of the jet fuel would require a similar PV area again. Covering the roof surface area in Switzerland (Assouline et al., 2018) with PV could produce 24 TWh·year−1, which is equal to 326 W·capita−1 and corresponding to 34% of the electricity needed in ELC. In order to cover the energy demand including jet fuel, 30%, 45%, and 64% of the urban area in Switzerland would have to be covered with PV for the ELC, HYS, and HCR based energy systems, respectively.
The seasonal battery storage in ELC is 2.3 MWh·capita−1, which would take a 12,000 kg Li-ion battery (200 kWh/kg) or 18 TWh storage for Switzerland, while the day/night storage requires only 26 kWh, approximately 1% of the seasonal storage capacity. A decentralized or local day/night storage of electricity reduces the power in the electrical network by a factor of 7.5 (average versus peak power of the PV), i.e., the current grid installation is sufficient for ELC because during the day the electricity demand is covered locally and during the night the power corresponds to the average power.
In HYS, the energy density in compressed hydrogen (p = 200 bar) is 15 kg m−3 or 591 kWh m−3, and the necessary storage capacity is 3.9 MWh·capita−1. In addition to the storage, the compression of hydrogen and a distribution network has to be installed.
In HCR, the produced hydrogen is used to reduce the CO2 captured from the atmosphere (Gabrielli et al., 2020) to produce synthetic liquid hydrocarbons (e.g., octane or decane), which simplifies the storage of the energy carrier and especially allows the use of the established infrastructure. The challenge is to capture the CO2 from air and to reduce the CO2 with hydrogen on a selective catalyst to give a specific product rather than the large range of products synthesized by the well-established Fischer–Tropsch process; however, research is progressing in order to improve the control of the reaction. The thermodynamic limit of the energy conversion from hydrogen to octane is 76%. The heat released in the reduction reaction can be directly used for CO2 capture, in which the energy demand for the desorption of CO2 is the main energy contribution to the carbon capture process.
3.3 Capital Cost of the Renewable Energy Systems
Today, an average Swiss person spends 3,000 CHF/capita per year (Bundesamt für Energie, 2018) (on average 0.13 CHF/kWh) on energy, and the price is expected to increase owing to the diminishing fossil fuel resources. In the future economy based on renewable energy, the cost of energy is determined by the investments in the conversion and storage of renewable energy and the production and distribution costs (Table 4). Finding the ideal sizes of PVs, battery storage, and energy carriers is an optimization problem in order to minimize the investment and the final energy cost.
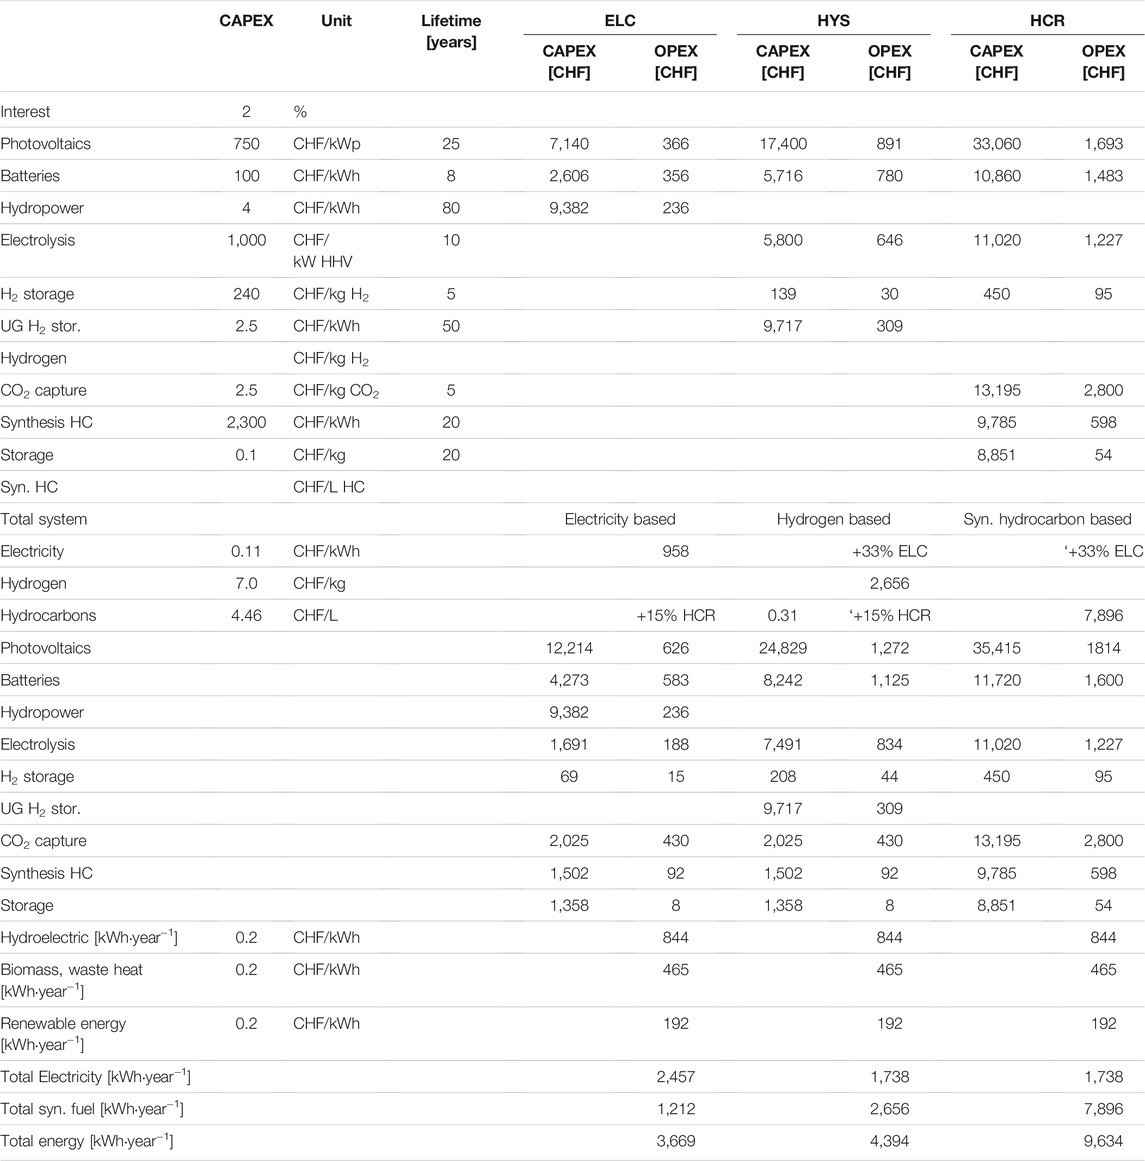
TABLE 4. The capital expenditure (CAPEX) and the operating expenditure (OPEX) incl. the capital cost (interest) per capita of the three energy systems in “Zürich.”
Providing seasonal storage in the electricity based system ELC using batteries would massively increase the cost leading to a CAPEX of >200,000 CHF/capita and an annual electricity cost of >30,000 CHF/capita. Storage of electricity in a hydroelectric power plant, without considering grid cost, is estimated to cost <0.1 CHF/kWh leading to an energy cost comparable with the current energy cost ≈3,000 CHF/capita per year with a CAPEX of <20,000 CHF/capita. The resulting electricity cost is 2,457 CHF/capita per year (0.11 CHF/kWh).
In the hydrogen-based system HYS, the cost is determined by the hydrogen production (PV, battery and electrolysis). Large-scale underground hydrogen storage reduces the CAPEX for storage compared with pressurized cylinders or metal hydrides by more than an order of magnitude and the cost for hydrogen to 7.0 CHF/kg (0.17 CHF/kWh). The resulting hydrogen cost is 2,656 CHF/capita per year.
The cost in the energy system based on synthetic fuels HCR is due to the efficiency of the whole conversion chain of 36%, which is higher than for hydrogen. The highest component cost is found for CO2 capture, which will certainly decrease in the near future. The resulting fuel cost is 7,896 CHF/capita per year. The synthetic hydrocarbons are produced for a cost of 4.46 CHF/L including the jet fuel (Figure 8).
Cost of the conversion applications for electrification or hydrogen are not considered.
The total energy cost results from the combinations for the electricity based (100% ELC + 15% HCR) or hydrogen based (33% ELC + 100% HYS + 15% HCR) or finally by synthetic hydrocarbon based (33% ELC + 100% HCR) system and the existing renewable energy (hydropower, biomass, and other renewables) costs.
4 Discussion
Three approaches to fossil fuel substitution (ELC, HYS, and HCR) were distinguished, and the corresponding energy systems were analyzed in detail. The size of the PV and the size of the storage are strongly dependent on the solar intensity and the variation in the intensity over the seasons, respectively.
In the future, the major part of renewable energy will be produced by PV (s. Figure 1). PV is the only form of renewable energy in Switzerland that has the potential to cover the energy demand in combination with already existing renewable energy and 1) 100% ELC and 15% HCR for aviation fuel, 2) 33% ELC, 100% HYS, and 15% HCR, 3) 33% ELC and 100% HCR.
4.1 Electricity-Based Energy System, Substitution of Fossil Fuels Through Electrification
ELC is a completely electrified energy system, where the mobility is electric and the heating of buildings is everywhere realized with heat pumps. Therefore, this approach significantly lowers energy demand (−30%) compared with the current energy economy. To complete the electricity based energy system, it is assumed that the jet fuel is produced as synthetic hydrocarbons. The electricity is produced by PVs and stored in batteries or in hydropower plants for day/night and seasonal storage, respectively. The PV area is 48 m2·capita−1 for electricity production, which is close to 13% of the urban area in Switzerland, and a further 33 m2·capita−1 for jet fuel production. The seasonal electricity storage is 2,345 kWh·capita−1 (1,020 kWh·capita−1 currently existing) in addition to 26 kWh·capita−1 for day/night storage. The local availability of day/night storage increases the resilience and reliability of the grid and reduces the peak power in the grid by almost an order of magnitude.
Therefore, local distributed battery storage is inevitable in ELC and if the battery cost is 100 CHF/kWh would cost 356 CHF/capita per year. The main challenge of the electric system is the seasonal storage of 18 TWh for Switzerland, which corresponds to 40 times the world Li-battery production of 2020 and would cost 36,000 CHF/capita per year. Therefore, the seasonal storage of the electricity in batteries is neither technically nor economically a feasible solution for Switzerland. However, electricity storage in a hydroelectric power plant is three orders of magnitude cheaper than in batteries at a cost of 0.1 CHF/kWh without grid cost. Due to the efficiency of the pump and turbine, each around 80%, 56% more electricity has to be produced by PV and 25% more electricity has to be stored as compared with a battery storage. The volumetric energy storage density in a hydroelectric power plant is 1.1 kWh·m−3, and a storage lake volume of 16.3 km3 could store 18 TWh, two times the total storage capacity of all lakes of current hydroelectric power plant in Switzerland or 13 times the Grand Dixence hydropower plant (1,570 GWh) in Valais, Switzerland.
In summary, ELC can be realized but requires a massive expansion of the hydropower storage capacity in Switzerland, amounting to a hydropower plant of the size of Grand-Dixence hydropower plant being built every year until 2035.
The total cost is 2,485 CHF/capita per year for electricity and 1,184 CHF/capita per year for kerosene, the overall energy cost of 3,669 CHF/capita per year is comparable with the energy cost in the current system. The resulting electricity cost is 0.11 CHF/kWh and the kerosene cost is 4.5 CHF/L.
4.2 Hydrogen-Based Energy System, Substitution of Fossil Fuels by Hydrogen
In the hydrogen-based energy system (Winter and Nitsch, 1989) HYS, the fossil fuels are replaced with hydrogen except for the jet fuel. The energy demand in HYS is assumed to be identical to the current energy demand, although the energy demand in mobility, due to the use of fuel cells, is potentially lower. Seasonal storage is realized by centralized hydrogen production and storage, i.e., 6.5 m3·capita−1 or 57 Mm3 for Switzerland, corresponding to approximately 25 times the volume of the Gotthard base tunnel. The storage of compressed hydrogen in steel cylinders costs 6.3 CHF/kWh and in a large underground cavity approximately one order of magnitude less resulting in 2,656 CHF/capita per year and 7.0 CHF/kg hydrogen. In addition to the seasonal centralized underground storage, local storage is required as well as storage for the mobile applications. The size of the PV for HYS is 116 m2·capita−1, >100% larger than for ELC due to the conversion efficiency, and in addition 33 m2·capita−1 for jet fuel production (Figure 9).
The hydrogen-based system requires a larger electricity production due to the conversion losses in the electrolyzer (efficiency between 50% and 85%). Furthermore, the hydrogen-based system requires installations for hydrogen production, hydrogen storage, and distribution, as well as hydrogen applications. The second energy system, HYS (Figure 10), uses batteries only to provide continuous constant electric power to run an electrolyzer for 6 months of the year to produce hydrogen, which is stored in underground cavities. However, in a hydrogen economy, storage is distributed and only partially centralized; therefore, underground storage is only partly feasible and a pipeline system is installed nationwide.
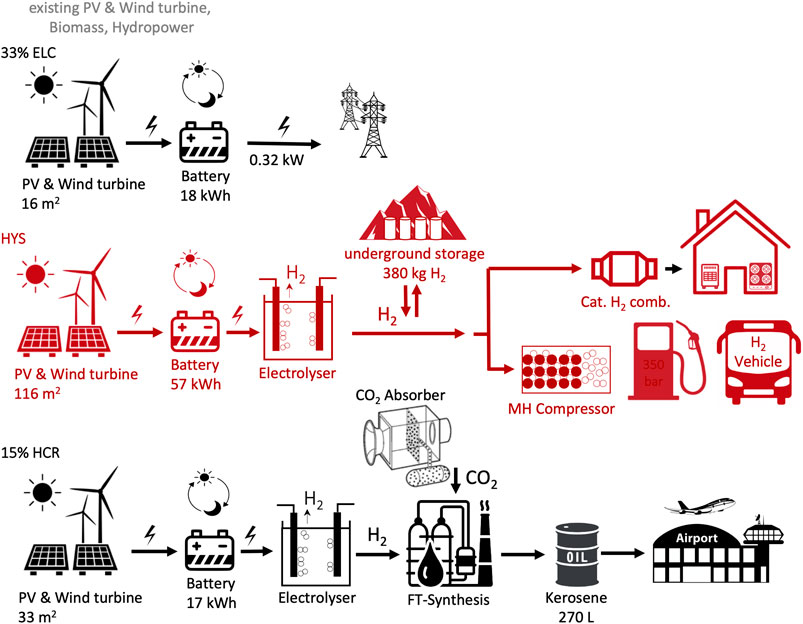
FIGURE 10. Schematic energy conversion and storage system for the hydrogen based energy system HYS including the existing production of renewable energy, the electricity production to replace the electricity from nuclear power with renewable and the production of synthetic hydrocarbons as jet fuel (per capita).
The capital cost of HYS is close to 40 kCHF/capita, and the final cost of hydrogen is estimated to be around 7.0 CHF/kg, which is comparable with the current cost of hydrogen produced from renewable energy and approximately three times higher than the cost of hydrogen from steam reforming. The total cost is 2,656 CHF/capita per year for hydrogen, 1,817 CHF/capita per year for electricity, and 1,184 CHF/year for kerosene, the overall energy cost of 4,394 CHF/capita per year is less than twice the energy cost in the current energy system. The analysis does not include the cost of the applications that are running currently with fossil fuels and have to be converted to use hydrogen.
4.3 Hydrocarbon-Based Energy System, Substitution of Fossil Fuels by Synthetic Hydrocarbons
The hydrogen can be used to reduce CO2 captured from air and to produce synthetic hydrocarbons. The conversion losses including the capture of CO2 require a significantly larger PV installation. However, the main advantage of synthetic hydrocarbons is that they are easy to store and distribute, the infrastructure already exists, and all the applications already exist. The third energy system, HCR (Figure 11), is a system consisting of PVs of 220 m2·capita−1 corresponding to 60% of the urban area in Switzerland. From April to September, synthetic fuel is produced and stored in 11.3 barrels·capita−1. In the synthesis reaction, 76% of the energy in hydrogen is transferred into hydrocarbons, and the heat from the exothermic reaction can be used for the desorption step in the CO2 capture from the air. Between April and September (6 months), the PV energy generation varies between 75% and 100% of the maximum. The battery storage is large enough in order to provide electricity during the night all year long and is close to the full power production of synthetic hydrocarbons during 6 months of the year. Large-scale hydrogen storage is underground adjacent to CO2 capture, and the synthesis of hydrocarbons runs continuously at a constant rate. The capital cost of HCR is close to 90 kCHF/capita and is dominated by the CO2 capture, leading to an estimated cost of the synthetic hydrocarbon of 4.5 CHF/kg. The overall energy cost including the electricity cost for a synthetic hydrocarbon based energy system is 9,634 CHF/capita per year.
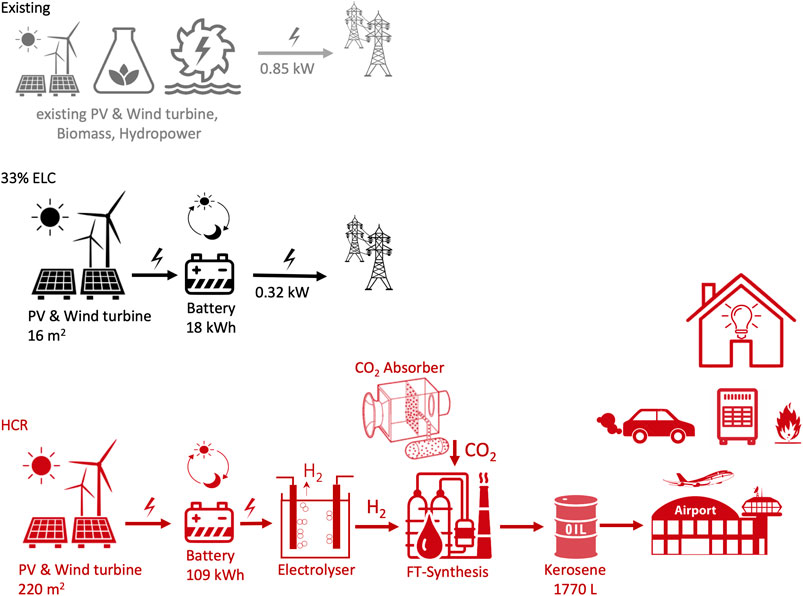
FIGURE 11. Schematic energy conversion and storage system for the synthetic hydrocarbon based energy system HCR including the existing production of renewable energy and the electricity production to replace the electricity from nuclear power with renewable (per capita).
The annual energy provided from the various sources in order to cover the entire energy demand of the electricity based and synthetic fuel (hydrogen or hydrocarbons) based energy economy is summarized in Table 5. The electricity-based system is the most efficient requiring the least amount of energy. Furthermore, it also provides the energy for the lowest cost. The hydrogen and synthetic hydrocarbon-based energy systems require 50% more energy and the cost is 20% and 160% more expensive, respectively, as compared with the electricity-based system.

TABLE 5. Total annual energy and cost per capita per year for the three options: electricity based, hydrogen based, and synthetic fuel-based energy economy.
4.4 Optimization Potential
The main technical and economic challenge in ELC and HYS is the seasonal energy storage and in HCR, the CO2 capture. The installation of a renewable energy system close to the equator would (Winter, 1993) have several advantages: 1) the solar irradiation is greater than twice as high as in Switzerland, which reduces the size and cost of the PVs by more than 50%; 2) the seasonal effect almost disappears, so only day/night storage is required and no seasonal storage is necessary; and 3) the production of the synthetic fuel may be distributed over the whole year with half the size of the installation. Therefore, the overall capital cost is reduced to approximately half of the cost of the energy system installed in Switzerland and the synthetic hydrocarbons become half as expensive. Furthermore, due to the conversion efficiency, the production of synthetic hydrocarbons requires a PV that produces approximately 300% of the energy in the hydrocarbons. However, such a PV installation already covers more than 95% of the annual energy demand in Zürich and 100% in Zermatt with just day/night storage. As a consequence, the ideal energy system has to be adaptive to the local requirements and may be a mixture of the three energy systems discussed in this paper.
4.5 Economic Impact and Challenges
The global relationship between the GDP and the energy demand per capita is 0.4 CHF/kWh (Muller, 2009), which corresponds to the amount of income produced by 1 kWh of energy invested based on an energy cost of 0.13 CHF/kWh. Because fossil fuels in Switzerland are imported, the energy cost is an expenditure for the country. In the case of renewable energy, at least a part of the cost can be spent within the country and contributes positively to the GDP. These renewable energy systems ELC, HYS, and HCR lead to an energy cost of 0.11–0.45 CHF/kWh, which is close to the GDP/kWh and, therefore, may have a significant impact on industrial energy related benefits. Since there is potential for increased efficiency in production processes, the economy may be sufficiently resilient to adapt to renewable energy. The cost of energy (electricity) will become very much season dependent, therefore, electricity in summer will become very cheap or free while electricity in winter will be rather expensive.
The major challenge in replacing fossil fuels with renewable energy is seasonal storage (30% of the annual energy demand) and mobility (10%–30% of the annual energy demand). Mobility demands an energy carrier with a high gravimetric energy density, because energy demand for driving is proportional to the weight of the vehicle; therefore, an ideal electric vehicle with a battery consumes approximately W [kWh/100 km] = 0.005 m [kg] = 10 kWh/100 km for a 2,000 kg vehicle including recuperation. Current available vehicles consume twice that amount of energy 20 kWh/100 km. Electrifying the mobility sector with batteries requires a grid supplying a higher power and increases the electricity demand in the winter, with the consequence that the demand for seasonal storage increases, making the introduction of renewable energy more challenging.
4.6 Nuclear Power
If the electricity produced by nuclear power in Switzerland today is replaced by PVs, only 16 m2·capita−1 = 134 km2 for Switzerland producing 24 TWh/year is necessary, as well as electricity storage capacity of 9,000 GWh, in addition to the 9,000 GWh hydroelectric storage capacity that already exists. The PV area corresponds to the roof area potentially available in Switzerland (Assouline et al., 2018). The annual electricity demand in Switzerland is 58 TWh, already today 10.7% is exported in summer and 7.9% is imported in winter (4,550 GWh). The import corresponds to 50% of the hydroelectric storage capacity of 9,000 GWh.
Increasing the storage capacity of the lakes of existing hydroelectric power plant is essential in order to increase the contribution of renewable energy in Switzerland.
4.7 Electrification Without Seasonal Storage
In the purely electric system (ELC) with only day/night storage, close to 75% of the energy demand can be covered. The remaining 25% in Winter (0.32 kW·capita−1) have to be covered by electricity production from fossil fuels since heating is based on heat pumps and mobility is electric. Therefore, an additional 0.8 kW·capita−1 of fossil fuel are required for the thermal power plants (combined cycle efficiency = 40%), which would run only 5 months of the year and consume 60,000 GWh of natural gas, producing 6.5 GWel. during 5 months. Therefore, approximately six thermal power plants (1.1 GWel. each) are required running for 150 days/year and emitting >10·109 kg of CO2. Adding the jet fuel (0.32 kW·capita−1) producing 5.6·109 kg CO2 per year slightly more than 38% of the current annual CO2 emission of Switzerland (40·109 kg). The electrification of the energy economy without massive expansion of the storage capacity needs to be complemented with six thermal power plants running with natural gas and leads to a CO2 reduction of only 62% as compared with today’s CO2 emissions from fossil fuels.
5 Conclusion
The technical and economic consequences of the replacement of the fossil fuels consumed in Switzerland with renewable energy (PV and hydroelectric) was investigated. The requirements and challenges for a net-zero fossil CO2 emission, for a purely electric energy system, and for the production of synthetic energy carriers, i.e., hydrogen and hydrocarbons were analyzed.
The completely electrified energy system (ELC) is the most efficient but aviation fuel production needs to be added. ELC requires covering approximately 13% of the urban area of Switzerland with PV. Battery storage is required to provide overnight demand and to balance the PV production during the day in order to lower peak power in the grid. For seasonal storage, pumped hydroelectric power stations need to be built in order to store electricity economically, if grid cost is neglected. The main challenges for a completely electrified system are the increase in the storage capacity to 320% of the pumped hydroelectric power stations and to avoid or significantly reduce grid cost. If storage is not possible six 1 GW gas fired thermal power stations are necessary in order to cover the electricity demand in winter and would lead to a CO2 emission of 40% of the present CO2 emissions from the use of fossil energy carriers.
The production and storage of a synthetic energy carrier like hydrogen (HYS) requires a larger PV installation of 32% of the urban area of Switzerland due to the conversion losses of the production and use of hydrogen. In addition, the electricity currently produced by the nuclear power stations has to be covered as well as the aviation fuel. The storage of hydrogen is most economical under pressure in underground caverns and requires a volume of 57 Mm3 or approximately 25 times the Gotthard base tunnel. The main challenges of a hydrogen based energy system are the 2.5 times larger area of PV as compared with ELC and the huge underground storage volume necessary.
The production of synthetic hydrocarbons (HCR) requires the largest PV installation of 60% of the urban area of Switzerland due to the conversion losses of the production and the use of hydrocarbons. In addition, the electricity currently produced by the nuclear power stations has to be covered. The storage of hydrocarbons and the applications are established technologies and do not require a change of the infrastructure or applications.
The energy demand can be covered by the already existing renewable energy with 100% ELC and 15% HCR for aviation fuel, leading to a cost of energy of 3,669 CHF·capita−1/year, comparable with the average energy cost today, based on fossil fuels. The second option is the already existing renewable energy with 33% ELC, 100% HYS, and 15% HCR for aviation fuel leading to a cost of 4,394 CHF·capita−1/year, 50% more than the energy cost of today. Finally, the third option is the already existing renewable energy with 33% ELC and 100% HCR leading to a cost of 9,634 CHF·capita−1/year, a bit more than three times the energy cost of today.
The electric energy system, as well as the hydrogen energy system requires a significant change of the infrastructure and the applications while the synthetic fuel-based system allows to use the current infrastructure and applications.
Electricity can be generated more cheaply by building the energy system close to the equator, where a large area of desert is available with high solar intensity and low seasonal variation; in some regions, e.g., Qatar (Pearl GTL, 2011), the oil industry already operates plants for synthetic oil production. This raises an additional topic besides the technical and economic feasibility: the political aspect of international collaboration, which is crucial for the future development of the world, especially toward the renewable energy economy.
What is the short-term and mid-term future? The electrification of mobility and heat-pumps for heating increase the demand for electricity in the winter, when less electricity is available, which could force Europe to continue running fossil-fueled power plants. The development of technologies based on nuclear fusion, the heart of solar energy, progresses as a research topic, costs grow but commercial electricity production is quite unlikely for this century (Mannheimer, 2020).
The technical and economic feasibility of the replacement of fossil energy with renewable sources in Switzerland was demonstrated. However, a massive impact on the environment due to the installation of PV and the seasonal energy storage is expected. A large part of this investment is in Switzerland keeping economic benefits in the country, in contrast to renewable energy conversion close to the equator. The variation of the cost of electricity is also an opportunity for future industry and economy, where energy intense processes could be concentrated in the summer time when energy is readily available and at low cost.
Data Availability Statement
The original contributions presented in the study are included in the article/Supplementary Material. Further inquiries can be directed to the corresponding author.
Author Contributions
CRediT author statement AZ did the conceptualization, methodology, writing,-reviewing, and editing of the original draft.NG performed the formal analysis and methodology. PD also conceptualized, reviewed, and edited the draft. LS also contributed to the conceptualization, methodology, review, and editing of the draft. PWG also performed the formal analysis, handled the acquisition of resources, and took part in the review of the draft. S-IO contributed to the review of the manuscript.
Funding
The financial support by SCCER Heat and Energy Storage (Innosuisse) is greatly acknowledged.
Conflict of Interest
The authors declare that the research was conducted in the absence of any commercial or financial relationships that could be construed as a potential conflict of interest.
Publisher’s Note
All claims expressed in this article are solely those of the authors and do not necessarily represent those of their affiliated organizations, or those of the publisher, the editors, and the reviewers. Any product that may be evaluated in this article, or claim that may be made by its manufacturer, is not guaranteed or endorsed by the publisher.
Acknowledgments
The critical review of the contents by René Bauz and Gilles Verdan from Gaznat is greatly acknowledged.
Abbreviations
ES, energy systems; ELC, substitution of fossil fuels through electrification; HYS, substitution of fossil fuels by hydrogen; HCR, substitution of fossil fuels by synthetic hydrocarbons; PV, photovoltaics; CO2, carbon dioxide; kWh/year, kilowatt hours per year = terawatts·10−9 kW/TW·365 day/year·24 h/day; GWp, gigawatt peak; TWp, terawatt peak; <P>, average power; W, annual energy per year; I, annual solar irradiation; η, efficiency; A, PV surface area; PP, PV peak power; Pavg, average power; <P>/PP, power factor; C, capital cost (CAPEX); Z, interest; Pb, annual payback; n, number of years; CE, cost of the energy per energy unit; Ey, annual energy received from the energy system; OPEX, operational cost; Cc, cost of the energy.
References
Amos, W. A. (1998). Costs of Storing and Transporting Hydrogen. Available at: https://www.nrel.gov/docs/fy99osti/25106.pdf (Accessed March 20, 2020).
Arrhenius, S. (1896). XXXI.On the Influence of Carbonic Acid in the Air upon the Temperature of the Ground. Lond. Edinb. Dublin Philos. Mag. J. Sci. 41, 237–276. doi:10.1080/14786449608620846
Assouline, D., Mohajeri, N., and Scartezzini, J.-L. (2018). Large-Scale Rooftop Solar Photovoltaic Technical Potential Estimation Using Random Forests. Appl. Energ. 217, 189–211. doi:10.1016/j.apenergy.2018.02.118
Barney, G. O. (1988). The Global 2000 [two Thousand] Report to the President of the U.S. – Entering the 21st century. A report. Prepared by the Council on Environmental Quality and the Department of State. New York: Pergamon Press. DNB 550695664.
Bartz, D., Stockmar, E., Schmidt-Landenberger, E., and Meyerhoff, J. (2016). OBEN IHR FLUGBEGLEITER. 1st Auflage. Heinrich-Böll-Stiftung und der Airbus Group. Available at: https://www.boell.de/de/2016/06/01/fliegen-im-verkehrsvergleich (Accessed April 8, 2020).
BMU (2008). Erneuerbare Energien in Zahlen. Berlin: Bundesministerium für Wirtschaft und Energie (BMWi), Öffentlichkeitsarbeit. Available at: https://www.bmwi.de/Redaktion/DE/Publikationen/Energie/erneuerbare-energien-in-zahlen-2019.pdf?__blob=publicationFile&v=6 (Accessed March 20, 2020).
Boccard, N. (2009). Capacity Factor of Wind Power Realized Values vs. Estimates. Energy Policy 37, 2679–2688. doi:10.1016/j.enpol.2009.02.046
Bundesamt für Energie (2018). Schweizerische Gesamtenergie Statistik. Art.-Nr. 805.006.18/08.19/1100/860444100. Switzerland: Federal Office of Energy. Available at: https://www.bfe.admin.ch/bfe/de/home/versorgung/statistik-und-geodaten/energiestatistiken/gesamtenergiestatistik/ (Accessed March 20, 2020).
Bundesamt für Raumentwicklung (2020). Available at: https://www.are.admin.ch/are/de/home/raumentwicklung-und-raumplanung/grundlagen-und-daten/fakten-und-zahlen/flaechennutzung.html (Accessed March 17, 2020).
Bundesamt für Statistik (2010). Mobilität in der Schweiz, Ergebnisse des Mikrozensus Mobilität und Verkehr. Available at: https://www.are.admin.ch (Accessed April 8, 2020).
Bundespublikationen (2016). Energy Consumption in Switzerland. Available at: Order number: 805.006.16.d/f Internet: www.bfe.admin.ch/statistics (Accessed April 8, 2020).
CleanTechnica (2020a). Global Solar Energy Capacity (GW). Available at: http://cleantechnica.com/2016/08/17/10-solar-energy-facts-charts-everyone-know/(Accessed March 20, 2020).
CleanTechnica (2020b). Everything You Need To Know About The Tesla Powerwall. Available at: https://cleantechnica.com/2019/01/19/everything-you-need-to-know-about-the-powerwall-2-2019-edition/(Accessed March 17, 2020).
Creutzig, F., Baiocchi, G., Bierkandt, R., Pichler, P.-P., and Seto, K. C. (2015). Global Typology of Urban Energy Use and Potentials for an Urbanization Mitigation Wedge. Proc. Natl. Acad. Sci. USA 112 (20), 6283–6288. doi:10.1073/pnas.1315545112
Davis, S. J., Lewis, N. S., Shaner, M., Aggarwal, S., Arent, D., Azevedo, I. L., et al. (2018). Net-zero Emissions Energy Systems. Science 360, 1–9. doi:10.1126/science.aas9793
Fasihi, M., Efimova, O., and Breyer, C. (2019). Techno-economic Assessment of CO2 Direct Air Capture Plants. J. Clean. Prod. 224, 957–980. doi:10.1016/j.jclepro.2019.03.086
Fleer, J., Zurmühlen, S., Meyer, J., Badeda, J., Stenzel, P., Hake, J.-F., et al. (2017). Price Development and Bidding Strategies for Battery Energy Storage Systems on the Primary Control reserve Market. Energ. Proced. 135, 143–157. doi:10.1016/j.egypro.2017.09.497
Gabrielli, P., Gazzani, M., and Mazzotti, M. (2020). The Role of Carbon Capture and Utilization, Carbon Capture and Storage, and Biomass to Enable a Net-Zero-CO2 Emissions Chemical Industry. Ind. Eng. Chem. Res. 59 (15), 7033–7045. doi:10.1021/acs.iecr.9b06579
Gallandat, N., Romanowicz, K., and Züttel, A. (2017). An Analytical Model for the Electrolyser Performance Derived from Materials Parameters. Jpee 05, 34–49. doi:10.4236/jpee.2017.510003
Global Solar Atlas (2020). Global Solar Atlas. Available at: https://globalsolaratlas.info/map?c=-7.188101,42.890625,2 (Accessed March 17, 2020).
Horizons (2020). A Reservoir of Difficulties for Hydropower. Available at: https://www.horizons-mag.ch/2020/03/05/a-reservoir-of-difficulties-for-hydropower/ (Accessed March 17, 2020).
International Renewable Energy Agency (2012). Renewable Energy Technologies: Cost Analysis Series, Volume 1: Power Sector. Hydropower, IRENA, Issue 3/5. Available at: https://www.irena.org/-/media/Files/IRENA/Agency/Publication/2012/RE_Technologies_Cost_Analysis-HYDROPOWER.pdf.
Jevons, W. S., and Flux, A. W. (1865). “The Coal Question; an Inquiry Concerning the Progress of the Nation, and the Probable Exhaustion of Our Coal-Mines,” in The Coal Question. Editor W. S. Jevons (London: Macmillan).
Kendall, K., Kendall, M., Liang, B., and Liu, Z. (2017). Hydrogen Vehicles in China: Replacing the Western Model. Int. J. Hydrogen Energ. 42, 30179–30185. doi:10.1016/j.ijhydene.2017.10.072
Lackner, K. S., Brennan, S., Matter, J. M., Park, A. H. A., Wright, A., and van der Zwaan, B. (2012). The Urgency of the Development of CO2 Capture from Ambient Air. Proc. Natl. Acad. Sci. 109 (33), 13156–13162. doi:10.1073/pnas.1108765109
Mann, M. E., Bradley, R. S., and Hughes, M. K. (1999). Northern Hemisphere Temperatures during the Past Millennium: Inferences, Uncertainties, and Limitations. Geophys. Res. Lett. 26, 759–762. doi:10.1029/1999gl900070
Mannheimer, W. (2020). ITER and the Prospects for Commercial Fusion. Phys. Today 73, 10. doi:10.1063/PT.3.4513
Muller, R. (2009). Physics and Technology for Future Presidents: An Introduction to the Essential Physics Every World Leader Needs to Know, Princeton University Press, 2010, ISBN: 9780691135045.
Nykvist, B., and Nilsson, M. (2015). Rapidly Falling Costs of Battery Packs for Electric Vehicles. Nat. Clim Change 5, 329–332. doi:10.1038/nclimate2564
Our World in Data (2020). Energy. Available at: https://ourworldindata.org/energy (Accessed June 5, 2020).
Pearl GTL (2011). Available at: https://en.wikipedia.org/wiki/Pearl_GTL.
Pearl GTL (2020). Pearl GTL is a gas to liquids (GTL) plant based in Ras Laffan, Qatar. Available at: https://en.wikipedia.org/wiki/Pearl_GTL (Accessed March 17, 2020).
Petit, J. R., Jouzel, J., Raynaud, D., Barkov, N. I., Barnola, J.-M., Basile, I., et al. (1999). Climate and Atmospheric History of the Past 420,000 Years from the Vostok Ice Core, Antarctica. Nature 399, 429–436. doi:10.1038/20859
Photon-Solar (2020). Photon Solar Energy GmbH. Available at: http://www.photon-solar.de/ (Accessed March 17, 2020).
Placke, T., Kloepsch, R., Dühnen, S., and Winter, M. (2017). Lithium Ion, Lithium Metal, and Alternative Rechargeable Battery Technologies: the Odyssey for High Energy Density. J. Solid State. Electrochem. 21, 1939–1964. doi:10.1007/s10008-017-3610-7
Ritchie, H., and Roser, M. (2020). CO2 and Greenhouse Gas Emissions. Available at: https://ourworldindata.org/co2-and-other-greenhouse-gas-emissions (Accessed May 10, 2020).
Solar Choice (2020). Solar Power System Prices. Available at: https://www.solarchoice.net.au/blog/solar-power-system-prices (Accessed March 17, 2020).
Solargis (2020). Photovoltaic Electricity Potential Switzerland. Available at: https://solargis.com/maps-and-gis-data/download/switzerland (Accessed March 17, 2020).
SWI (2020). SUPSI: Älteste netzgekoppelte PV-Anlage der Schweiz und Europas. Available at: https://www.ee-news.ch/de/article/24099/supsi-aelteste-netzgekoppelte-pv-anlage-der-schweiz-und-europashttps://www.swissinfo.ch/ger/lebensdauer-von-solarmodulen_nach-35-betriebsjahren-in-bester-verfassung/45146328 (Accessed March 17, 2020).
Tröndle, T., Pfenninger, S., and Lilliestam, J. (2019). Home-made or Imported: On the Possibility for Renewable Electricity Autarky on All Scales in Europe. Energ. Strategy Rev. 26, 100388. doi:10.1016/j.esr.2019.100388
Vogel, B. (2017). CO2 – der Rohstoff, der aus der Luft kommt. Im Auftrag des Bundesamts für Energie (BFE) Stand: given values are estimations from Climeworks for the future, the energy consumption of current systems are 4 - 8 times higher. Available at: https://www.researchgate.net/publication/319617808_CO2_-_der_Rohstoff_der_aus_der_Luft_kommt (Accessed March 20, 2020).
Winter, C. J. (1993). Die Energie der Zukunft heißt Sonnenenergie. Munchen, Germany: Droemer Knaur. ISBN-13: 978-3426265932.
Winter, C. J., and Nitsch, J. (1989). Wasserstoff als Energieträger. Heidelberg: Springer Verlag Berlin. ISBN 978-3-642-61538-2.
Worldometer (2020). Switzerland Population. Available at: https://www.worldometers.info/world-population/switzerland-population/(Accessed March 17, 2020).
Keywords: renewable energy, photovoltaic, batteries, hydrogen, synthetic hydrocarbons, energy economy
Citation: Züttel A, Gallandat N, Dyson PJ, Schlapbach L, Gilgen PW and Orimo S-I (2022) Future Swiss Energy Economy: The Challenge of Storing Renewable Energy. Front. Energy Res. 9:785908. doi: 10.3389/fenrg.2021.785908
Received: 29 September 2021; Accepted: 17 November 2021;
Published: 01 February 2022.
Edited by:
Carlo Roselli, University of Sannio, ItalyReviewed by:
Francesco Liberato Cappiello, Second University of Naples, ItalyGiovanni Ciampi, Università degli Studi della Campania Luigi Vanvitelli, Italy
Copyright © 2022 Züttel, Gallandat, Dyson, Schlapbach, Gilgen and Orimo. This is an open-access article distributed under the terms of the Creative Commons Attribution License (CC BY). The use, distribution or reproduction in other forums is permitted, provided the original author(s) and the copyright owner(s) are credited and that the original publication in this journal is cited, in accordance with accepted academic practice. No use, distribution or reproduction is permitted which does not comply with these terms.
*Correspondence: Andreas Züttel, YW5kcmVhcy56dWV0dGVsQGVwZmwuY2g=