 A. Poluzzi1
 G. Guandalini1
 S. Guffanti1
 M. Martinelli1
 S. Moioli2
 P. Huttenhuis3G. Rexwinkel3J. Palonen4
 E. Martelli1
 G. Groppi1
 M. C. Romano1*
- 1Dipartimento di Energia, Politecnico di Milano, Milano, Italy
- 2Dipartimento di Chimica, Materiali e Ingegneria Chimica “Giulio Natta”, Politecnico di Milano, Milano, Italy
- 3Frames Renewable Energy Solutions BV, Alphen Aan Den Rijn, Netherlands
- 4Sumitomo SHI FW Energia Oy, Espoo, Finland
The competitiveness of biofuels may be increased by integrating biomass gasification plants with electrolysis units, which generate hydrogen to be combined with carbon-rich syngas. This option allows increasing the yield of the final product by retaining a higher amount of biogenic carbon and improving the resilience of the energy sector by favoring electric grid services and sector coupling. This article illustrates a techno-economic comparative analysis of three flexible power and biomass to methanol plants based on different gasification technologies: direct gasification, indirect gasification, and sorption-enhanced gasification. The design and operational criteria of each plant are conceived to operate both without green hydrogen addition (baseline mode) and with hydrogen addition (enhanced mode), following an intermittent use of the electrolysis system, which is turned on when the electricity price allows an economically viable hydrogen production. The methanol production plants include a gasification section, syngas cleaning, conditioning and compression section, methanol synthesis and purification, and heat recovery steam cycle to be flexibly operated. Due to the high oxygen demand in the gasifier, the direct gasification-based plant obtains a great advantage to be operated between a minimum load to satisfy the oxygen demand at high electricity prices and a maximum load to maximize methanol production at low electricity prices. This allows avoiding large oxygen storages with significant benefits for Capex and safety issues. The analysis reports specific fixed-capital investments between 1823 and 2048 €/kW of methanol output in the enhanced operation and LCOFs between 29.7 and 31.7 €/GJLHV. Economic advantages may be derived from a decrease in the electrolysis capital investment, especially for the direct gasification-based plants, which employ the greatest sized electrolyzer. Methanol breakeven selling prices range between 545 and 582 €/t with the 2019 reference Denmark electricity price curve and between 484 and 535 €/t with an assumed modified electricity price curve of a future energy mix with increased penetration of intermittent renewables.
1 Introduction
Within a carbon-constrained economy that aims to substantially reduce CO2 emissions, biogenic carbon is bound to be a scarce resource with high economic value. Consequently, it is of paramount importance to make the best use of carbon in biomass according to economic, societal, and sustainability criteria. In this framework, power and biomass-to-X (PBtX) plants aim to optimize the utilization of the biogenic carbon by integrating with water electrolysis to produce increased amounts of generic products “X,” which may include fuels and chemicals.
Poluzzi et al. (2021) reviewed the most significant scientific papers on techno-economic analysis of PBtX plants within the scientific literature. This kind of plants enhances the production of bioproducts by converting the excess biogenic carbon contained in the feedstock through the addition of hydrogen from water electrolysis rather than venting it as CO2. The consequent benefit is a much higher carbon efficiency achievable through hydrogen addition. Several scientific articles (Hannula, 2015; Hannula, 2016; Albrecht et al., 2017; Hillestad et al., 2018; Zhang et al., 2020) proved that PBtX plants achieve carbon efficiencies ranging from 50% to over 90% compared to 25–40% of the corresponding biomass-to-X options. Literature studies showed that power-to-fuel conversion efficiency is mildly dependent on the final product (e.g., methanol, synthetic natural gas, Fischer-Tropsch liquids), unless additional energy losses are introduced downstream of the primary synthesis process, such as the case of methanol-to-gasoline conversion (Hannula, 2015; Hannula, 2016). Overall, hydrogen-to-fuel efficiencies reported in the literature vary within the range of 82–85% (Hannula, 2015; Hannula, 2016; Albrecht et al., 2017; Hillestad et al., 2018), and it is about 10% points lower when gasoline is produced from methanol. On the contrary, power-to-fuel efficiency depends on the electrolysis technology, increasing from 50-58% in case of low-temperature electrolysis systems (Hannula, 2015; Hannula, 2016; Albrecht et al., 2017) to close to 80% with high-temperature solid oxide electrolysis cells (SOEC) (Hillestad et al., 2018; Zhang et al., 2020).
The economic viability of this kind of plants is significantly affected by the cost of hydrogen. The hydrogen production cost is closely related to the capital cost of the electrolysis system, the capacity factor of the electrolyzer, and the average price of the consumed electricity. Hannula (2015) showed that high electrolyzer capacity factors are necessary to have economically viable hydrogen production in a PBtX plant, unless unrealistic long periods of negative electricity price are assumed. Similarly, Zhang et al. (2020) explored the effect of the electrolysis capacity factor on the final product cost. Therefore, PBtX systems cannot be economically competitive if relying only on excess electricity from intermittent renewable energy sources. This is witnessed by the fact that all the reported economic analyses are performed by assuming capacity factors ranging from 82 to 94%, and the same capacity factor is adopted for the electrolysis system and the biomass gasification and fuel synthesis processes.
PBtX plants may benefit from being operated in a flexible way by modifying the electric power consumption and, therefore, the amount of hydrogen injected into the system. Accordingly, the system can be operated in the most profitable way by injecting hydrogen in periods of relatively low electricity prices and by cutting the hydrogen production and injection when it is uneconomical. However, none of the aforementioned scientific works on PBtX systems investigate the design of the process units and components conceived to operate flexibly. Moreover, the economic performance of this kind of systems is assessed by fixing the electricity price and assuming a continuous operation of the electrolysis unit. The influence of a variable electricity price on the system operation is not satisfactorily analyzed in the scientific literature.
Poluzzi et al. (2022) addressed this issue and assessed the design and operating criteria of flexible power and biomass-to-methanol (PBtM) plants subject to variable electricity prices. They proposed two design criteria for the methanol synthesis reactor: enhanced reactor design (i.e., larger reactor designed on the feed flow rate when hydrogen is added to the system) and baseline reactor design (i.e., smaller reactor designed on the feed flow rate without hydrogen addition). The main conclusions of the work are that 1) high capacity factors of the electrolysis system are necessary in order to provide cost-competitive e-methanol to the market and to amortize the high capital cost of the electrolysis unit, 2) the enhanced reactor design has to be preferred over the baseline reactor design because of the higher relative cost of hydrogen from electrolysis compared to the capital cost of oversizing the methanol synthesis unit, 3) the attractiveness of operating this kind of plants in a flexible way may increase significantly in future scenarios with very high penetration of intermittent renewables, leading to low average electricity prices, but also periods of very high peak prices.
Following the aforementioned scientific article, this work further analyzes PBtM plants to be operated flexibly depending on the electricity price. The main novelties compared to the scientific literature are the following:
• A comparative techno-economic analysis of PBtM plants based on three different gasification technologies (direct, indirect, and sorption-enhanced gasification) is carried out;
• The design and operational criteria of the plants conceived to operate flexibly in baseline (i.e., without hydrogen addition) and enhanced operation (i.e., with hydrogen addition) are assessed, comparing the characteristics of the different gasification technologies;
• The economic competitivity of flexibly operated plants when integrated with the electricity market is discussed, compared to inflexible plants conceived to operate with constant hydrogen input.
2 Bio-Methanol Plants Description
Figures 1–3 show the block diagrams of the PBtM plants assessed in this paper, based on O2-blown direct gasification (DG), indirect gasification (IG), and sorption-enhanced gasification (SEG). The properties of the main streams indicated in the figures are reported in Supplementary Material (Tables A1–A6).
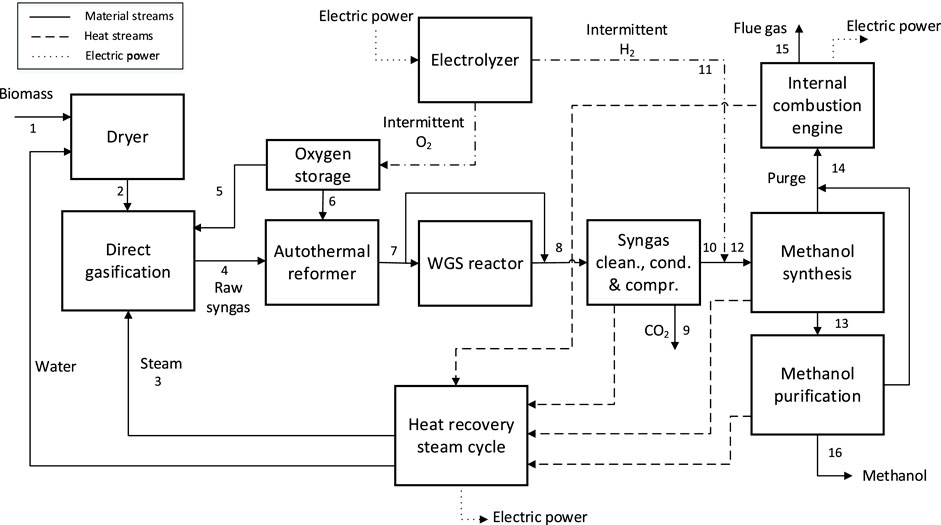
FIGURE 1. Block diagram of the DG-based power and biomass-to-methanol plant.
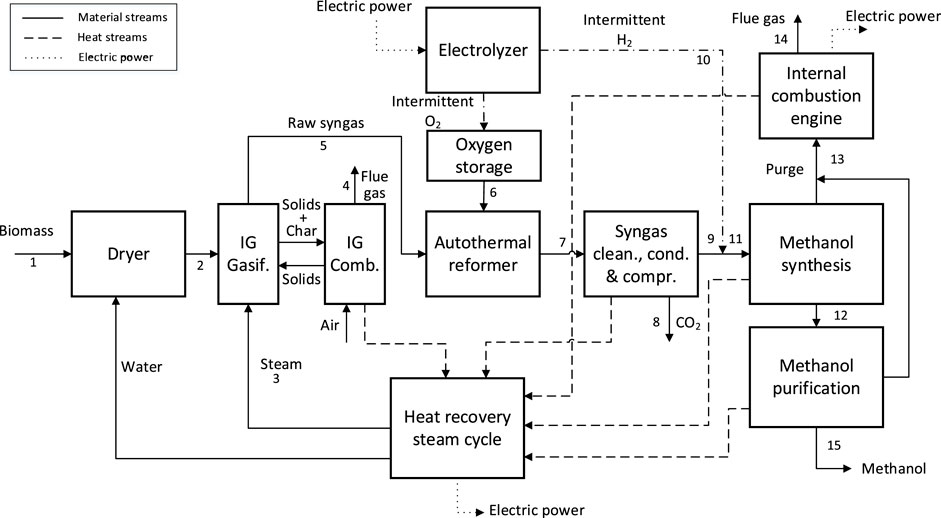
FIGURE 2. Block diagram of the IG-based power and biomass-to-methanol plant.
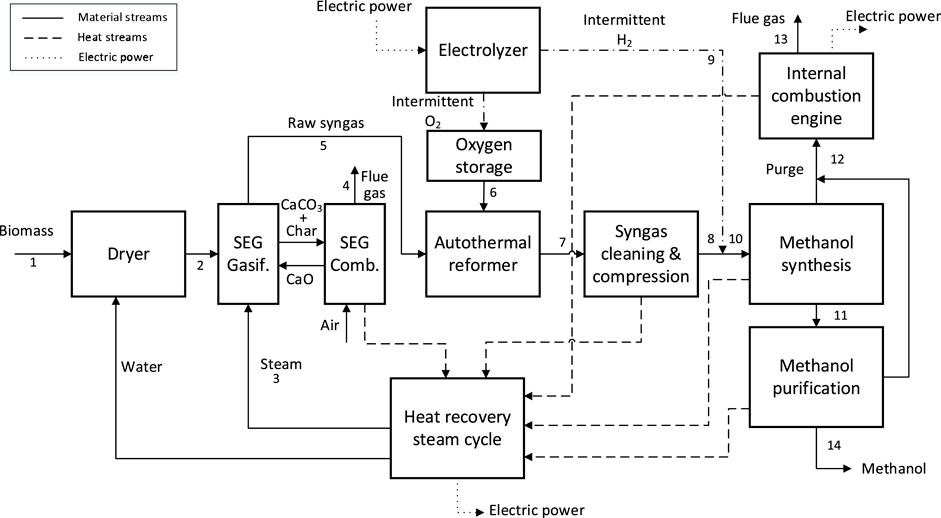
FIGURE 3. Block diagram of the SEG-based power and biomass-to-methanol plant.
All the plant configurations combine the same fundamental conversion steps: biomass drying, gasification, syngas purification, conditioning and compression, and methanol synthesis and purification. Furthermore, intermittent hydrogen from electrolysis is added to the system.
As-received woody biomass (stream 1) is fed to a belt dryer to reduce the moisture content from 45 to 15%, and the dried biomass (stream 2) is sent to the gasification island. In the direct gasification-based plant (Figure 1), the gasification process is thermally sustained through the partial oxidation of biomass by means of oxygen from the electrolysis unit. Most inlet carbon remains in the nitrogen-free syngas as CO, CO2, and CH4, while a minor part is extracted from the fluidized bed as unconverted char. In the indirect gasification-based plants (Figure 2), a solid heat carrier material (i.e., olivine) circulates between a higher temperature combustor and a lower temperature gasifier to provide the heat required for biomass gasification. The heat is generated from the combustion with the air of the unconverted char, which flows from the gasifier to the combustor, and of additional biomass. In the sorption-enhanced gasification-based plants (Figure 3), CaO-rich solids are used as bed material and circulate between the gasifier and the combustor. In addition to behaving as a heat carrier as in the IG process, the circulating solids absorb CO2 through the carbonation reaction (
The aforementioned gasification processes produce a nitrogen-free syngas, which contains a significant amount of tar and methane. A catalytic auto-thermal reformer (ATR) unit is included downstream of the gasifier and a high-temperature filtration unit, to convert methane and tar into useful reactants for the synthesis (i.e., CO and H2). Oxygen is fed to the ATR to reach an exit temperature of 800°C for IG- and SEG-based plants and 915°C for the DG-based plant. An oxygen storage system is foreseen in order to store the intermittent oxygen production from the electrolyzer. Methane conversion through the ATR is assumed to be 90%.
The reformed syngas must be further conditioned, purified, and compressed to be fed to the downstream methanol synthesis. For the direct gasification-based plant, the target syngas module may be obtained by means of an adiabatic sour water-gas shift (WGS) reactor, followed by a CO2 removal unit based on MDEA scrubbing operated at 30 bar. In the indirect gasification-based plant, the target module may be achieved with only CO2 removal by MDEA scrubbing. As already mentioned, the sorption-enhanced gasification-based plant does not need either a WGS reactor or a CO2 removal unit because the syngas module may be tuned within the gasifier.
The syngas cleaning includes the removal of undesirable compounds, such as sulfur, chlorine, and alkali, which would poison the downstream catalytic reactor. To this end, a water scrubber, H2S absorption by liquid Redox LO-CAT process (Echt et al., 2017), and adsorption with activated carbon are included in the plant. The syngas must reach the synthesis pressure of 90 bar. This is accomplished with one intercooled compressor in case of the SEG-based plant and with two intercooled compressors in case of the DG- and IG-based plants. The first compressor allows reaching 30 bar, which is necessary for amine scrubbing.
When hydrogen from electrolysis is available, it is mixed with syngas and then compressed to 90 bar in the DG- and IG-based plant. In the SEG-based plant, the injected hydrogen is compressed from 30 to 90 bar with a dedicated compressor and then mixed with the syngas. In all cases, hydrogen is added in the correct amount to obtain a syngas with the proper module of 2.05 upstream of the methanol synthesis section.
A conventional methanol synthesis technology is adopted, based on a boiling water reactor (BWR) where the syngas flows through tubes filled with catalyst and surrounded by boiling water at 238°C. Because the per pass methanol yield is limited by thermodynamic equilibrium, most unconverted reactants are recycled back to the reactor. The crude methanol is cooled down to 40°C, separated from the light gases in a flash unit and then throttled to about 2 bar before purification. The purification section includes distillation columns aimed at stripping off the light gases from the crude methanol and separating water from methanol to reach the target purity of 99.85% wt.
The purge from the methanol synthesis and purification units contains many light gases, whose heating value is exploited in a cogenerative internal combustion engine for electricity and steam production. A steam cycle is included in the plant to recover the heat from the different sections and produce electricity and steam for internal consumption.
The plant unit operations are designed to manage the intermittent addition of hydrogen as the electrolyzer is turned on only when the electricity price allows an economically viable hydrogen production. Therefore, two main operating points are assessed: 1) baseline operation (i.e., without hydrogen addition) and 2) enhanced operation (i.e., with hydrogen addition).
The process model is developed in Aspen Plus®, which allows computing the mass and energy balances of the integrated plant. The computations are conducted for a biomass input of 100 MWLHV. The proximate and the ultimate analyses of the as-received biomass are assumed from the literature (Pröll and Hofbauer, 2008b) and are reported in the Supplementary Material, Table A7.
For the thermodynamic properties, different models are considered for the different plant sections. The general model is the RKS-BM complemented with the SRK model in the methanol synthesis section, the NRTL model in the methanol purification section, and the ELECNRTL model in the water scrubber.
A description of the plant units and the methods for the simulation is given in the following sections. An extensive table with the main calculation assumptions is reported in the Supplementary Material, Table A7).
2.1 Biomass Pre-Treatment
The biomass pre-treatment is the same for all the plant configurations. Biomass pre-treatment includes a belt drier (Amos, 1998; Fagernäs et al., 2010). Heated air flows through the biomass bed, providing the heat for water evaporation. Hot water is used to heat the drying air by means of a heat exchanger. Air is blown through a thin static layer of material on a horizontally moving permeable belt.
The dryer is designed to provide biomass with a moisture content of 15% wt. The low-temperature belt dryer described by STELA drying technology (2019) is adopted in the process model. A hot water loop with temperatures ranging between 90 and 30°C provides the necessary thermal power for the dryer, with a specific heat demand of 1 MWh/tH2O evaporated, resulting in a duty of about 13 MWth. The power consumption is set to 32 kWh/t of dry feedstock (Hannula, 2016).
2.2 Gasification Technologies
The direct gasifier is a pressurized circulating fluidized bed (CFB) fed with a mixture of steam and oxygen. The amount of steam fed to the CFB as gasifying agent is determined to achieve the target steam-to-carbon (S/C) ratio of 1 at the reformer inlet. The oxygen input is provided as a by-product of the water electrolysis. The gasifier heat and mass balances are calculated with a lumped parameter model. Gasification process parameters and assumptions needed to define the syngas composition at the gasifier outlet (i.e., the advancement of the WGS reaction in the gasifier, the content of CH4 and higher hydrocarbons, and the char conversion) are calibrated to reproduce the syngas composition from the Varkaus plant (Palonen, 2012). The gasifier operates at 870°C and 4 bar. The higher operating temperature with respect to IG and SEG guarantees a higher carbon conversion and a lower amount of methane in the outlet syngas compared to IG and SEG solutions.
The indirect gasifier is a dual fluidized bed, constituted by a bubbling fluidized bed (BFB) gasifier and a circulating fluidized bed (CFB) combustor. Steam addition to the BFB as gasifying agent is determined to achieve the target S/C ratio of 1 at the reformer inlet. Steam is fed to the gasifier at 400°C. Similar to the DG, the IG is calculated with a lumped parameter approach, and the gasification process parameters needed to define the syngas composition at the gasifier outlet are calibrated to reproduce the syngas composition from the GoBiGas plant (Thunman et al., 2018). The gasifier operates at 815°C and 1.4 bar.
Similar to the IG, the sorption-enhanced gasifier is a dual fluidized bed, constituted by a BFB gasifier/carbonator and a CFB combustor/calciner. Low-pressure steam is fed to the BFB reactor as a gasifying agent to reach the target S/C of 1.5. The gasifier is modeled with a 0D model, which was extensively described by Poluzzi et al. (2022).
Most assumptions hold for the IG and the SEG options because they are both dual fluidized bed systems. The recirculated solids are fed to the combustor, which performs the complete combustion of the unconverted char and the additional biomass needed to achieve the target combustor temperature of 910°C. In the combustor, the solids are assumed to be entrained by the gas with a certain solid mass flow per cross section unit (GS) at raiser outlet by following the approach of Löffler et al. (2003). The solids are separated by the outlet cyclone with a given efficiency specified to be 99.9% for calcium/olivine and 99% for ashes in order to take account of the different particle size distribution. The separated solids are partly sent to the gasifier and partly recirculated to the CFB combustor riser. A minimum solid purge from the bottom bed is required to avoid alkali and ashes collection in the reactor. Therefore, a mass flow rate equal to 1% of the inlet biomass is removed from the combustor. A makeup of limestone/olivine is added to the combustor to compensate for the solids lost in the purge and from the cyclones. Combustion air is preheated by flue gases up to 270°C in design operation. The air flow rate is adjusted to obtain 3%mol of oxygen concentration in the flue gases. The connection between dual-fluidized bed system requires equal pressures in the two beds. As the gasifier is operated above the atmospheric pressure to keep the whole syngas cooling and cleaning line at positive pressure, the combustor is also kept at pressure (∼1.4 bar) through a backpressure valve before the stack.
In all the configurations, additional steam and air are also consumed with sealing purposes in biomass feeder, solid purge, and filter cleaning. The content of other species in the syngas is estimated by assuming that all the sulfur in biomass is converted to H2S, all chlorine to HCl, and 10% of the nitrogen to NH3.
The operating conditions are displayed in Table 1, and the comparison of the simulated syngas composition with literature data for DG and IG is reported in Supplementary Material, Table A8).
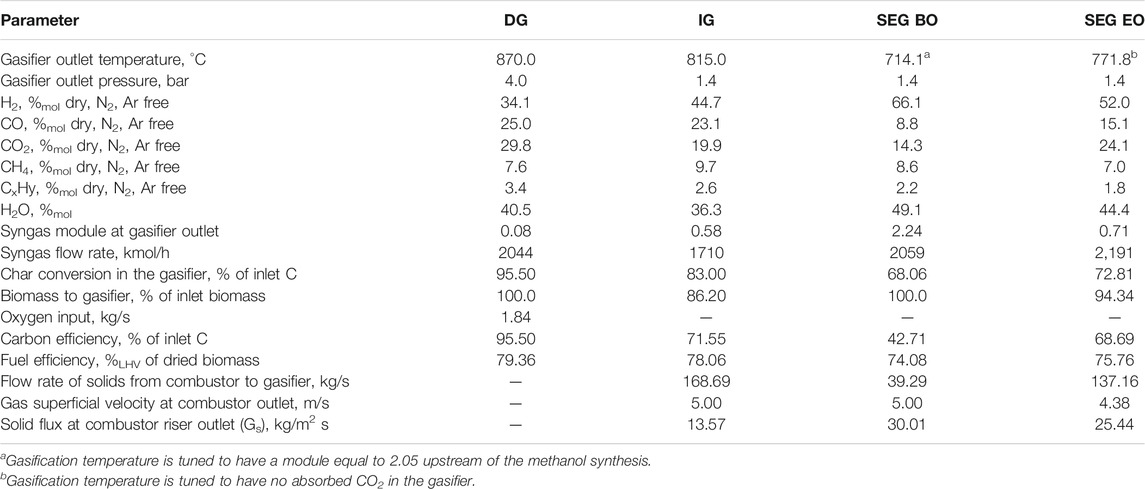
TABLE 1. Gasifiers operating conditions and exit gas composition.
The flexible operation of the sorption-enhanced gasification unit entails the production of syngas with a module close to 2 in the baseline operation and lower than 1 in the enhanced operation. Following the approach modeled and tested in the scientific literature (Pröll and Hofbauer, 2008a; Koppatz et al., 2009; Armbrust et al., 2014; Poboß, 2016; Schmid et al., 2017; Fuchs et al., 2020; Hafner and Schmid, 2020; Hafner et al., 2021; Pitkäoja et al., 2021), the module is controlled by increasing the sorbent circulation rate, which causes an increase in the gasification temperature from 714°C in baseline operation to 772°C in the enhanced operation. The latter condition leads to zero CO2 absorption in the gasifier due to thermodynamic limitation. Accordingly, the syngas retains the maximum amount of carbon (i.e., all the carbon except for the unconverted char in the gasifier), which determines the maximum amount of hydrogen addition. Therefore, in the enhanced operation, the circulating CaO has the only function of heat carrier in the indirect gasification loop.
The DG and the IG options produce a syngas with the same characteristics in both operating conditions. The control criteria for the plant operation with intermittent hydrogen addition are applied in the conditioning section, as discussed in the following paragraph.
2.3 Syngas Purification, Conditioning, and Compression
Downstream of the gasification unit, the raw syngas undergoes a high-temperature filtration before the raw gas reformer. The reforming unit is an ATR fed with oxygen produced as a by-product from water electrolysis, using catalysts designed to operate on raw syngas (Kurkela et al., 2021). A restricted equilibrium calculation approach has been adopted for the ATR, assuming 90% methane conversion and complete conversion of higher hydrocarbons. The assumed methane conversion is slightly higher than the conversion achieved in VTT lab-scale pilot plant (Kurkela et al., 2016). Oxygen storage is associated with the reforming unit to store the intermittent oxygen production from the electrolysis and provide a stable flow to the ATR. The minimum capacity factor of the electrolyzer required to produce the needed oxygen without external import or back-up ASU is 15.1, 18.6, and 41% for IG-, SEG-, and DG-based plants, respectively. Assuming 3 h of back-up time, an oxygen storage size of about 130, 149, and 670 m3 is needed for storing gaseous oxygen at around 30 bar and ambient temperature in IG-, SEG-, and DG-based plants, respectively. The higher minimum plant capacity factor and volume storage for the DG-based plant are related to the need for providing oxygen not only to the ATR but also to the gasifier unit. Due to the high volume of the storage, which implies significant capital costs and safety-related aspects, a DG configuration without the storage is added to the discussion in Section 4.1. Information about the operating conditions of the ATR for all the configurations is reported in Table 2. The higher oxygen demand for heating up the raw syngas to the reforming temperature is mainly related to the gasifier exit temperature and the reforming temperature.
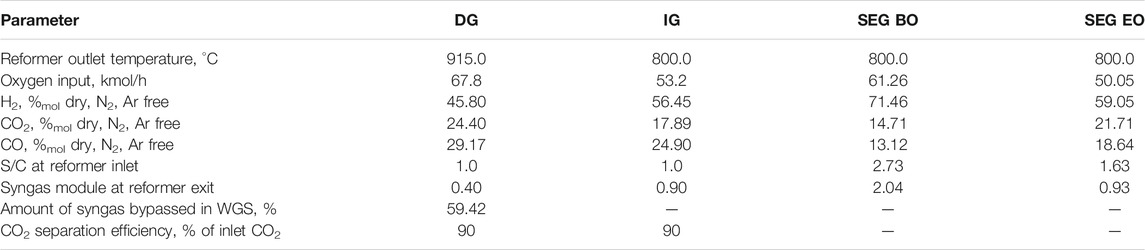
TABLE 2. Autothermal reformer operating conditions and exit gas composition. Syngas conditioning operating conditions.
Downstream of the ATR of the DG-based plant, the syngas is cooled to 300°C and fed to the sour WGS reactor, which allows adjusting the syngas composition prior to the CO2 removal step. In baseline operation, about 40.6% of the syngas is fed to the WGS reactor, and the rest is bypassed. In the enhanced operation, the WGS reactor is entirely bypassed and no shift occurs. In IG- and SEG-based plants, this reactor is not present.
In all the configurations, the syngas is cooled down to 220°C and scrubbed with water. The scrubber inlet temperature is chosen to avoid the condensation of residual tars (Hannula and Kurkela, 2013). Ammonia and chlorine contained in the gas are removed in the scrubber.
Bulk sulfur removal is performed through a liquid Redox unit (LO-CAT process), where H2S is converted into elemental sulfur and water by reaction with an iron oxygen carrier. The system is simulated as a black box, with data from Kazemi et al. (2014).
After bulk cleaning, in DG- and IG-based plants, the syngas undergoes compression to 30 bar through a four-stage and a six-stage intercooled compressor, respectively. In the SEG-based plant, the syngas is compressed in a seven-stage intercooled compressor, with an outlet pressure of about 90 bar. In all the configurations, the intercoolers outlet temperature is 40°C and the pressure ratio per stage βstage is about 1.8, leading to a gas temperature at the outlet of each compression stage below 125°C. In SEG-based plants, the volumetric flow rate at the syngas compressor inlet increases by 11.7% in the enhanced operation compared to the baseline. This variation can be managed by the compressor control system, and it is assumed not to affect the compression efficiency. In DG- and IG-based plants, a CO2 removal unit based on MDEA allows removing 90% of the CO2 contained in the syngas in the baseline operation. The unit is bypassed in the enhanced operation to retain all the carbon in the syngas. The SEG configuration does not need such a unit because the syngas composition is tuned within the gasifier.
In DG- and IG-based plants, a second intercooled compressor with two stages allows increasing the pressure to about 90 bar.
Activated carbon bed and sulfur scavenging units, which are used to remove trace contaminants that may poison the catalyst, are placed upstream of the last compression stage at a pressure of about 50 bar.
The H2 enrichment step in the enhanced operation mode is realized just upstream of the second intercooled compressor for DG- and IG-based plants, with hydrogen available at 30 bar. For the SEG configuration, the H2 addition is realized just upstream of the methanol synthesis section. Therefore, the hydrogen stream at 30 bar is further compressed to about 90 bar by a two-stage intercooled compressor without an aftercooler before mixing with the syngas stream. The water electrolysis unit is designed to provide the maximum hydrogen enrichment to retain all the carbon in the syngas. This results in a 129, 67.5, and 63.3 MWel electrolyzer for DG-, IG-, and SEG-based plants, respectively.
As already mentioned, in the DG configuration, the syngas module is controlled by controlling the amount of syngas, which bypasses the WGS reactor in the baseline operation, and by bypassing the WGS reactor and the CO2 removal unit in the enhanced operation. In the IG-based plant, the CO2 removal unit is bypassed in the enhanced operation. In the SEG configuration, the syngas module is tuned within the gasifier depending on the hydrogen availability by modifying the circulation rate of the solids.
2.4 Methanol Synthesis
Downstream of the syngas purification, conditioning, and compression steps, the fresh syngas is fed to the methanol synthesis island. The syngas specifications for the three plant configurations in both the operating modes are shown in Table 3. Regarding the DG- and IG-based plants, the composition of the fresh syngas shows a major variation between the baseline and enhanced operating mode. This is a consequence of the different conditioning units that the syngas has to undergo depending on the operating mode. The difference between baseline and enhanced operation is also reflected in the CO/CO2 ratio, which shows a substantial reduction in the enhanced operation. Unlike the aforementioned cases, the SEG-based plant features a fresh syngas composition with a limited variation between the baseline and the enhanced operating modes. This also applies to the CO/CO2 ratio, and it largely results from the chemical equilibrium of the WGS reaction at the ATR outlet. The largest difference between the baseline and enhanced operation cases lies in the flow rate, which is about 60% higher in the enhanced operation compared to the baseline. When it comes to the DG- and IG-based plants, the difference between the operation points is accompanied by a difference in the flow rate, which is about 135% higher in DG-EO (on a molar basis) compared to DG-BO and about 75% higher in IG-EO compared to IG-BO.
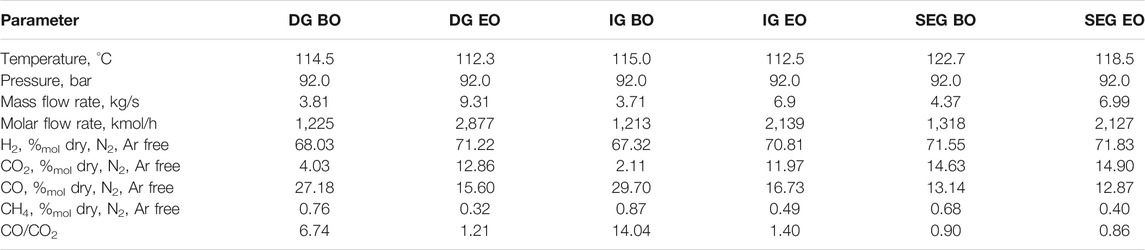
TABLE 3. Syngas specifications upstream of the methanol synthesis island in baseline and enhanced operating conditions.
The fresh syngas is first mixed with the unconverted recycled gas and then preheated in a feed/effluent heat exchanger upstream of the methanol synthesis reactor. The temperature of the inlet syngas to the methanol synthesis reactor is set according to the heat exchanger specifications. The outlet crude methanol is cooled down until the dew point temperature of the mixture is reached. The crude methanol is further cooled down to 40°C and separated in a flash unit from the light gases recycled back to the reactor.
The methanol synthesis process is performed in a multitubular fixed bed reactor filled with commercial Cu/ZnO/Al2O3 catalyst (CZA) pellets and externally cooled by boiling water. The reactor is analyzed using a 2D heterogeneous single tube model coupled with a 1D description of the catalyst pellet, implemented in gPROMS® 5.0.2 software for the numerical solution. The model consists in 2D gas-phase i-species mass balances, 2D gas and solid phase energy balances, 1D momentum balance, and 1D i-species mass balances of isothermal CZA cylindrical pellets accounting for the intraparticle diffusion phenomena that lower the catalyst effectiveness factor. The kinetic model proposed by Vanden Bussche and Froment (1996) is used in the analysis. The diffusivity and transport correlations are taken from literature while the gas mixture physical properties are calculated using the gPROMS® utility Multiflash. The model is described extensively by Montebelli et al. (2013). The discretization methods used for the numerical solution of the model equations are the first-order backward finite-difference method (BFDM) for the reactor tube axial coordinate and the third-order orthogonal collocation on finite elements method (OCFEM) for the tube radial and the pellet coordinates. In the simulations, a non-uniform grid of 60 axial points is adopted, obtained by a logarithm transformation implemented in gPROMS® with a transformation parameter α = 15, while three and four collocation elements are used, respectively, for the radial coordinate and the catalyst pellet coordinate.
The flexibility requirement also affects the methanol synthesis reactor, which is designed by considering the two different operating points. All the plant configurations have some fixed design criteria, among which are the tube length and diameter (i.e., 6 m and 0.04 m, respectively), the reactor pressure, and the temperature of the boiling water (i.e., 90 bar and 238°C, respectively). The number of tubes inside the reactor for each configuration depends on the selected gas hourly space velocity (GHSV), referred to as the volume of the reactor tubes.
All the plant options are designed with a GHSV of 5,000 h−1 in the enhanced operation with a recycle ratio (RR, defined as the molar flow rate of the recycle stream divided by the molar flow rate of the fresh syngas) of five. As extensively discussed by Poluzzi et al. (2022), it is economically preferable to size the methanol reactor on the enhanced operation condition rather than on the baseline operation. The control criteria applied in the baseline operation mode depend on the composition and especially the CO/CO2 ratio of the fresh syngas. Regarding the SEG-based plant, which has the lowest CO/CO2 ratio and, therefore, potentially the poorest performance in terms of methanol yield, the recycled molar flow rate is kept constant, fixed by the blower design, which involves an increase in RR in baseline operation. In the DG- and the IG-based plants, the recycled molar flow rate is controlled to reach 99% of the overall methanol yield. For both configurations, the recycled molar flow rate, which guarantees 99% yield, is lower than the molar flow rate in the design EO condition.
The performance of the methanol synthesis unit is evaluated considering the methanol carbon yield defined in Eq. 1 and methanol productivity, in which the methanol species mass flow rate downstream of the flash unit is considered. The temperature profiles are also analyzed to verify that the threshold limit of 300°C is not exceeded, in order to prevent the catalyst deactivation by Cu cluster sintering (Twigg and Spencer, 2001).
The methanol synthesis performance of the SEG-based plant is extensively described by Poluzzi et al. (2022). Therefore, the description below mainly focuses on the DG- and IG-based plants. The performance and operating conditions of the methanol synthesis are displayed in Table 4.
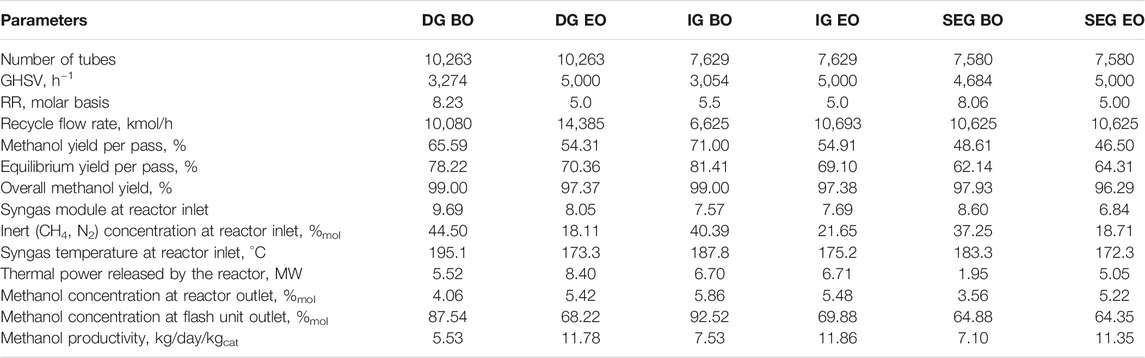
TABLE 4. Performance of methanol synthesis.
The equilibrium yield per pass is higher in the DG and IG BO cases due to the larger CO/CO2 ratio at the reactor inlet that thermodynamically favors the carbon conversion. The higher molar fraction of CO2 in the EO cases also results in a larger water production that hinders the methanol synthesis kinetics (Vanden Bussche and Froment, 1996). Indeed, although the equilibrium yield per pass is not reached for any condition analyzed, its approach is faster in the two BO cases. Moreover, the equilibrium approach in BO is pushed by the lower GHSV.
The methanol yield and equilibrium yield per pass of the two DG EO and IG EO cases are almost equal due to similar operating conditions. Instead, the difference in the methanol yield of DG BO and IG BO is more significant (65.6 vs. 71%) due to the different GHSV (3,274 h−1 vs. 3,054 h−1) and the different CO/CO2 ratio that affects the thermodynamic equilibrium. The equilibrium yield in DG BO is indeed ∼3% lower with respect to BO IG due to the larger content of CO2 in the feed. The productivity is far larger in the EO due to the larger feed streams used. The methanol productivity obtained with DG BO is the lowest, less than half of the EO cases. The worth of notice is also a large amount of inert recycled in the loop BO, which is more than 40%, due to the large recycle ratios. Compared to the DG and IG cases, SEG shows lower methanol yield per pass due to the lower CO/CO2 ratio (lower than 1 in the SEG case) while the productivity is still directly related to the flow rate streams.
The centerline catalyst temperature axial profiles are reported in Figure 4. In the inlet zone of the reactor, the temperature increases passing through a maximum due to the heat released by the exothermic reaction involved in the methanol synthesis process. Then, the temperature decreases to the coolant level (238°C) due to the progressive approach to the equilibrium, which lowers the reaction rates. The SEG cases have mild temperature profiles due to the large GHSV (4,684 h−1 and 5,000 h−1) and a low CO/CO2 ratio. The SEG BO shows the lowest hot spot due to the high inert concentration (37.25%). The catalyst temperature profiles are almost overlapped in the DG and IG EO cases due to the similar operating conditions, inlet composition, and GHSV. The hot spot is also less pronounced with respect to the BO cases because of the larger GHSV (5,000 h−1) that improves the heat exchange by convection. The highest temperature hot spot is reached with the IG BO operated with the lowest GHSV (3,054 h−1) and highest CO/CO2 ratio. Nevertheless, the maximum temperature is moderate and never exceeds 260°C that is far less than the temperature limit of 300°C (Twigg and Spencer, 2001), meaning that the reactor design is appropriate for heat management for any analyzed condition.
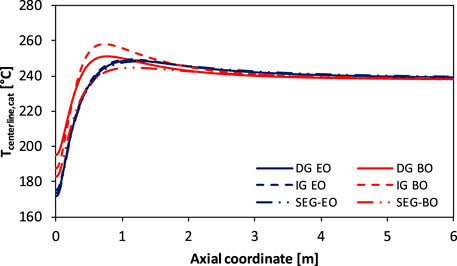
FIGURE 4. Catalyst centerline temperature axial profiles.
2.5 Methanol Purification
The purification section is performed with a rate-based approach to consider the mass transfer occurring on each tray. The employed thermodynamic method is based on the non-random two-liquid (NRTL) model (Renon and Prausnitz, 1968).
The raw product, rich in methanol and water and with the presence of other species (low boiling components and ethanol), enters the purification section at 2 bar and 41–42°C (depending on the case).
Regarding the SEG-based plant, the design and control criteria for the purification section have been extensively described by Poluzzi et al. (2022). In this case, the flow rate of methanol to be purified increases by 62% in the enhanced operation compared to the baseline operation, while the composition remains fairly constant (Table 5). On the contrary, both the flow rate and the composition of the remaining cases vary significantly between baseline and enhanced operation. In the DG case, a stream with a 2.7-time higher flow rate than the baseline case and with much lower methanol content than the baseline case (68.2 vs. 87.5%) is produced. In the case of IG, the flow rate in the enhanced operation doubles compared to the baseline operation, and the methanol mole fraction reduces to 69.9% from 92.5% of the baseline operation.
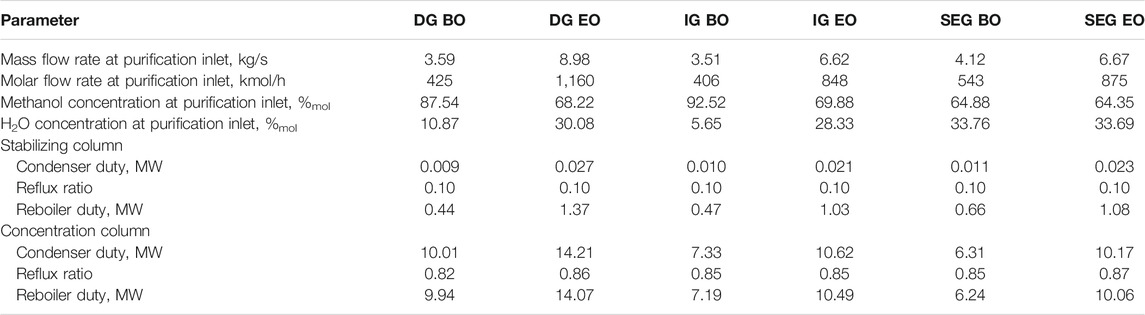
TABLE 5. Characteristics of the raw methanol streams fed to the purification section for the assessed cases. Methanol purification operating conditions.
The purification section has been designed considering that the units should be able to work in a flexible mode. The plant is composed of two distillation columns in series, the first one aimed at removing most of the incondensable gases and the second one aimed at concentrating the methanol up to the desired purity (99.85%wt.) for the product, with at least 99% of recovery (see Table 5).
Because of the characteristics of the streams to be treated, which all present a low and similar amount of low boiling impurities (the sum of mole fractions of methanol, ethanol, and water is for all the cases about 0.98), for the first column (the stabilizing column), the separation can be accomplished with 23 trays. The optimal diameter is 0.9, 0.75, and 0.66 m for the DG, IG, and SEG cases, respectively.
The second column (the concentration column) performs most of the operation to achieve the desired purity of the methanol product, and its performance is significantly influenced by the flow rate and the composition of the feed stream. In particular, for the stream produced in the DG configuration, the operation for separating methanol and water, with a mole fraction of about 70 and 30% for the enhanced operation, is more demanding than the one for separating the mixture composed of about 89% methanol and 11% water for the baseline operation, resulting in a higher reflux ratio. In addition, the much higher flow rate of the enhanced operation causes higher circulating flow rates inside the column, therefore requiring a too large column diameter for a well-performing operation in the baseline case. Similar considerations can also be done for the purification of the stream produced in the IG-based plant.
Based on these considerations and considering that a column able to treat both the streams in the enhanced operation and the baseline one in flexible mode is needed, a recycle of the product streams rich in methanol and water has been considered for the baseline operation. A stream fed to the concentration column with about 70% of the flow rate of the stream in the enhanced operation and a similar composition as for methanol and water is obtained. In this way, a column operating at atmospheric pressure at the top, with 48 trays and a diameter of 2.5 m in the DG-based plant and 2.1 m in the IG case, can perform the separation for both the enhanced operation case and the baseline one. The operating costs for the operation in the baseline case are increased because the concentration column needs to treat a higher flow rate with higher water content in the feed stream. However, on the overall economic analysis, this can be acceptable because the baseline operation is run a few times and discontinuously in a year. As already mentioned, in the SEG-based plant, the relatively small difference in the flow rate and the constant composition of the feed in the two operating modes allow managing separation without recycle of the product streams. In this case, the diameter of the concentration column results to be equal to 2 m.
2.6 Heat Recovery and Power Generation
The waste heat available between temperatures of 1,000°C and 30°C is approximately 82 MW in the enhanced operating mode and 60 MW in the baseline mode. A heat recovery steam cycle (HRSC) and optimized heat exchanger network (HEN) can be used to recover such a heat and convert it into steam for the process and electric power. Moreover, an internal combustion engine (ICE) exploits the off-gas of the methanol synthesis and purification units for electricity and hot water production.
The performance map of the ICE is evaluated in the same way as reported by Poluzzi et al. (2022) using linearized equations derived by Zatti et al. (2018).
Similar to Poluzzi et al. (2022), the design of the HRSC and heat exchanger network (HEN) is performed using the multiperiod synthesis methodology proposed by Elsido et al. (2020, 2021). Given the list of hot and cold streams (i.e., syngas coolers, intercoolers, methanol reactor, and the flue gases of the internal combustion engine) and the list of steam users (gasifier and MDEA regeneration) of each operating mode, the methodology finds the optimal HRSC and HEN design considering all the key technical design constraints, economics, and different operating modes.
The main technical constraints are set by the metal dusting metallurgical issue, which may occur on the tubes of the syngas coolers for a temperature higher than 340°C (Grabke, 1995). To avoid such damaging phenomena, a “forbidden match” constraint is included in the optimization problem to forbid matching syngas coolers and steam superheaters in the metal dusting temperature range.
The superstructure combines the SYNHEAT superstructure (Yee and Grossmann, 1990) for the HEN with the p-h steam cycle superstructure (Martelli et al., 2017) shown in Figure 5. It includes up to three pressure levels for both evaporation (120, 32, 6.5 bar) and condensation (6.5, 2, 0.05 bar) and the extraction of superheated steam at different pressures. It is worth noting that the configuration shown is the most general one, and the optimization procedure might lead to the selection of only a portion of it. Similar to Poluzzi et al. (2022), the pressure levels are set based on process requirements (e.g., methanol reactor operating temperature) and superheating limitations of medium-grade steel tubes (525°C). The reheating temperature is set to 480°C to allow the extraction of steam at the required 182°C at 2 bar. Because the gasifier requires the IG-based plant superheated steam at low pressure and high temperature (400°C), a very low-pressure reheater is included in the superstructure. In the DG configuration, steam extraction is required at 6.5 bar and 172°C. Therefore, an alternative de-superheater (DE-SH LP1 in Figure 5) is also included in the superstructure.
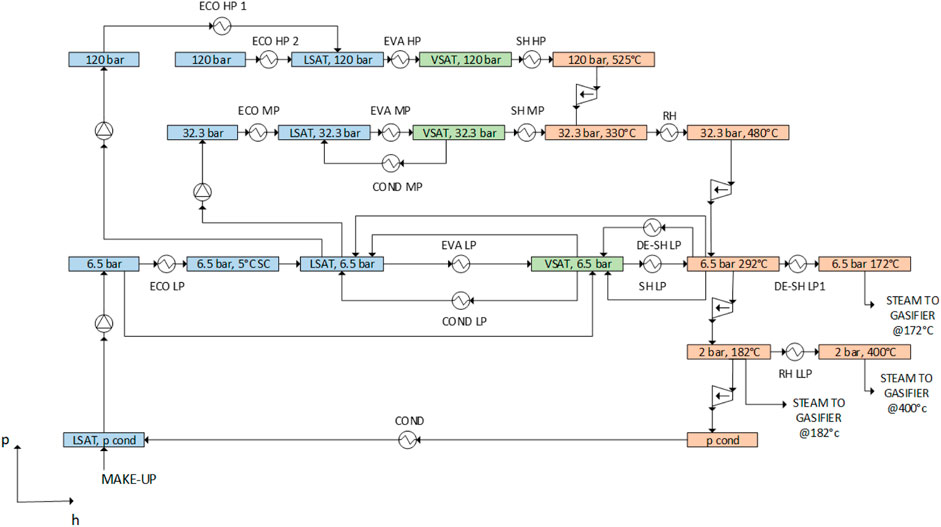
FIGURE 5. Scheme of the p-h superstructure representing the possible HRSC configurations. Colored boxes denote steam/water headers at fixed pressures and temperatures, which are connected by equipment units (pumps, economizers, evaporators, superheaters, and valves), as described by Elsido et al. (2017).
The Rankine cycle and HEN design problem is formulated as a challenging non-convex MINLP problem, which requires the ad hoc solution procedure proposed recently by Elsido et al. (2020, 2021) and approximately 13 h of computational time.
The ICE and HRSC electric power outputs and net electric efficiencies are shown in Table 6 for the different cases. The DG EO case holds the highest electricity production because of the highest purge flow rate of the series, which is a consequence of the highest hydrogen addition in all the considered cases. The IG EO and SEG EO cases are characterized by similar conditions upstream of the methanol synthesis, leading to similar electricity production. In BO, all the cases are characterized by higher RRs in the methanol synthesis with respect to the corresponding EO. Consequently, lower purge flow rates are fed to the ICE, leading to lower electricity production. Moreover, the net electric efficiency of the ICE decreases in baseline operation due to the lower thermal power of the purge flow from the methanol synthesis and purification island. Concerning the HRSC design and performance, the optimization depends on the availability of high-temperature heat and the steam exports required by the various operating modes. Due to steam extraction at a higher pressure (6.5 vs. 2 bar) in the DG cases, the flow through the LP turbine is significantly reduced, thus reflecting lower electricity production and efficiency of the steam cycle. In addition, the bigger differences between the baseline and enhanced operation of the DG case with respect to the IG case reflect a higher difference in terms of performance between BO and EO. There are two main reasons: 1) the high difference in steam required for the MDEA and 2) the higher amount of available heat in the EO, in particular from the syngas cooler, methanol reactor, and the condenser. These differences are lower in the IG case, thus yielding a small efficiency difference between BO and EO.
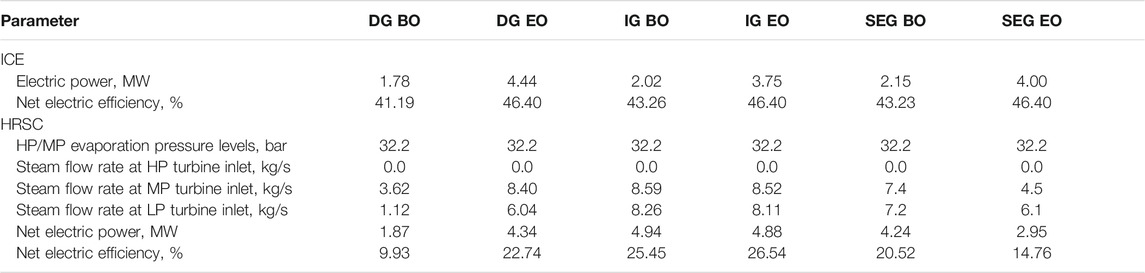
TABLE 6. ICE and heat recovery steam cycle electric power outputs and net electric efficiencies. Steam flow rates at HP (120 bar), MP (32.2 bar), and LP (6.5 bar) turbine inlet are also reported.
In Figure 6, the composite curves of the baseline operation of the DG and IG cases are reported. It can be seen that no pinch-point is reached in both cases due to the forbidden match constraints between syngas coolers and steam superheaters set to avoid metal dusting of the tubes.
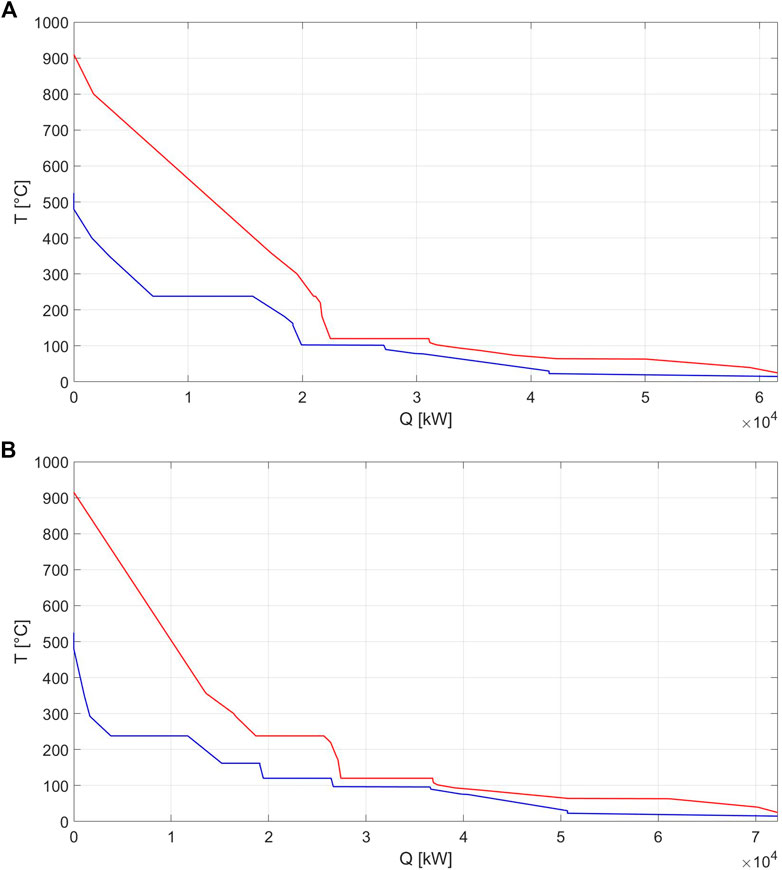
FIGURE 6. (A) Composite curve of indirect gasification baseline operation; (B) composite curve of direct gasification baseline operation.

FIGURE 7. Carbon efficiency, potential carbon efficiency, and useful potential carbon efficiency of the process in baseline (A) and enhanced operation (B) for the direct, indirect, and sorption-enhanced gasification-based plants.
3 Process Simulation Results
To evaluate the performance of the assessed power and biomass-to-methanol plants, the following key performance indicators have been used.
The fuel efficiency (
The useful fuel efficiency (
The carbon efficiency (
The achievable CE of a biofuel production plant is usually limited by the lack of hydrogen and the excess of oxygen in the feedstock, compared to the C:H:O ratio of the final product. The potential carbon efficiency (
A useful potential carbon efficiency (
The electric efficiency (
The equivalent fuel efficiency (
To account for the e-fuel production efficiency, the power-to-fuel efficiency (
In order to avoid the dependency on the efficiency of the electrolysis system, a hydrogen-to-fuel efficiency (
The performance indexes of the assessed PBtM plants are reported in Table 7.
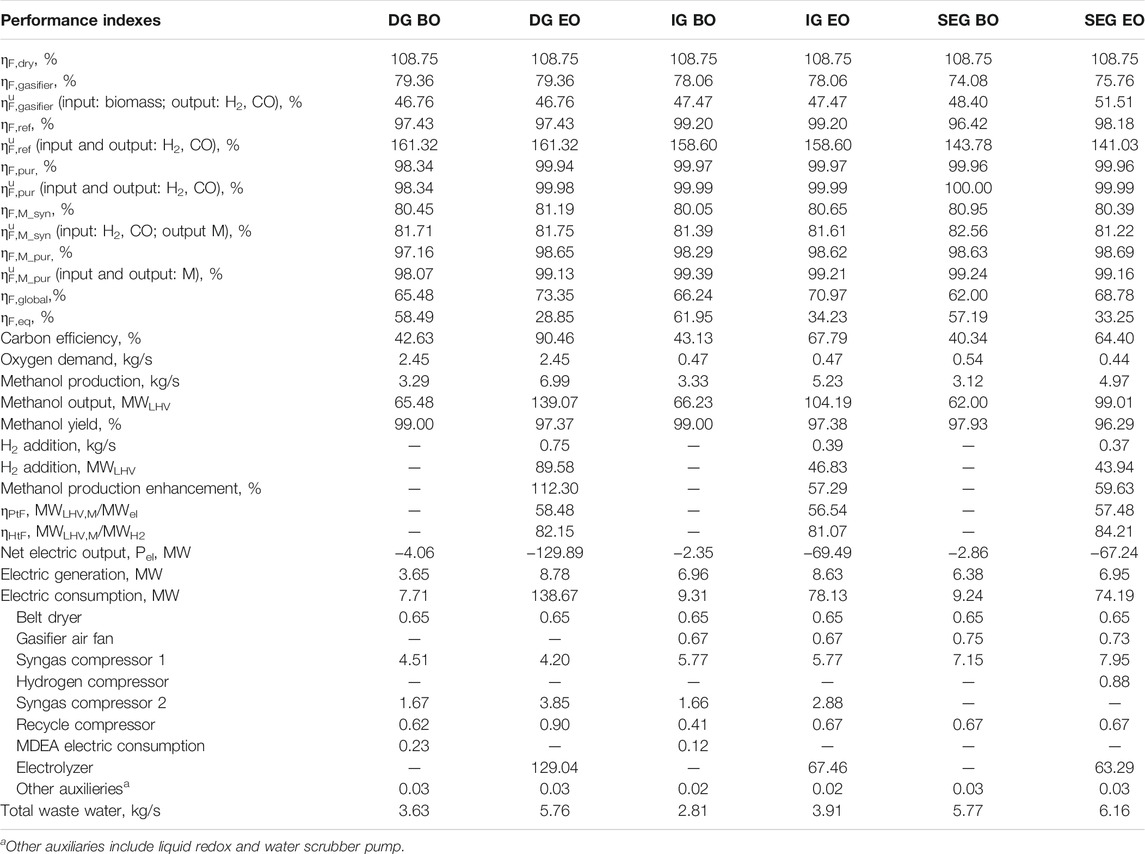
TABLE 7. General performance of the power and biomass-to-methanol plants.
In the enhanced operation (the prevailing operating mode), the DG-based plant holds the highest overall fuel efficiency of the series (73.3%), followed by the IG case (71.0%) and the SEG-based plant (68.8%).
Looking at the fuel efficiencies of the individual process units, the main differences are associated with the gasification process and the reforming. The DG case shows the highest gasifier fuel efficiency mainly because of the use of oxygen as an oxidant instead of air and the higher carbon conversion. Although the carbon utilization of the indirect gasifier is lower than in the aforementioned case, the fuel efficiencies are not very different in value because the indirect gasifier can benefit from the injection of superheated steam at 400°C, which can be safely produced from combustor off-gas cooling with no risk of metal dusting, in contrast to the DG-based plant. The higher the syngas flow rate and the difference between the gasifier and the reformer exit temperature, the lower the fuel efficiency of the reformer due to the higher oxygen demand to heat up the raw syngas to the reforming temperature. Consequently, the IG-based plant is characterized by the highest reformer fuel efficiency. For the same reason, the reformer fuel efficiency of the SEG case in baseline operation is lower with respect to the same value in the enhanced operation. Regarding the fuel efficiencies of the synthesis and the purification sections, the differences among the cases are modest and mainly related to the differences in the CO/CO2 ratio of the syngas.
The resulting fuel efficiencies of the overall plant are higher in the enhanced operation than in the baseline operation for all the configurations. The carbon efficiencies of all the plants in the series show modest differences in baseline operation. The rise of carbon efficiency achievable by hydrogen enrichment is significant, especially with the DG-based plant, which retains most of the carbon in the syngas and where it increases from 42.6% in the baseline operation to 90.5% in the enhanced operation mode.
The higher margin in hydrogen addition for the DG-based plant allows the methanol production to increase by 112.3% in the enhanced operation while in the IG and SEG cases, hydrogen addition boosts the methanol output by 57.3 and 59.6%, respectively.
As to the hydrogen-to-fuel efficiency, the SEG-based plant shows the highest value of 84.2%, followed by the DG case with 82.2% and the IG case with 81.1%. The reason for this trend can be explained by looking at the molecules that contribute to the carbon flow rate increases in the enhanced operation. In the IG-based plant, the enhancement of carbon flow rate occurs exclusively through an increase in the CO2 flow rate. In the DG and SEG configurations, instead, the increase in carbon flow rate takes place through an increase in both the CO and CO2 flow rates (74% of the increased carbon flow rate is associated with CO2 and 26% with CO in the DG plant, while 55 and 45% of the carbon flow rate increase are associated with CO2 and CO, respectively, in the SEG plant) because of the different syngas conditioning techniques in the selected configurations (i.e., presence of WGS reactor and/or CO2 removal unit). The trend also reflects the CO/CO2 ratio variation: high variation for the IG case (i.e., 14–1.4), modest variation for the DG case (i.e., 6.7–1.2), and almost unchanged ratio for the SEG case. The higher the increased carbon flow rate associated with CO2, the higher the amount of hydrogen consumed by the reversed WGS reaction in the methanol synthesis unit and the lower the hydrogen-to-fuel efficiency.
The power-to-fuel efficiency does not follow the same trend as the HtF efficiency because the PtF efficiency also depends on the effect of the modified operating conditions on the heat recovery steam cycle and the consumption of auxiliaries, leading to variation of the steam generated, utility consumptions, and ultimately electric balance, which are not just linked univocally to the consumption of the electrolysis system. The calculated PtF efficiency ranges from 56.5% of the IG case to 58.5% of the DG plant, confirming the values reported in the literature for PBtX plants based on low-temperature electrolysis systems (see the related discussion in the Section 1).
In Figure 7A, the trend of the carbon efficiency, potential carbon efficiency, and useful potential carbon efficiency is reported for the baseline operating mode of all the selected configurations. The evolution of the aforementioned indicators is observed along intermediate streams within the plant by following the approach proposed by Poluzzi et al. (2020). In the bar chart, the total amount of each atom is represented by the complete bar enclosed in the red contour. The yellow part of the bars embodies the maximum amount of each atom that can end up in the final product. Therefore, they are in the same proportion as the corresponding atoms in the final product. The blue part of the bars displays the potential loss of carbon and hydrogen to separate the excess oxygen as H2O or CO2. Oxygen excess is allocated to carbon and hydrogen to maximize the yield of the final product. The red part of the bar (when present) represents the excess hydrogen or carbon after the removal of the excess oxygen.
In all the selected configurations, the as-received biomass presents a carbon-to-hydrogen ratio much higher than that of methanol (0.70 vs. 0.25), and the oxygen excess causes the PCE to be equal to 70%. By means of the drying process, part of the water is removed from the biomass, resulting in a PCE reduction to about 47%. In the dried biomass, hydrogen becomes the limiting element. Therefore, the oxygen excess can be removed as CO2 without affecting the maximum fuel yield, as excess carbon remains available (red portion of the C bar).
In the DG case, the PCE rises to 51% across the gasifier, thanks to the addition of steam, leading to a raw syngas composition where no limiting element is present anymore (the red portion of the bar disappears). Simultaneously, the PCEu reduces to 27% because of the production of CH4 and CxHy, which are inert for the methanol synthesis. In the reformer, the PCE reduces (from 51 to 45%) because of oxygen addition, which may need to be separated downstream by causing a reduction of the potential amount of carbon and hydrogen ending up in the final product. On the contrary, the PCEu increases to 44% due to the conversion of the hydrocarbons into useful reactants (H2 and CO). The syngas conditioning step slightly affects the PCE, as these steps ultimately allocate oxygen atoms between H2O and CO2, which are then separated. Regarding the CE indicator, a slight reduction occurs upstream of the conditioning step due to the loss of unconverted carbon in the gasifier. Most CE reduction occurs in the CO2 removal unit, where carbon is separated from the syngas. After this step, the CE and PCE achieve the same value. In the fuel synthesis section, CE and PCE reduce by the same amount due to the incomplete conversion of the feed into methanol, which affects the two indexes in the same way. The PCEu reaches the same value as the aforementioned indicators (43%) after the purification step, where the CH4 is separated from the raw methanol stream.
In the IG-based plant, across the gasifier, the CE reduces to 72% and the PCE increases to 50%. The decrease in CE and the slightly lower increase in PCE compared to the DG case are due to the loss of carbon from the gasifier to the combustor, where the char is burned together with part of the input biomass. Also, the PCEu undergoes a great reduction (to 28%) because of the production of CH4 and CxHy. Across the reformer, the PCE reduces to 46% due to oxygen addition, while the CE remains constant and the PCEu increases. Syngas cleaning and conditioning slightly affect the PCE, while the CE reduces due to CO2 separation. After the synthesis and purification steps, all the indicators reach the same value and result in a final overall carbon efficiency of 43%.
In the SEG case, the lowest PCE is obtained at the gasifier outlet, equal to 43% due to the higher heat input to the combustor, also needed for the calcination of the CaO-based CO2 sorbent. As a result of the carbon loss, carbon becomes the limiting element in the raw gas, which presents a hydrogen excess (red portion of the bar). No substantial variation of the PCE occurs across the reformer for the assumed conditions, as the added oxygen can bond with the excess hydrogen and can be entirely removed as water. CE also drops in the gasifier to the same value as the PCE due to carbon separation through both the unconverted char and the absorbed CO2. As the extent of CO2 separation in the SEG is tuned to achieve the target syngas module downstream of the reformer, no variation of PCE and CE is observed in the conditioning step. The final overall carbon efficiency of the SEG-based system is 40%, which is the lowest of the series.
All the plants previously presented in baseline operation are shown in the enhanced operation in Figure 7A. Regarding the DG- and the IG-based plants, the same carbon efficiency trends of baseline operation are observed up to the reformed syngas. No substantial variations compared to the baseline case are observed for the PCE of the conditioned syngas in the IG case. In the DG-based plant, instead, the PCE of the conditioned syngas decreases by about 3% compared to the corresponding baseline case due to the WGS unit bypass, which leads to a syngas with a higher water content compared to the baseline case, causing a loss of hydrogen with the condensed water higher than needed compared to the oxygen excess in the syngas. As a result, after the condensed water is separated, hydrogen becomes the limiting element and excess carbon appears. In the SEG-based plants, the raw syngas features a higher CE compared to the baseline operation (about 69%) because less carbon is separated in the gasifier. The PCE of the raw syngas in the enhanced operation is about 6% higher than the baseline operation thanks to a higher content of carbon, which was the limiting element in the baseline operating mode. The PCE reduces within the reformer from about 49 to 45%. Then, CE and PCE do not change through the cleaning and conditioning step. In all the plants, the gap between the CE and the PCE represents the gain of carbon efficiency that may be achieved by hydrogen addition. This gap is filled in the enriching stage, where the PCE increases to the same value as the CE. As shown in the bar chart, the added hydrogen allows recovering the carbon potentially lost to remove the excess oxygen, behaving as an oxygen acceptor. The final overall carbon efficiencies are 90, 68, and 64% for the DG, IG, and SEG cases, respectively.
4 Economic Analysis
4.1 Levelized Cost of Fuel
The economic analysis is performed by adopting the levelized cost approach for the three PBtM plants. The levelized cost of the fuel is defined as the breakeven selling price that, at the end of the plant lifetime (LT), repays the total cost (
The Capex estimation approach is based on the percentage of delivered-equipment cost method, which requires the determination of the delivered-equipment cost for estimating the fixed-capital investment (FCI), the working capital (WC), and the total capital investment (TCI) through multiplying factors reported in Supplementary Material, Table B2. The approach is extensively described in the Supplementary Material. All the costs reported in this work refer to the year 2019.
In order to compute the Opex, the following costs are determined: utilities, maintenance and repairs, operating supplies, operating labor, laboratory costs, local taxes, insurance, and catalyst.
The main costs of the utilities are for the feedstock and the electricity. A ligneous biomass price of 45.7 €/t (4.7 €/GJ) is taken from Hannula and Kurkela (2013). The 2019 electricity prices of the day-ahead market of West Denmark (DK1) are considered in the calculations (ENTSO-E Transparency Platform, 2020). Denmark has been selected as the European country with the highest share of intermittent renewable energy sources and is, therefore, considered representative of the energy mix of other European countries in the coming decade. The average electricity price can be derived as a function of the operating hours from the cumulative electricity price duration curve. Therefore, once the electrolyzer capacity factor is fixed (80% in this analysis, as reference value), an average electricity price of 34.3 €/MWh in the enhanced operation and 55.3 €/MWh in baseline operation can be computed. Regarding the catalyst cost, according to Tan et al. (2016), a typical price for the commercial CZA methanol catalyst is 18.1 €/kg with a catalyst lifetime of 4 years. A more detailed explanation regarding the O&M costs is present in the Supplementary Material.
A summary of the aforementioned key parameters used in the analysis is reported in Table 8 and Supplementary Material, Table B2.
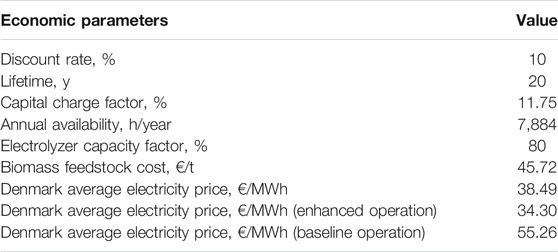
TABLE 8. Main parameters for the economic analysis.
In Table 9, the fixed-capital investment costs of the assessed plants are reported. The PBtM plants benefit from the absence of high capital cost ASU. However, as mentioned in Section 2.3, oxygen storage is needed for the ATR. In this case, 30-bar gaseous oxygen storage sized to cover 3 h of continuous operation is considered. The oxygen storage vessels represent about 2% of the total fixed cost for both the IG and the SEG cases and about 7% of the costs in the DG-based plant. Therefore, an additional DG-based plant is considered, named DGns (no storage) in Table 9, where the electrolyzer operates between a minimum load (baseline operation) and the maximum load (enhanced operation). The minimum load corresponds to 41%, which is the minimum capacity factor for the electrolyzer to guarantee the supply of the required amount of oxygen for the ATR. Table 9 shows that the biomass-to-syngas island capital cost of the DGns case is the lowest of the series because of the advantage of not installing the oxygen storage unit and because of the lower gasifier cost compared to the IG and SEG ones. The IG- and SEG-based plants have similar capital costs for the biomass-to-syngas island because similar equipment is adopted in the two configurations (i.e., dual fluidized bed gasifier in both). Regarding the cleaning and conditioning island, the differences between the cases are mainly due to the presence of the WGS reactor and of the CO2 removal unit. The DG-based plant holds the highest cost cleaning and conditioning island because of the presence of both such units. However, in the DGns case, the WGS reactor is not installed because the target module for the methanol synthesis is reached through the addition of hydrogen in the minimum electrolyzer load operation and CO2 removal. Moreover, the IG-based plants do not install the WGS. Therefore, the capital cost for the cleaning and conditioning section is similar to the DGns case. The SEG-based plant benefits from process intensification and does not need the WGS reactor or the CO2 removal unit. This results in the lowest cleaning and conditioning island capital cost, 47% lower than the DG case and about 33% lower than DGns and IG plants. Regarding the syngas-to-methanol island, the DG- and DGns-based plants are characterized by about 31% higher capital cost, mainly because of the higher number of tubes in the methanol synthesis reactor. The power island capital costs are very similar for all the cases. The cost of the electrolysis system accounts for the 32% of the total FCI for the DG- and DGns-based plants, 18% for the IG case and 19% for the SEG plant, including H2 compression. The assumed specific cost for the electrolysis system is 700 €/kWe, which is consistent with the current alkaline technology and the future cost estimations of PEM technology (Bertuccioli et al., 2014; International Energy Agency, 2019).
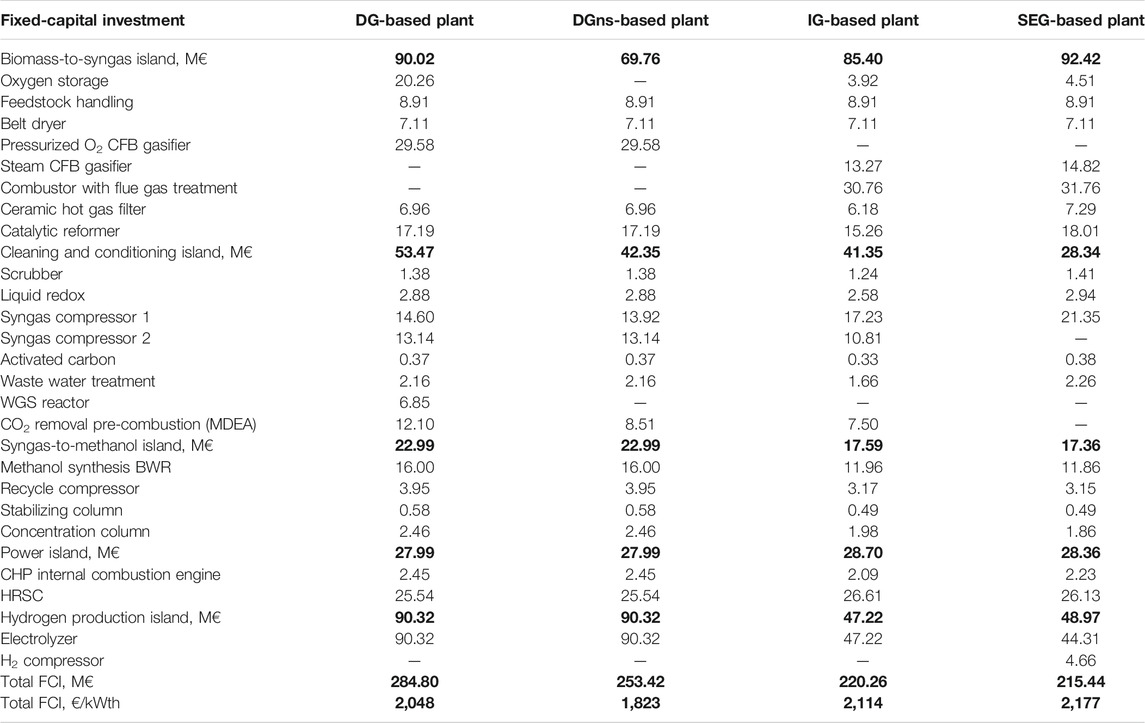
TABLE 9. Fixed-capital investment costs of the units of the PBtM plants. Numbers in bold are the sum of a series of values: example: power island: 27.99=2.45+25.54 (CHP ICE+HRSC).
Overall, the DG-based plant is characterized by the highest total FCI of the series because it has the largest electrolysis system and the largest oxygen storage. When the storage is not installed, the total FCI decreases by 11% also because of the absence of the WGS reactor. The SEG-based plant exhibits the lowest total FCI of the series thanks to process intensification. When FCI is referred to as the methanol production in EO (i.e., the prevalent operating mode), the DG-based plants show the lowest specific costs of the series, as the highest absolute FCI is compensated by the highest methanol productivity.
Table 10 displays the main economic results of the levelized cost approach, which is computed, assuming that all the plants operate in the enhanced mode for 80% of the time. The O&M costs follow the same trend as the TCI. Among the various cost items reported in Supplementary Material, Table B2, the maintenance and the operating labor correspond to about 45% and 25% of the total O&M, respectively. The DG and DGns cases feature the highest purchased electricity cost, as they incorporate the largest electrolysis systems and the highest production of hydrogen. Among these two, the DGns plant shows the highest purchased electricity cost because the electrolysis unit is turned on for all the operating hours of the plant. The DGns configuration shows the lowest LCOF of the series, thanks to the highest methanol production. The SEG-based plant is characterized by a slightly lower total cost with respect to the IG case. However, being less efficient than the counterfactual, the methanol production is 5% lower, and the LCOF results to be slightly higher. Overall, the differences in terms of the levelized cost of fuel are relatively small among the assessed cases, ranging from 29.7 €/GJ of the DGns case to 31.7 €/GJ of the DG case.
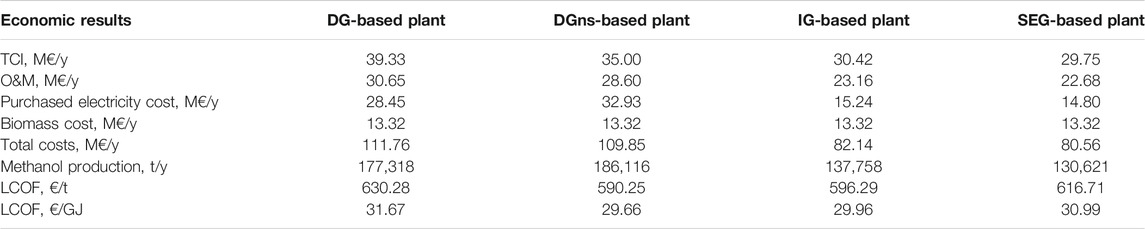
TABLE 10. Main result of the economic analysis and levelized cost of fuel for an electrolyzer investment cost of 700 €/kW.
In Figure 8A, the dependency of the LCOF on the average electricity price in EO and the electrolysis capital cost is depicted. Both the DG-based plants show a clear advantage in decreasing the electrolyzer cost as it represents a major cost item. In Figure 8B, the LCOF is reported as a function of the average electricity price in EO and the cost of the feedstock biomass, which is kept at the reference value of 46 €/t in one case and at 0 €/t in the other case. The dual fluidized bed configurations (i.e., IG and SEG) exhibit better economic performance at high electricity prices when free biomass is available because the feedstock cost has a higher share on the LCOF in the IG and SEG cases compared to their DG counterfactuals.
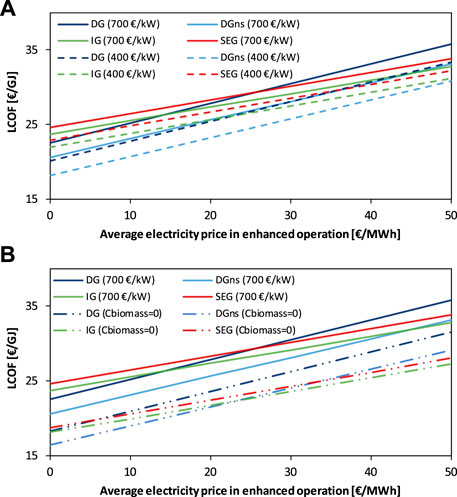
FIGURE 8. LCOF as a function of the average electricity price in the enhanced operation for (A) different electrolysis cost (i.e., 700 vs. 400 €/kW) and (B) different biomass cost (i.e., 46 €/t vs. 0 €/t).
4.2 Coupling With the Electricity Market
It is necessary to identify the number of hours of operation in the baseline and enhanced operating modes and the corresponding electricity prices to assess the economic competitivity and the profitability of the flexible PBtM plants. The fraction of the total operating hours in the baseline and enhanced operation may be estimated with the “willingness to pay” (WTP) methodology proposed by van Leeuwen and Mulder (2018), which has been also applied by Poluzzi et al. (2022).
The “short-term WTP” expresses the breakeven electricity price, making it economically profitable to activate the electrolyzer. Under such conditions, the revenues from the additional methanol production compensate for the additional operational costs (electricity and water). The short-term WTP (
Once a methanol selling price is assumed, the short-term WTP can be calculated from Eq. 11 and compared with the cumulative electricity price curve to estimate the number of operating hours in the enhanced operation. For that electrolyzer capacity factor, the value of the average electricity price in the enhanced and baseline operating mode can be computed.
The cumulative electricity price duration curve employed in this study represents the 2019 days-ahead market of West Denmark (DK1) (see Figure 9). As shown by Poluzzi et al. (2022), the electrolyzer capacity factor depends substantially on the shape of the cumulative electricity price duration curve, which is influenced by different factors, such as the location, the penetration of renewable energy sources (RES), the type of RES technology, the price of the fuel, the technology of fossil fuel power plants, and the type of final user (Afman et al., 2017; Seel et al., 2018; Ruhnau, 2020; Sorknæs et al., 2020). For these reasons, Poluzzi et al. (2022) also considered a modified cumulative electricity price curve to reflect the expected tendency of average electricity price reduction, accompanied by peak price increases expected to derive from an increase in the intermittent RES penetration.
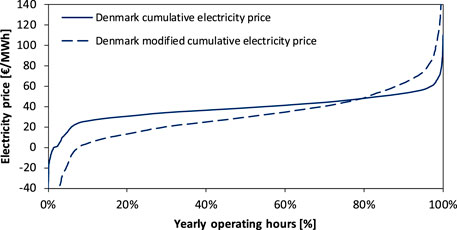
FIGURE 9. Denmark cumulative electricity price and modified Denmark cumulative electricity price.
In Figure 10, the internal rate of return (IRR) of the DG-based plant is reported as a function of the methanol selling price for an electrolyzer investment cost of 400 €/kW. The functions are derived from the 2019 Denmark electricity price curve and the modified curve. The solid lines refer to the flexible DG-based plant, where the increase in the methanol selling price involves an increase in the electrolyzer capacity factor, with the method described previously. The dashed lines refer to the inflexible DG-based plant, with a 100% capacity factor of the electrolysis system, purchasing electricity at the yearly average electricity price of the current price curve (38.5 €/MWh) and the modified curve (30.4 €/MWh). The IRR value of 10% defines the region above which the selected PBtM plants are considered profitable.
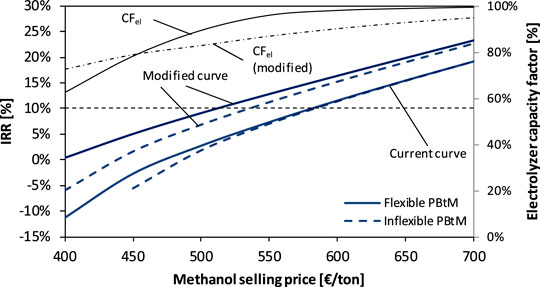
FIGURE 10. IRR of the DG-based plant as a function of the methanol selling price for an electrolyzer investment cost of 400 €/kW. Curves are derived from the two electricity price curves shown in Figure 9.
The curves derived from the current Danish electricity prices (“current” curve) display a profitable investment at methanol selling prices higher than about 575 €/t. In this case, a profitable investment requires a high methanol selling price that involves a very high capacity factor of the electrolyzer (CFel approaches 100%). This means that the added value of a flexible PBtM plant is limited compared to an inflexible plant that always keeps the electrolyzer in operation. On the contrary, the curves derived from the modified electricity price curve show profitable investment at lower methanol selling prices due to the lower average electricity price of the modified curve with respect to the Denmark one. In this case, the advantage of flexible operation in terms of profitability is more marked, which is witnessed by the fact that the solid line is above the dashed one for a wide range of methanol prices. The breakeven methanol selling price results to be about 510 €/t for the flexible PBtM plant and 535 €/t for the inflexible plant.
In Figure 11, the IRR of the flexible DG and DGns plants is shown as a function of the methanol selling price for the current and the modified electricity curve. The DGns case is profitable at lower methanol selling prices than the DG case for both the electricity curves. The modified curve gives an economic advantage to both plants, reducing the breakeven methanol selling price by 62–70 €/t.
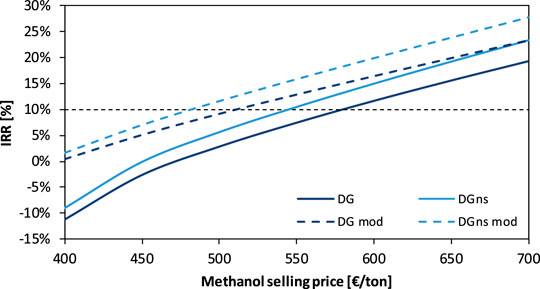
FIGURE 11. IRR of the DG and DGns based plants as a function of the methanol selling price for an electrolyzer investment cost of 400 €/kW. Curves are derived from the two electricity price curves shown in Figure 9.
In Figure 12, the IRR of the DGns-, IG-, and SEG-based plants is compared as a function of the methanol selling price. The DGns case is profitable at lower methanol selling prices than the other cases for both the electricity curves. The modified curve gives an economic advantage to all the configurations, reducing the breakeven methanol selling price by 62, 50, and 46 €/t for DGns, IG, and SEG, respectively. The plant investment is profitable (i.e., IRR higher or equal to 10%) at relatively high capacity factors of the electrolysis unit. With the modified electricity price curve, the capacity factors, which guarantee a profitable investment, are higher than 80.7, 82.9, and 85.1% for DGns, IG, and SEG, respectively. With the 2019 electricity curve, the capacity factors are even higher and reach 94.3, 95.3, and 97.0% for DGns, IG, and SEG, respectively.
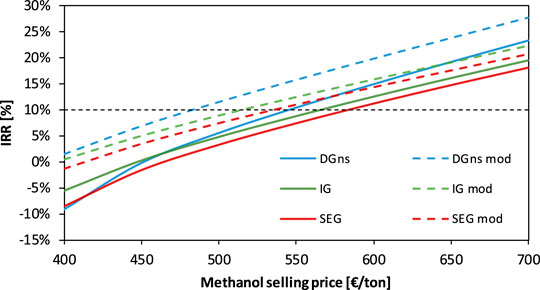
FIGURE 12. IRR of the DGns-, IG-, and SEG-based plants as a function of the methanol selling price for an electrolyzer investment cost of 400 €/kW. Curves are derived from the two electricity price curves shown in Figure 9.
5 Conclusion
This article evaluates from techno-economic perspectives the design and the operational criteria of a series of power-to-methanol (PBtM) plants, employing different gasification technologies: direct gasification (DG), indirect gasification (IG), and sorption-enhanced gasification (SEG). This kind of plants is capable of operating flexibly without hydrogen addition (baseline operation) and with hydrogen addition (enhanced operation). The main technical conclusions can be summarized as follows:
- No technical criticality has been highlighted in the design and operation of flexible PBtX plants. However, different gasification technologies involve different strategies to control the syngas module to operate with and without hydrogen input (i.e., presence of WGS reactor and/or CO2 removal unit). The different gasification technologies lead to different values of the CO/CO2 ratio in the feed of the methanol synthesis unit. The operational criteria of the methanol synthesis section change accordingly. From a design perspective, no issues have been detected regarding the risk of hot spots in the methanol reactor in any operating conditions, provided that the recycle rate is increased in the baseline operation. On the contrary, the reduced flow rate of produced methanol in the baseline operation may cause malfunctioning of the purification columns. Therefore, a recycle may be needed to keep the columns operating efficiently.
- The DG-based plant can take advantage of higher carbon efficiency (CE) of the gasification process, leading to higher overall plant carbon efficiency (∼90%) in the enhanced operation. The SEG and IG cases achieve similar maximum CE in the enhanced operation (64.4% SEG and 67.8% IG), though significantly lower than DG due to CO2 loss from the combustor. A higher CE would only be possible by recovering the CO2 in the flue gas with a post-combustion CO2 capture or through oxyfuel combustion.
- Hydrogen-to-fuel (HtF) efficiency ranges between 81 and 84%, while power-to-fuel (PtF) efficiency between 56 and 58%, with a low-temperature electrolysis system.
The main results from the economic analysis can be summarized as follows:
- Due to the high oxygen demand in the gasifier, the DG-based plant obtains a great advantage from avoiding an inevitably large O2 storage system. Therefore, it appears economically preferable to operate the plant between a minimum load satisfying the O2 demand of DG at high electricity prices and a maximum load to maximize methanol production and carbon efficiency at low electricity prices. This allows avoiding large O2 storage with significant benefits for Capex and safety issues.
- In all cases, the flexible PBtX plants can take advantage of electricity price curves with low average electricity prices and high peak prices. Without sufficiently long and high peak electricity prices, an inflexible plant with electrolysis always in operation would lead to a limited economic penalty compared to a flexible plant.
- The specific fixed-capital investment (FCI) ranges between 1823 and 2048 €/kW of methanol output in the enhanced operation. The LCOFs range between 29.7 and 31.7 €/GJLHV. Economic advantages would derive from a decrease in the electrolysis capital investment, especially for the DG-based plants, which employ the largest electrolysis system. In particular, a reduction of the capital cost of the electrolysis system from 700 €/kW to 400 €/kW involves a decrease in the specific FCI by 15.3, 13.6, 9.2, and 8.8% in DGns, DG, IG, and SEG, respectively. The LCOF decreases by 7.9, 7.8, 5.5, and 5.3% in DGns, DG, IG, and SEG, respectively.
- The methanol breakeven selling prices range between 545 and 582 €/t with the current reference Denmark electricity price curve (yearly average electricity price of 38.5 €/MWh, average electricity price in the enhanced operation of 34.3 €/MWh) and between 484 and 535 €/t with the assumed modified electricity price curve of a future energy mix with increased penetration of intermittent renewables (yearly average electricity price of 30.4 €/MWh, average electricity price in the enhanced operation of 20.6 €/MWh).
- In all the cases, the investment in the assessed flexible PBtM plants is profitable for relatively high capacity factors (higher than 80%), meaning that the operational flexibility should be exploited by avoiding the consumption of high-price electricity rather than in the use of the limited amounts of low-price “excess” electricity.
Data Availability Statement
The original contributions presented in the study are included in the article/Supplementary Material, further inquiries can be directed to the corresponding author.
Author Contributions
AP: conceptualization, methodology, investigation and formal analysis (process simulation and techno-economic analysis), writing—original draft, visualization, writing—review and editing, and project administration. GG: conceptualization, methodology and validation (process simulation and techno-economic analysis), and project administration. SG: methodology and investigation and formal analysis (methanol synthesis reactor). MM: methodology and investigation and formal analysis (steam cycle optimization). SM: methodology and investigation and formal analysis (methanol purification). PH: methodology and investigation and formal analysis (capital and operating cost). GR: methodology and investigation and formal analysis (capital and operating cost). JP: validation (technology, gasification island). EM: validation (steam cycle optimization). GG: validation (methanol synthesis). MR: conceptualization, supervision, methodology and validation (process simulation and techno-economic analysis), writing—review and editing, project administration, and funding acquisition.
Funding
This work was performed within the framework of FLEDGED H2020 Project. This project received funding from the European Union’s Horizon 2020 Research and Innovation Programme under Grant Agreement no. 727600.
Conflict of Interest
Authors PH and GR were employed by Frames Renewable Energy Solutions BV. Author JP was employed by company Sumitomo SHI FW Energia Oy.
The remaining authors declare that the research was conducted in the absence of any commercial or financial relationships that could be construed as a potential conflict of interest.
Publisher’s Note
All claims expressed in this article are solely those of the authors and do not necessarily represent those of their affiliated organizations, or those of the publisher, the editors and the reviewers. Any product that may be evaluated in this article, or claim that may be made by its manufacturer, is not guaranteed or endorsed by the publisher.
Supplementary Material
The Supplementary Material for this article can be found online at: https://www.frontiersin.org/articles/10.3389/fenrg.2021.795673/full#supplementary-material
References
Afman, M., Hers, S., and Scholten, T. (2017). Energy and Electricity price Scenarios 2020-2023-2030: Input to Power to Ammonia Value Chains and Business Cases. Delft: CE Delft.
Albrecht, F. G., König, D. H., Baucks, N., and Dietrich, R.-U. (2017). A Standardized Methodology for the Techno-Economic Evaluation of Alternative Fuels - A Case Study. Fuel 194, 511–526. doi:10.1016/j.fuel.2016.12.003
Armbrust, N., Schweitzer, D., Gredinger, A., Beirow, M., Poboss, T. B. N., Hawthorne, C., et al. (2014). “Gasification of Biomass with In-Situ CO2 Capture and Separation in a 200 kWth Pilot Plant Fluidized Bed Gasification Infrastructure,” in Gasification Technologies (Washington D.C.: Gasification Technologies).
Bertuccioli, L., Chan, A., Hart, D., Lehner, F., Madden, B., and Standen, E. (2014). Development of Water Electrolysis in the European Union - Final Report. FCH-JU.
Echt, B., Leppin, D., Mamrosh, D., Mirdadian, D., Seeger, D., and Warren, B. (2017). Fundamentals of Low-Tonnage Sulfur Removal and Recovery.
Elsido, C., Martelli, E., and Grossmann, I. E. (2021). Multiperiod Optimization of Heat Exchanger Networks with Integrated Thermodynamic Cycles and thermal Storages. Comput. Chem. Eng. 149, 107293. doi:10.1016/J.COMPCHEMENG.2021.107293
Elsido, C., Martelli, E., and Grossmann, I. E. (2020). Simultaneous Multiperiod Optimization of Rankine Cycles and Heat Exchanger Networks. Comput. Aided Chem. Eng. 48, 1495–1500. doi:10.1016/b978-0-12-823377-1.50250-0
Elsido, C., Mian, A., and Martelli, E. (2017). A Systematic Methodology for the Techno-Economic Optimization of Organic Rankine Cycles. Energ. Proced. 129, 26–33. doi:10.1016/j.egypro.2017.09.171
ENTSO-E Transparency Platform (2020). Central Collection and Publication of Electricity Generation, Transportation and Consumption Data and Information for the Pan-European Market. Available at: https://transparency.entsoe.eu/(Accessed 1st October 2020, 2020).
Fagernäs, L., Brammer, J., Wilén, C., Lauer, M., and Verhoeff, F. (2010). Drying of Biomass for Second Generation Synfuel Production. Biomass and Bioenergy 34, 1267–1277. doi:10.1016/j.biombioe.2010.04.005
Fuchs, J., Schmid, J. C., Müller, S., Mauerhofer, A. M., Benedikt, F., and Hofbauer, H. (2020). The Impact of Gasification Temperature on the Process Characteristics of Sorption Enhanced Reforming of Biomass. Biomass Conv. Bioref. 10, 925–936. doi:10.1007/s13399-019-00439-9
Grabke, H. J. (1995). Metal Dusting of Low- and High-Alloy Steels. Corrosion 51, 711–720. doi:10.5006/1.3293634
Hafner, S., Schmid, M., and Scheffknecht, G. (2021). Parametric Study on the Adjustability of the Syngas Composition by Sorption-Enhanced Gasification in a Dual-Fluidized Bed Pilot Plant. Energies 14, 399. doi:10.3390/en14020399
Hafner, S., and Schmid, M. (2020). WP 3 – Deliverable D3.4: Final Experimental Results on SEG Process Experiments at Pilot (TRL5) Scale for Stationary and Flexible Operating Regimes.
Hannula, I. (2015). Co-production of Synthetic Fuels and District Heat from Biomass Residues, Carbon Dioxide and Electricity: Performance and Cost Analysis. Biomass and Bioenergy 74, 26–46. doi:10.1016/j.biombioe.2015.01.006
Hannula, I. (2016). Hydrogen Enhancement Potential of Synthetic Biofuels Manufacture in the European Context: A Techno-Economic Assessment. Energy 104, 199–212. doi:10.1016/j.energy.2016.03.119
Hannula, I., and Kurkela, E. (2013). Liquid Transportation Fuels via Large-Scale Fluidised Bed Gasification of Lignocellulosic Biomass. Espoo: VTT.
Hillestad, M., Ostadi, M., Alamo Serrano, G. D., Rytter, E., Austbø, B., Pharoah, J. G., et al. (2018). Improving Carbon Efficiency and Profitability of the Biomass to Liquid Process with Hydrogen from Renewable Power. Fuel 234, 1431–1451. doi:10.1016/j.fuel.2018.08.004
International Energy Agency (2019). The Future of Hydrogen - Seizing Today’s Opportunities - Report Prepared for the G20. Japan.
Kazemi, A., Malayeri, M., Gharibi kharaji, A., and Shariati, A. (2014). Feasibility Study, Simulation and Economical Evaluation of Natural Gas Sweetening Processes - Part 1: A Case Study on a Low Capacity Plant in iran. J. Nat. Gas Sci. Eng. 20, 16–22. doi:10.1016/j.jngse.2014.06.001
Koppatz, S., Pfeifer, C., Rauch, R., Hofbauer, H., Marquard-Moellenstedt, T., and Specht, M. (2009). H2 Rich Product Gas by Steam Gasification of Biomass with In Situ CO2 Absorption in a Dual Fluidized Bed System of 8 MW Fuel Input. Fuel Process. Techn. 90, 914–921. doi:10.1016/j.fuproc.2009.03.016
Kurkela, E., Kurkela, M., Frilund, C., Hiltunen, I., Rollins, B., and Steele, A. (2021). Flexible Hybrid Process for Combined Production of Heat, Power and Renewable Feedstock for Refineries: Managing Seasonal Energy Supply and Demand for Heat and Power in Europe. Johnson Matthey Technol. Rev. 65, 346–348. doi:10.1595/205651321X1615883933403110.1595/205651321x16013744201583
Kurkela, E., Kurkela, M., and Hiltunen, I. (2016). Steam-oxygen Gasification of forest Residues and Bark Followed by Hot Gas Filtration and Catalytic Reforming of Tars: Results of an Extended Time Test. Fuel Process. Techn. 141, 148–158. doi:10.1016/j.fuproc.2015.06.005
Löffler, G., Kaiser, S., Bosch, K., and Hofbauer, H. (2003). Hydrodynamics of a Dual Fluidized-Bed Gasifier-Part I: Simulation of a Riser with Gas Injection and Diffuser. Chem. Eng. Sci. 58, 4197–4213. doi:10.1016/S0009-2509(03)00232-X
Martelli, E., Elsido, C., Mian, A., and Marechal, F. (2017). MINLP Model and Two-Stage Algorithm for the Simultaneous Synthesis of Heat Exchanger Networks, Utility Systems and Heat Recovery Cycles. Comput. Chem. Eng. 106, 663–689. doi:10.1016/j.compchemeng.2017.01.043
Martelli, E., Zatti, M., Gabba, M., Rossi, M., Morini, M., and Gambarotta, A. (2018). Towards the Optimal Design and Operation of Multi-Energy Systems: the "Efficity" Project. Environ. Eng. Manag. J. 17, 2409–2419. doi:10.30638/eemj.2018.239
Montebelli, A., Visconti, C. G., Groppi, G., Tronconi, E., Ferreira, C., and Kohler, S. (2013). Enabling Small-Scale Methanol Synthesis Reactors through the Adoption of Highly Conductive Structured Catalysts. Catal. Today 215, 176–185. doi:10.1016/j.cattod.2013.02.020
Palonen, J. (2012). Gasified Biomass for Biofuels Production : Foster Wheeler’s Technology Developments for Large Scale Applications.
Palonen, J., Huttenhuis, P., Rexwinkel, G., Astolfi, M., and Elsido, C. (2017). FLEDGED Deliverable D5.1: Economic Framework and Simplified Model for Capital Cost Estimation.
Pitkäoja, A., Ritvanen, J., Hafner, S., Hyppänen, T., and Scheffknecht, G. (2021). Numerical Modelling of Sorption-Enhanced Gasification: Development of a Fuel Decomposition Model. Fuel 289, 119868. doi:10.1016/j.fuel.2020.119868
Poboß, N. (2016). Experimentelle Untersuchung der sorptionsunterstützten Reformierung. Stuttgart: University of Stuttgart.
Poluzzi, A., Guandalini, G., d’Amore, F., and Romano, M. C. (2021). The Potential of Power and Biomass-To-X Systems in the Decarbonization Challenge: a Critical Review. Curr. Sustain. Renew. Energ. Rep 8, 242–252. doi:10.1007/s40518-021-00191-7
Poluzzi, A., Guandalini, G., Guffanti, S., Elsido, C., Moioli, S., Huttenhuis, P., et al. (2022). Flexible Power & Biomass-To-Methanol Plants: Design Optimization and Economic Viability of the Electrolysis Integration. Fuel 310, 122113. doi:10.1016/J.FUEL.2021.122113
Poluzzi, A., Guandalini, G., and Romano, M. C. (2020). “Potential Carbon Efficiency” as a New index to Track the Performance of Biofuels Production Processes. Biomass and Bioenergy 142, 105618. doi:10.1016/j.biombioe.2020.105618
Pröll, T., and Hofbauer, H. (2008a). Development and Application of a Simulation Tool for Biomass Gasification Based Processes. Int. J. Chem. React. Eng. 6, A89. doi:10.2202/1542-6580.1769
Pröll, T., and Hofbauer, H. (2008b). H2 Rich Syngas by Selective CO2 Removal from Biomass Gasification in a Dual Fluidized Bed System - Process Modelling Approach. Fuel Process. Techn. 89, 1207–1217. doi:10.1016/j.fuproc.2008.05.020
Renon, H., and Prausnitz, J. M. (1968). Local Compositions in Thermodynamic Excess Functions for Liquid Mixtures. Aiche J. 14, 135–144. doi:10.1002/aic.690140124
Ruhnau, O. (2020). Market-based Renewables: How Flexible Hydrogen Electrolyzers Stabilize Wind and Solar Market Values. Kiel: Leibniz Information Centre of Economics.
Schmid, J. C., Fuchs, J., Benedikt, F., Mauerhofer, A. M., Müller, S., Hofbauer, H., et al. (2017). “Sorption Enhanced Reforming with the Novel Dual Fludized Bed Test Plant at TU Wien (Stockholm: EUBCE).
Schmidt, O., Gambhir, A., Staffell, I., Hawkes, A., Nelson, J., and Few, S. (2017). Future Cost and Performance of Water Electrolysis: An Expert Elicitation Study. Int. J. Hydrogen Energ. 42, 30470–30492. doi:10.1016/j.ijhydene.2017.10.045
Seel, J., Mills, A., Wiser, R., Deb, S., Asokkumar, A., Hassanzadeh, M., et al. (2018). Impacts of High Variable Renewable Energy Futures on Wholesale Electricity Prices , and on Electric-Sector Decision Making. Berkeley: U.S. Department of Energy's Office of Energy Efficiency and Renewable Energy under Lawrence Berkeley National Laboratory.
Sorknæs, P., Lund, H., Skov, I. R., Djørup, S., Skytte, K., Morthorst, P. E., et al. (2020). Smart Energy Markets - Future Electricity, Gas and Heating Markets. Renew. Sustain. Energ. Rev. 119, 109655. doi:10.1016/j.rser.2019.109655
STELA drying technology (2019). Brochure on Low-Temperature belt Dryer. Massing: STELA Laxhuber GmbH
Tan, E. C., Talmadge, M., Dutta, A., Hensley, J., Snowden‐Swan, L. J., Humbird, D., et al. (2016). Conceptual Process Design and Economics for the Production of High‐octane Gasoline Blendstock via Indirect Liquefaction of Biomass through Methanol/dimethyl Ether Intermediates. Biofuels, Bioprod. Bioref. 10, 17–35. doi:10.1002/bbb.1611
Thunman, H., Seemann, M., Berdugo Vilches, T., Maric, J., Pallares, D., Ström, H., et al. (2018). Advanced Biofuel Production via Gasification - Lessons Learned from 200 Man-Years of Research Activity with Chalmers' Research Gasifier and the GoBiGas Demonstration Plant. Energy Sci. Eng. 6, 6–34. doi:10.1002/ese3.188
Twigg, M. V., and Spencer, M. S. (2001). Deactivation of Supported Copper Metal Catalysts for Hydrogenation Reactions. Appl. Catal. A: Gen. 212, 161–174. doi:10.1016/S0926-860X(00)00854-1
van Leeuwen, C., and Mulder, M. (2018). Power-to-gas in Electricity Markets Dominated by Renewables. Appl. Energ. 232, 258–272. doi:10.1016/j.apenergy.2018.09.217
Vanden Bussche, K. M. V., and Froment, G. F. (1996). A Steady-State Kinetic Model for Methanol Synthesis and the Water Gas Shift Reaction on a Commercial Cu/ZnO/Al2O3Catalyst. J. Catal. 161, 1–10. doi:10.1006/jcat.1996.0156
Yee, T. F., and Grossmann, I. E. (1990). Simultaneous Optimization Models for Heat Integration-II. Heat Exchanger Network Synthesis. Comput. Chem. Eng. 14 (10), 1165–1184. doi:10.1016/0098-1354(90)85010-8
Zhang, H., Wang, L., Van herle, J., Maréchal, F., and Desideri, U. (2020). Techno-economic Evaluation of Biomass-To-Fuels with Solid-Oxide Electrolyzer. Appl. Energ. 270, 115113. doi:10.1016/j.apenergy.2020.115113
Glossary
ASU Air separation unit
ATR Autothermal reformer
BFB Bubbling fluidized bed
BO Baseline operation
BtM Biomass-to-methanol
BtX Biomass-to-X
BWR Boiling water reactor
CFB Circulating fluidized bed
CZA Methanol synthesis catalyst Cu/ZnO/Al2O3
DG Direct gasification
DGns Direct gasification no storage
EO Enhanced operation
GHSV Gas hourly space velocity
HEN Heat exchanger network
HP High-pressure level
HRSC Heat recovery steam cycle
ICE Internal combustion engine
IG Indirect gasification
LHV Lower heating value
LP Low-pressure level
M Methanol
MINLP Mixed-integer nonlinear programming
MP Medium-pressure level
PBtM Power and biomass-to-methanol
PBtX Power and biomass-to-X
PtX Power-to-X
RR Recycle ratio
SEG Sorption-enhanced gasification
WGS Water-gas shift
Keywords: E-fuels, biofuels, gasification (biomass), electrolysis, flexibility
Citation: Poluzzi A, Guandalini G, Guffanti S, Martinelli M, Moioli S, Huttenhuis P, Rexwinkel G, Palonen J, Martelli E, Groppi G and Romano MC (2022) Flexible Power and Biomass-To-Methanol Plants With Different Gasification Technologies. Front. Energy Res. 9:795673. doi: 10.3389/fenrg.2021.795673
Received: 15 October 2021; Accepted: 20 December 2021;
Published: 27 January 2022.
Edited by:
Ilkka Hannula, International Energy Agency, FranceReviewed by:
Muhammad Aziz, The University of Tokyo, JapanFehmi Akgun, TUBITAK Marmara Research Centre Energy Institute, Turkey
Copyright © 2022 Poluzzi, Guandalini, Guffanti, Martinelli, Moioli, Huttenhuis, Rexwinkel, Palonen, Martelli, Groppi and Romano. This is an open-access article distributed under the terms of the Creative Commons Attribution License (CC BY). The use, distribution or reproduction in other forums is permitted, provided the original author(s) and the copyright owner(s) are credited and that the original publication in this journal is cited, in accordance with accepted academic practice. No use, distribution or reproduction is permitted which does not comply with these terms.
*Correspondence: M. C. Romano, bWF0dGVvLnJvbWFub0Bwb2xpbWkuaXQ=