 Yu Liao1
 Peiyang Li
- 1School of Economics and Management, Beijing Jiaotong University, Beijing, China
- 2School of Management, Wuhan University of Technology, Wuhan, China
Under the background of increasingly prominent environmental problems, exploring the impact of green innovation on the sustainable development ability of enterprises not only can expand the boundary of the research on the factors influencing enterprises’ sustainable development ability and the economic consequences of green innovation but also can provide reference for the decision-making of the listed companies. On the basis of the manual collection of green innovation patent data from China National Intellectual Property Administration, this paper selects the Chinese A-share listed companies from 2010 to 2018 as the research subject and empirically tests the impact of green innovation on the corporate sustainable development ability. The results show that the output of green innovation significantly improves the corporate sustainable development ability. This result is economically significant. Specifically, a one–standard deviation increase (0.8147) of GI translates into a sustainable growth rate of 20.78 percentage points (0.0175*0.8147/0.0686) higher. The relationship between the output of green innovation and corporate sustainable development ability is more significant when the corporate social responsibility performance is worse or scientific research ability is weaker. A series of robustness test results show that the conclusions are reliable. Further test shows that green innovation plays a more significant role in enhancing the corporate sustainable development ability in non–state-owned enterprises. In addition, only invention patents of green innovation can significantly improve the corporate sustainable development ability, whereas non-invention patents cannot affect it. This paper provides a new perspective for the research on the factors affecting the corporate sustainable development ability. Furthermore, the research conclusions of this paper are of reference significance both in theory and practice.
1 Introduction
With the rapid development of the industrial economy, environmental pollution has gradually become an important threat faced by many countries. To tackle the challenges posed by environmental problems, every country is looking for strategies that can achieve the dual objectives of environmental protection and economic development. Sustainable development, on account of its dual nature of sustainability and development, has become an important issue for countries to properly handle the balance between environment and development. In the past, there seems to be a natural contradiction between sustainability and development due to the non-renewable nature of resources, the one-sidedness of resource pricing, and the non-long-term nature of evaluation indicators. However, with the improvement of science and technology, the contradiction between sustainability and development has been gradually diluted. Among them, green innovation plays a crucial role in improving the corporate sustainable development ability.
The strategy of green innovation is that enterprises take sustainable development as the goal, develop environmental protection products, or improve management methods to make products and services meet human needs while reducing the negative impact on the environment, so as to maintain the continuous operation of enterprises. Sharma and Vredenburg (1998) define the ability formed by enterprises in the process of green innovation as a green dynamic ability, which can enable enterprises to break the dependence on the original path and gain sustainable competitive advantage. In China’s capital market, there are a lot of cases that enterprises can improve their sustainable development ability through green innovation. For example, Shandong Chenming Paper Co., Ltd., following the direction of “Made in China 2025” planning, has successfully entered the world’s top 10 paper enterprises and China’s top 500 manufacturing enterprises from a paper factory on the verge of bankruptcy through green transformation and upgrading. Specifically, Shandong Chenming Paper Co., Ltd., adheres to the general tone of green, circular, low-carbon, and sustainable development; implements the coordinated development process of “green technology-green organization-green industrial chain”; and improves the sustainable development capacity of the enterprise through green innovation.
At present, existing studies mainly focus on the impact of green supply chain management (Wu, 2013), public welfare donation (Wu and Zhang, 2017), and debt heterogeneity (Jin, 2019) on enterprises’ sustainable development ability. However, these studies ignore the important role of green innovation. We hold the opinion that, on the one hand, green innovation can help improve the reputation of enterprises, help enterprises gain more market share, and thus improve the sustainable development ability of enterprises. On the other hand, green innovation helps to improve the production process of enterprises, improve the utilization rate of resources, and thus improve the sustainable development ability of enterprises.
On the basis of that, this paper selects the Chinese A-share listed companies from 2010 to 2018 as the research object and empirically tests the impact of green innovation on enterprises’ sustainable development ability. The data used in this article come from the social responsibility assessment system of HeXun, the website of the State Intellectual Property Office, WIND database, and CSMAR database. The results show that the output of green innovation significantly improves corporate sustainable development. When the corporate social responsibility (CSR) performance is worse or scientific research ability is weaker, green innovation plays a more significant role in improving corporate sustainable development. The above results remain valid in the robustness test. In the further test, the study shows that compared with state-owned enterprises, the improvement of green innovation on corporate sustainable development is more significant in non–state-owned enterprises. In addition, the research results show that only invention patents of green innovation can significantly improve corporate sustainable development, whereas non-invention patents cannot affect corporate sustainable development.
The contribution of this study is mainly reflected in the following aspects: First, this paper takes the investment in green innovation as the entry point to explore the impact of corporate innovation investment on sustainable development ability, which helps to provide a new perspective for the research on factors related to the corporate sustainable development ability. Existing studies mainly focus on the impact of green supply chain management (Wu, 2013), public welfare donation (Wu and Zhang, 2017), and debt heterogeneity (Jin, 2019) on the sustainable development ability of enterprises. However, these studies ignore the impact of the investment in green innovation, an important corporate investment activity, on the sustainable development ability. In this study, we focus on the impact of the investment in green innovation on corporate sustainable development and provide a new perspective for the research on the factors affecting corporate sustainable development from the point of innovation investment.
Second, this paper takes the sustainable development ability of enterprises as the foothold to explore the impact of the investment in green innovation on the sustainable development of enterprises, which helps to enrich relevant studies on the economic consequences of green innovation. Existing researches mainly focus on the effect of the investment in green innovation on enterprises’ performance (Russo and Pogutz, 2009; Amores-Salvadó et al., 2014; Hojnik and Ruzzier, 2016), stock prices (Stefan and Paul, 2008), and environmental performance (Carrión-Flores and Innes, 2010; Costantini et al., 2013; Weina et al., 2016; Ghisetti and Quatraro, 2017) while ignoring the impact of the investment in green innovation on corporate sustainable development. This study provides new empirical evidence for the important role of the investment in green innovation at the corporate level and expands the boundaries of relevant research on the economic consequences of green innovation.
Third, we verify the adjustment of CSR and scientific research ability on the relationship between the investment in green innovation and corporate sustainable development ability in this paper and provide empirical evidence for the role of social responsibility and technological innovation in the development of corporate governance. The research findings help the listed companies to improve the corporate reputation evaluation mechanism and establish a more perfect scientific research incentive system.
The structure of this study is arranged as follows: Section 2 presents the literature review and theoretical analysis. Section 3 offers the research design of this paper, including sample selection, variable measurement, and research design. In Section 4, the empirical results and analysis are presented, reporting the main test, robustness test, and further test results. The conclusion of this study is discussed in Section 5.
2 Literature Reviews and Theoretical Analysis
2.1 Literature Reviews
Green innovation is an innovation composed of new or improved products, processes, services, and management. Managers of firms have realized that green innovation is an important factor in sustainable development and that it can offer a competitive advantage (Song and Yu, 2018). Different from traditional innovation, green innovation emphasizes the use of new technologies and new concepts to achieve efficient use of resources and effective reduction of pollution while obtaining corresponding economic performance (Wang and Li, 2019). Green innovation is increasingly regarded as an important strategy for companies to gain sustainable competitive advantage in a new arena (Zhu et al., 2012; Fernando et al., 2019). Chen states that green innovation is the innovation of the products and production process of enterprises and divides green innovation into active and passive (Chen et al., 2012). Most scholars divide green innovation into two types: green product innovation and green process innovation according to the object of green innovation (Chen, 2008; Wu, 2013).
The concept of sustainable development originates from ecology and is subsequently applied in the fields of economics and sociology; these two aspects of sustainable development are more emphasized. Economic sustainability refers to making enterprises more efficient and effective, so that they can continue to remain competitive in the market (Baumgartner and Ebner, 2010). In other words, the sustainable growth strategy of the economy should allow companies to survive for a long time and bring positive effects to stakeholders, the country, and even the world. Regarding the environment, some scholars have demonstrated that environmental sustainability is an important part of the entire sustainable development (Montiel, 2008; Stubbs and Cocklin, 2008; Li, 2013). Environmental sustainability mainly deals with some environmental challenges, such as preventing pollution and protecting ecological balance (Stubbs and Cocklin, 2008). Environmental considerations have attracted the attention of more and more stakeholders, gradually covering the research area of economics, society, culture, technology, and natural environment. Later, some scholars combine sustainable development with corporate governance and point that sustainable development of enterprises is an ecological concept with economic meaning, mainly including fairness, sustainability, and commonality. Edward Freeman and Evan (1990) state that the sustainable development of enterprises should not only cover the current operating goals and the realization of net profits but also include the long-term consolidation of market position and the sustainable growth of net profits. Ahmad (2015) argues that the sustainable development ability of enterprises includes three aspects: economic sustainability, environmental sustainability, and social sustainability.
Furthermore, some scholars explore the factors that influence the sustainable development ability of enterprises. Barney (1991) establishes four indexes, namely, advantage value, rareness, limit ability, and substitutability, and finds that strategic resources improve the corporate sustainable development ability. In addition, on the basis of the RBV (resource-based view), Mata et al. (1995) analyzes four information technology (IT) attributes that can strengthen an enterprise’s sustainable development ability, namely, capital requirements, proprietary technology, technical IT skills, and managerial IT skills. The study of Wu (2013) shows that green supply chain management is a key driver for enterprises to achieve sustainable development. Wang and Han (2016) find that CSR fulfillment can improve the level of sustainable development of enterprises. In addition, the better the quality of internal control, the higher the level of sustainable development. According to the survey of 214 executives and IT managers of China’s auto industry suppliers, Tao et al. (2017) find that IT capability has a positive effect on the corporate sustainable development ability, and active environmental management plays a partial mediation effect between the relationship of the IT ability and the corporate sustainable development ability. Su et al. (2017) explore the relationship between social networks and the sustainable development of commercial banks’ microfinance based on 316 questionnaires targeted at bank outlets and find that the network type and the nature of network relationships are conducive to promoting the sustainable development of microfinance. The research of Wu and Zhang (2017) shows that public welfare donations can promote the sustainable development of enterprises, whereas accounting conservatism weakens the positive correlation between public welfare donations and the sustainable development of enterprises. Taking the Chinese A-share listed companies from 2012 to 2016 as samples, Yang et al. (2018) find that the improvement of internal control quality can enhance the enterprise’s sustainable development ability, whereas the management capacity can strengthen the role of internal control quality in enhancing the enterprise’s sustainable development ability. The research of Jin (2019) shows that heterogeneity of debts improves the sustainable development ability of enterprises. Further research results show that operating liabilities are more conducive to the sustainable development of enterprises than financial liabilities. On the basis of 400 questionnaires aimed at executives of the listed companies, Ren et al. (2020) find that the CEO’s humble leadership behavior not only can improve the performance of start-up enterprises but also can enhance the long-term sustainable development ability of enterprises.
Above all, studies show that the sustainable development ability of enterprises is affected by green supply chain management (Wu, 2013), debt heterogeneity (Jin, 2019), public welfare donations (Wu and Zhang, 2017), and other factors. However, existing studies pay less attention to the impact of green innovation, which tends to be an important enterprises’ investment activity, on sustainable development ability. Taking green innovation as the entry point, this paper explores the influence of enterprises’ innovation investment on the sustainable development ability and provides a new research perspective for the relevant research on the influencing factors of the corporate sustainable development ability Table 1 summarizes the relevant literature reviews.
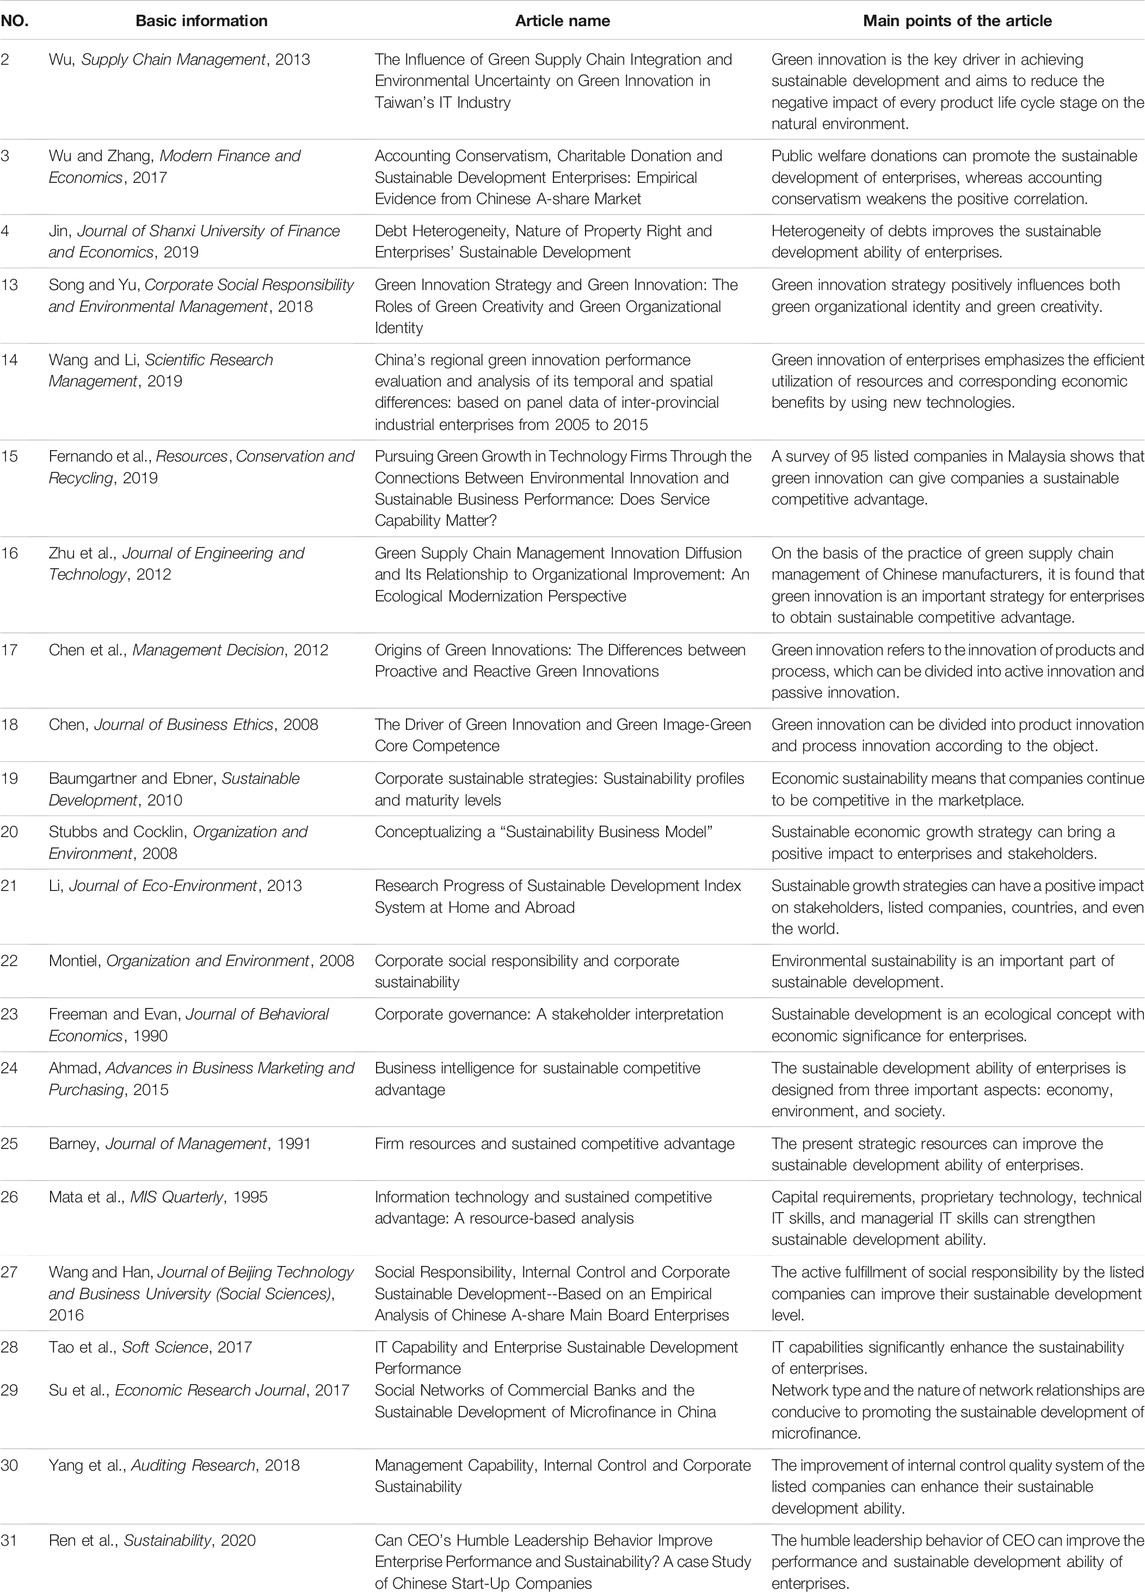
TABLE 1. Literature summary.
2.2 Theoretical Analysis
Corporate sustainable development means that enterprises can ensure the sustainability of profitability and competitive advantage in the process of pursuing business objectives. In practice, the improvement of sustainable development ability of enterprises depends on the steady investment income, reliable solvency, strong profitability, and excellent management ability. In the context of increasingly fierce global economic competition, enterprises are facing more and more challenges. As an important way to improve the core competitiveness of enterprises, the importance of innovation is becoming increasingly prominent at this time. Previous studies have shown that innovation is the fundamental reason for enterprises to maintain competitive advantage, consolidate market-dominant position, and realize sustainable growth of net profit in a complex dynamic environment (Aghion et al., 2005; Chang et al., 2015). Among the numerous means of corporate innovation, green innovation has unique advantages that cannot be matched by other traditional means of innovation and show as an effective way to consolidate the advantages of corporate development because of its dual externalities of environment and innovation (Rennings, 2000). Hence, we argue that green innovation can affect the sustainable development ability of enterprises through the following two ways.
First of all, green innovation shows that enterprises take the initiative to assume social responsibility, which is conducive to improving the relationship between enterprises and stakeholders and improving the corporate reputation. Therefore, green innovation can help enterprises to gain more market share and improve their sustainable development ability. The research of Eiadat et al. (2008) shows that the implementation of green innovation strategy reduces the waste and pollution in the production process of enterprises, which contributes to the enterprises obtaining good social reputation and strengthening the competitiveness of enterprises. The research of Marom (2006) shows that green innovation is a responsible behavior of managers, which can improve the relationship between enterprises and stakeholders and bring long-term intangible value to enterprises. This long-term intangible value, in turn, will strengthen the enterprise’s competitive advantage. Therefore, enterprises who carry out the strategy of green innovation, which is beneficial to integrate the interests of the relevant parties, help to improve the corporate reputation and the relationship with stakeholders (Sharma and Vredenburg, 1998), gain higher social recognition and legitimacy (Fombrun and Shanley, 1990), then expand market share (Jin, 2006), and improve the ability of sustainable development.
Second, green innovation can improve the production process and the utilization of resources and thus promote the sustainable development ability of enterprises. Porter and Linde (1995) find that green innovation can transform pollutants into marketable products, improve resource utilization, and create additional benefits for enterprises. Banerjee (2001) finds that a green innovation strategy can improve the enterprises’ ability to deal with the uncertainty of operation and ecological problems, which contributes to the enterprises’ improvement of the production process and development of environmental protection products, thereby improving their core competitiveness. Therefore, due to its dual externality of environment and innovation, green innovation has unique advantages that cannot be matched by other traditional innovation methods (Rennings, 2000), which can help enterprises reduce resource use and energy consumption (Huang et al., 2015), and thus effectively improve resource utilization rate and strengthening the ability of sustainable development. On the basis of the above, the first hypothesis is as follows:
H1: The output of green innovation can significantly enhance the corporate sustainable development ability.
According to the above analysis, green innovation can significantly enhance the reputation of enterprises and thus improve the ability of sustainable development. Previous studies have shown that the corporate reputation is affected not only by green innovation but also by the CSR performance (Lee and Faff, 2010; Cheng et al., 2014). The study of Godfrey et al. (2009) shows that the good performance of enterprises in social responsibility can form reputational capital, and the existence of reputational capital makes investors believe that enterprises can better cope with adverse events. Therefore, when the CSR performance is better, the corporate reputation level is already high. At this point, green innovation has little space to improve the reputation of enterprises and thus enhance the ability of sustainable development. The impact of green innovation on the sustainable development ability of enterprises may be weak. On the contrary, when the CSR performance is poor, there is more space for green innovation to improve the reputation of enterprises. At this time, green creativity plays a more powerful role in improving the corporate reputation and thus having a more significant impact on the sustainable development ability of enterprises. On the basis of the above analysis, the second hypothesis is as follows:
H2: The promotion effect of green innovation output on the sustainable development ability is more significant when CSR performance is poor.
According to the above analysis, green innovation can significantly improve the utilization rate of resources and thus improve the ability of sustainable development. Previous studies have shown that resource utilization is affected not only by green innovation but also by enterprises’ scientific research ability (Wu and Zhang, 2015). The study of Wu and Deng (2019) shows that the improvement of scientific research ability can optimize resource allocation and realize efficient utilization of resources. Therefore, when the scientific research ability is better, the resource utilization rate of the enterprise is already high. At this point, green innovation has little space to improve the resource utilization rate of enterprise and thus enhance the ability of sustainable development. The impact of green innovation on the sustainable development ability of enterprises may be weak. On the contrary, when the scientific research ability is limited, there are higher potential for the improvement of the resource utilization ratio. In the meantime, green innovation has a stronger effect on the improvement of resource utilization and thus has a significant impact on the sustainable development ability of enterprises. On the basis of the above analysis, the third hypothesis is as follows:
H3: The promotion effect of green innovation output on the corporate sustainable development ability is more significant when scientific research ability is limited.
Figure 1 illustrates the assumptions and analysis framework presented in this study. H1 discusses the impact of green innovation on the sustainable development ability of enterprises. In addition, in H2 and H3, grouping research is used to test the moderating effect of the CSR and scientific research ability on the relationship between green innovation and the sustainable development ability of enterprises.
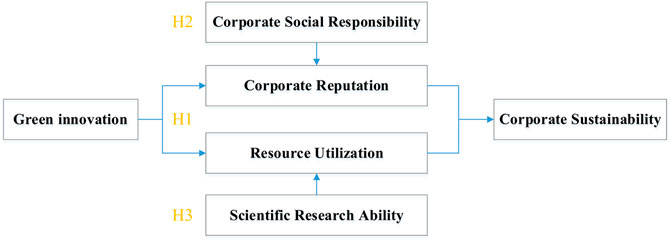
FIGURE 1. Hypotheses and analytical framework.
3 Sample Selection, Variable Measurement, and Research Design
3.1 Sample Selection
This study selects the Chinese A-share listed companies from 2010 to 2018 as the research subject. The reason for choosing 2010 as the starting point of the sample is that the social responsibility assessment system of HeXun has been published since 2010. In addition, 2018 is the latest data year available at the beginning of the study. The data of green innovation refers to the number of green innovation patents, which is manually collected and sorted from the website of the National Intellectual Property Administration in accordance with the IPC classification number listed in the “Green List of International Patent Classification” and the name of the listed companies. The International Patent Classification Green List was launched by the World Intellectual Property Organization (WIPO) in 2010, which makes it easy for users to access the information of patents related to environment-friendly technologies. The other data used in this article come from the WIND database and the CSMAR database.
In the process of sample selection, we conduct as follows: 1) Samples of the financial industry are excluded and 2) samples with incomplete data are eliminated. On the basis of the above criteria, 19,390 firm annual data are finally obtained in this paper. To eliminate the influence of outliers on the regression results, we winsorize all the continuous variables at the 1% and 99% levels. All standard errors of regression are clustered at the industry level. The data processing in this study are carried out using Stata 15 econometric analysis software.
3.2 Variable Definitions
3.2.1 Dependent Variable
The sustainable development ability of enterprises refers to the long-term profitability and lasting competitiveness. On the basis of the study of Yang et al. (2018), we build a sustainable growth ratio (SGR) to measure the sustainable development ability of the listed companies according to James C. Van Horne’s static model. The calculation formula of the SGR index is
In addition, this study draws on the research of Jin (2019) and comprehensively considers the rights and interests of shareholders and creditors, to thoroughly reflect the sustainable development ability of enterprises. The calculation formula of the SUS index is
3.2.2 Independent Variable
Drawing on the existing studies (Xu and Wang, 2018; Lu and Bai, 2020; Wang and Hu, 2020). In this study, the natural logarithm of one plus the number of patents authorized in t−1 year to measure the output of green innovation.
3.2.3 Moderating Variables
Corporate social responsibility (CSRDUM). Drawing on existing studies (Jia and Liu, 2014; Wen and Song, 2017), this study selects the data of the HeXun listed companies’ CSR assessment system and uses the CSR score to measure the overall performance of the listed companies’ CSR. Furthermore, if the social responsibility score is greater than the median, the value of CSRDUM is 1; otherwise, it is 0.
Scientific research ability (HIGHTECH). Drawing on existing studies (Hall et al., 2005; Li et al., 2012; Lu and Dang, 2014), we divide the following six industries in the industry classification table of China Securities Regulatory Commission into high-tech industries: ① petrochemical and plastic industries; ② electronic industry; ③ metal and non-metal industries; ④ machinery, equipment, and instrument industries; ⑤ pharmaceutical and biological industries; and ⑥ IT industry. Furthermore, if the company belongs to one of the above six high-tech industries, then the value of HIGHTECH is 1; otherwise, it is 0.
3.2.4 Control Variables
We also choose a series of factors that may affect an enterprise’s development ability as control variables, which mainly including the scale of companies (SIZE), the profitability (ROA), the financial leverage (LEV), the stock of cash (CASH), the Tobin Q (TOBIN Q), the growth ability (GROWTH), the scale of the Board (BOARD), the scale of the Board of Supervisors (SUPERVISORS), the proportion of independent directors (INDEP), the degree of ownership concentration (TOP1), the executive compensation (SALARY), the duality of CEO (DUAL), the listed years (AGE), the nature of the property (SOE), the characteristics of auditors (BIG4), and the audit opinion (OPINION). Table 2 provides a detailed description of the relevant variables.
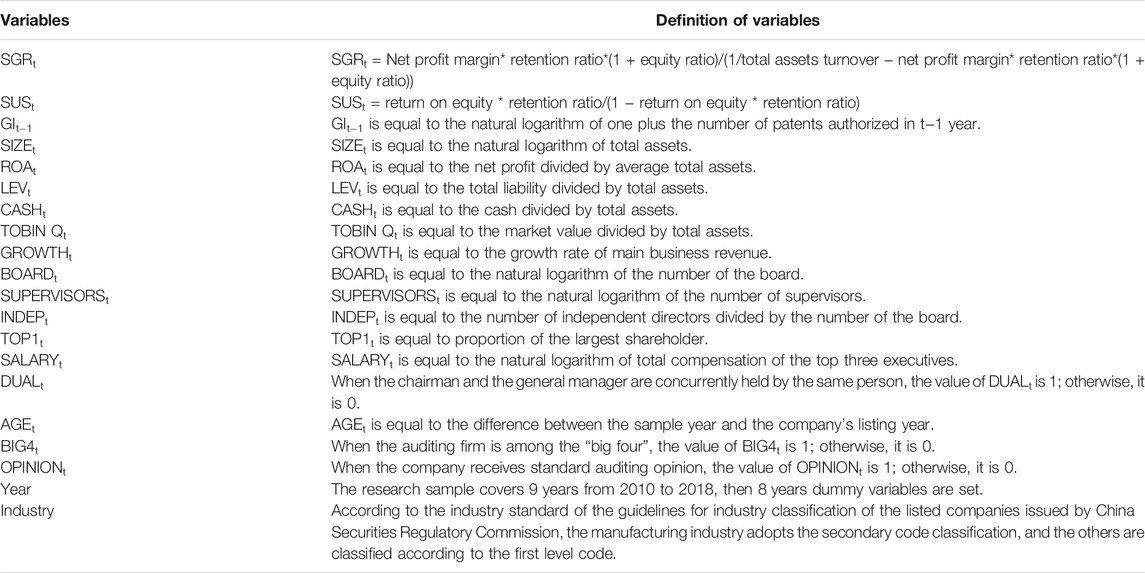
TABLE 2. Variable definitions.
3.3 Empirical Models
On the basis of previous studies (Bhandari et al., 2017; Mccarthy et al., 2017; Ali et al., 2019; Baskentli et al., 2019; Sun et al., 2020a; Sun et al., 2020b; Zhang et al., 2021), we establish Equation 3 and used OLS regression method to investigate the impact of green innovation on the corporate sustainable development ability.
4 Results and Discussions
4.1 Descriptive Statistics
We present summary statistics in Table 3. The SD of SGRt and SUSt are 0.0686 and 0.0690, respectively, suggesting that there exist great differences between SGRt and SUSt in different samples. The maximum value of GIt−1 is 3.1355, the median value is 0, and the SD is 0.8147, indicating that there are significant differences in the number of green innovation patents authorized among different enterprises. The mean value of CSRDUMt is 0.4672, indicating that the mean CSR of 46.72% of the samples is greater than the median. The mean value of HIGHTECHt is 0.4634, indicating that 46.34% of the samples are high-tech enterprises. The mean value of SIZEt is 22.1379, which indicates that the average total assets of sample companies are 4.11498 billion yuan (e2.1379−1). The mean value of ROAt turns out to be only 0.0343, indicating that the profit performance of sample companies is generally poor. The mean value of BIG4t is 0.0570, suggesting that 5.7% of the sample companies select the “big four” accounting firms as auditors. Table 3 also reports descriptive analysis results for other variables.
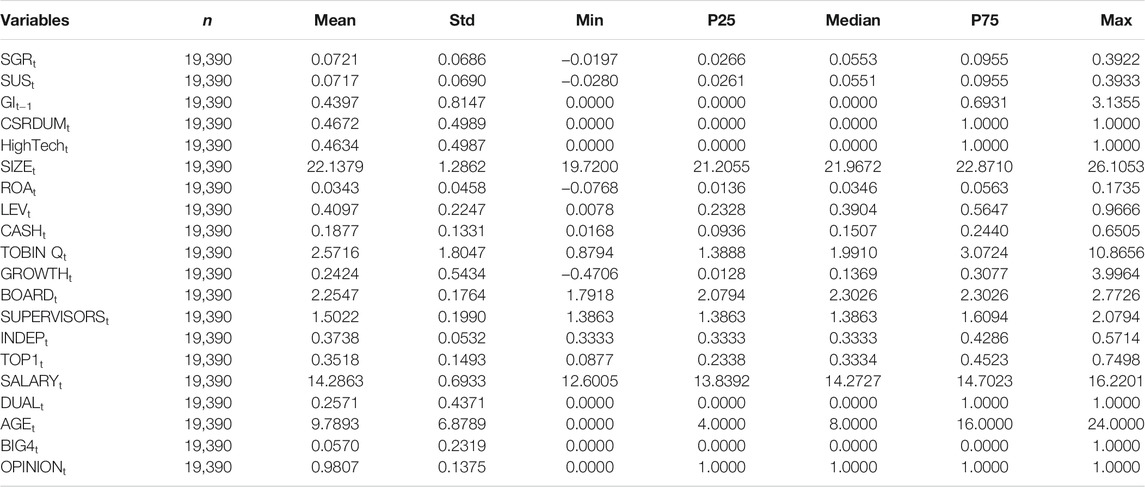
TABLE 3. Descriptive statistics.
4.2 Correlation Test
Table 4 shows the Pearson correlation between major variables. The correlation analysis shows that GIt−1 is consistent with SGRt/SUSt at 1% level. The above results indicate that there is a significant positive correlation between green innovation and corporate sustainable development ability in the univariate influencing factors, which preliminarily verifies the research hypothesis of this study. In addition, except for the two explained variables SGRt and SUSt, the maximum correlation coefficient is no more than 0.7. Therefore, there is no multicollinearity problem in this model.
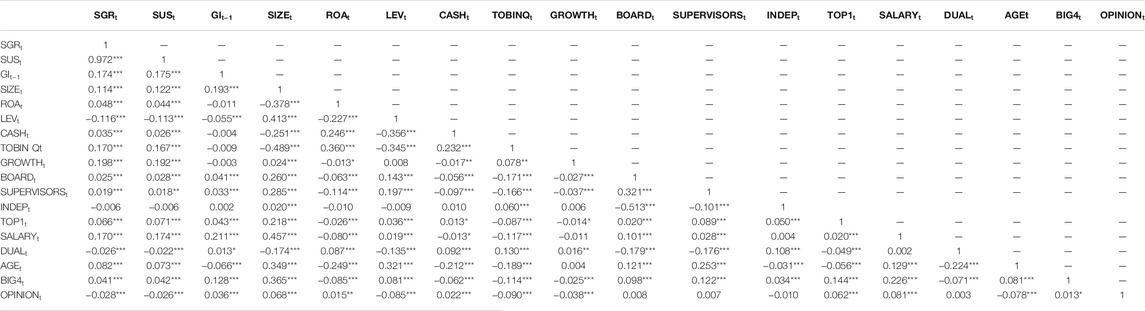
TABLE 4. Correlation analysis of variables.
4.3 Results and Discussions
4.3.1 Green Innovation and Sustainable Development Ability
Table 5 presents the results of the impact of green innovations on corporate sustainability. SGRt is taken as the explained variable in column (1), whereas SUSt is taken as the explained variable in column (2). According to columns (1) and (2), the coefficient of GIt−1 is significantly positive at the 1% statistical level. The above information indicates that GIt−1 (which representing green innovation) presents a positive statistical relationship with SGRt/SUSt (which representing enterprise sustainable development ability). That is, green innovation output of enterprises can significantly improve the ability of sustainable development in the next phase. This results indicates that the hypothesis H1 proposed in the research hypothesis part of this paper has been verified by the empirical analysis of a large sample.
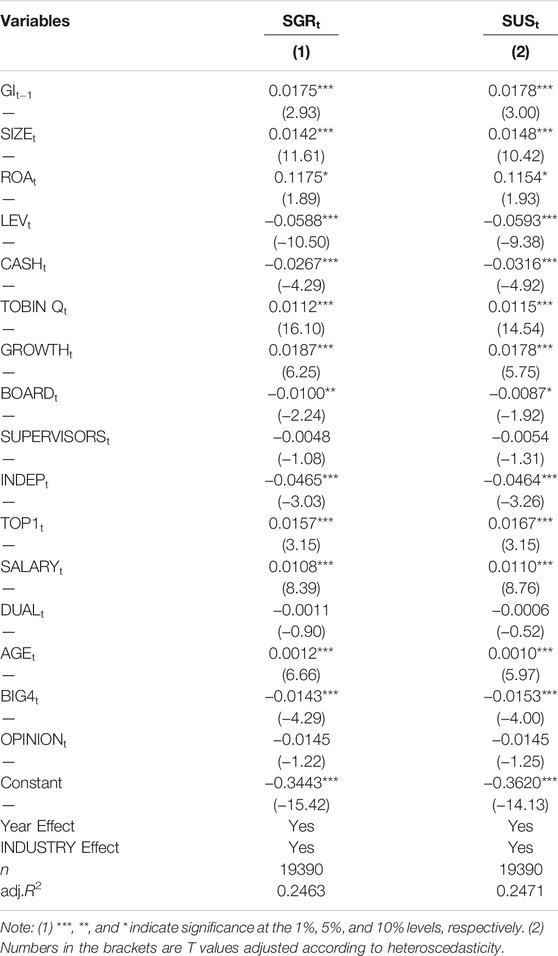
TABLE 5. The impact of green innovation on sustainable development ability.
Among the control variables, regression coefficients of SIZEt, ROAt, TOBIN Qt, GROWTHt, TOP1t, SALARYt, and AGEt is significantly positive, which means a larger scale of asset, greater profitability, higher enterprises’ value, better growth ability, higher shareholding ratio of the largest shareholder, higher pay of the top three executives, and longer listing time are associated with higher corporate sustainable development ability. The regression coefficients of LEVt, CASHt, BOARDt, INDEPt,, and BIG4t are significantly negative, indicating that weaker debt-paying ability, higher cash holding rate, the bigger board size, a higher proportion of independent directors, and hiring the big four firms as auditors are associated with higher corporate sustainable development ability.
4.3.2 Green Innovation, Corporate Social Responsibility, and Sustainable Development Ability
Research hypothesis H2 explores the impact of CSR on the relationship between green innovation and corporate sustainable development. On the basis of the CSR score, we divide the whole sample into a high CSR group and a low CSR group and use model (1) for the grouping test. Table 6 shows the regression results. Columns (1) and (3) test the group with high social responsibility and find that the coefficient of GIt−1 is not significant whatever SGRt or SUSt is taken as the explained variable. The above information indicates that GIt−1 (which representing green innovation) has no correlation with SGRt/SUSt (which representing enterprise sustainable development ability) in the group with high social responsibility. In other words, when CSR performance is better, the impact of green innovation on enhancing the corporate reputation rate and thus improving sustainable development ability is relatively limited. Columns (2) and (4) test the group with low social responsibility and find that the coefficient of GIt−1 is significantly positive at the statistical level of 1% whether SGRt or SUSt is taken as the explained variable. The above information indicates that GIt−1 (which representing green innovation) presents a positive statistical relationship with SGRt/SUSt (which representing enterprise sustainable development ability) in the group with low social responsibility. The cross-model coefficient difference test shows significance at the level of 1% as well. That is, when the performance of CSR is poor, green innovation has a strong influence on improving the reputation of enterprises and thus improving the corporate sustainable development ability. The above research findings verify hypothesis H2 in the research hypothesis part of this paper.
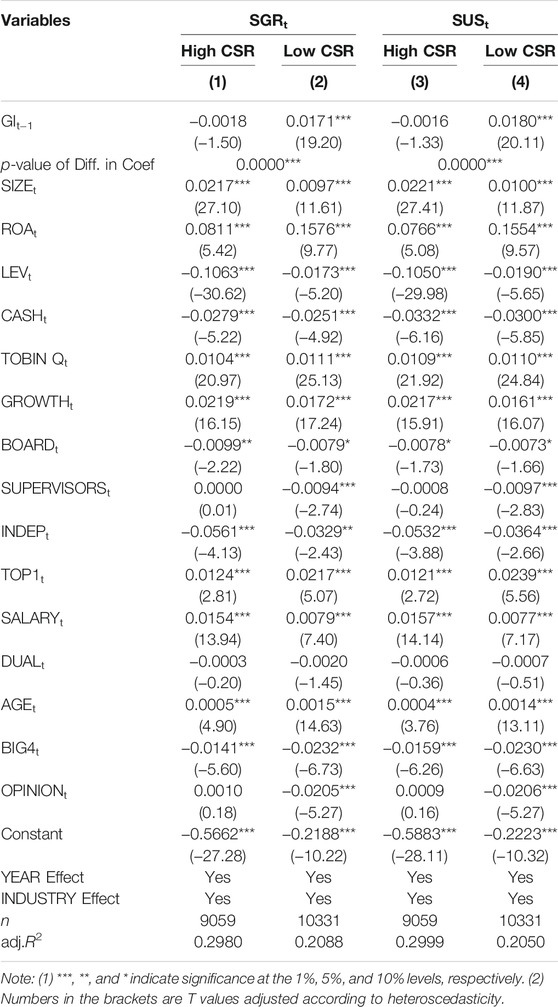
TABLE 6. Green innovation, corporate social responsibility, and sustainable development ability.
4.3.3 Greeninnovation, Scientific Research Ability, and Sustainable Development Ability
Research hypothesis H3 explores the impact of scientific research ability on the relationship between green innovation and sustainable development. According to the classification of whether it is a high-tech enterprise or not, we divide the whole sample into high-tech enterprise group and non–high-tech enterprise group respectively and use model (1) for grouping test. Table 7 shows the regression results. Columns (1) and (3) test the high-tech enterprise group and find that the coefficient of GIt−1 is not significant whether SGRt or SUSt is used as the explained variable. The above information indicates that GIt−1 (which representing green innovation) has no correlation with SGRt/SUSt (which representing enterprise sustainable development ability) in the high-tech enterprise group. In other words, when the company is a high-tech enterprise, it is more difficult for green innovation to improve the resource utilization rate and thus improve sustainable development ability. Columns (2) and (4) test non–high-tech enterprises and find that the coefficient of GIt−1 is significantly positive at the statistical level of 1% whether SGRt or SUSt is used as the explained variable. The above information indicates that GIt−1 (which representing green innovation) presents a positive statistical relationship with SGRt/SUSt (which representing enterprise sustainable development ability) in the non–high-tech enterprise group. The cross-model coefficient difference test shows significance at the level of 1% as well. That is, when the company is a non–high-tech enterprise, green innovation can improve the utilization rate of resources and thus improve the ability of sustainable development. The above research findings verify hypothesis H3 in the research hypothesis part of this paper.
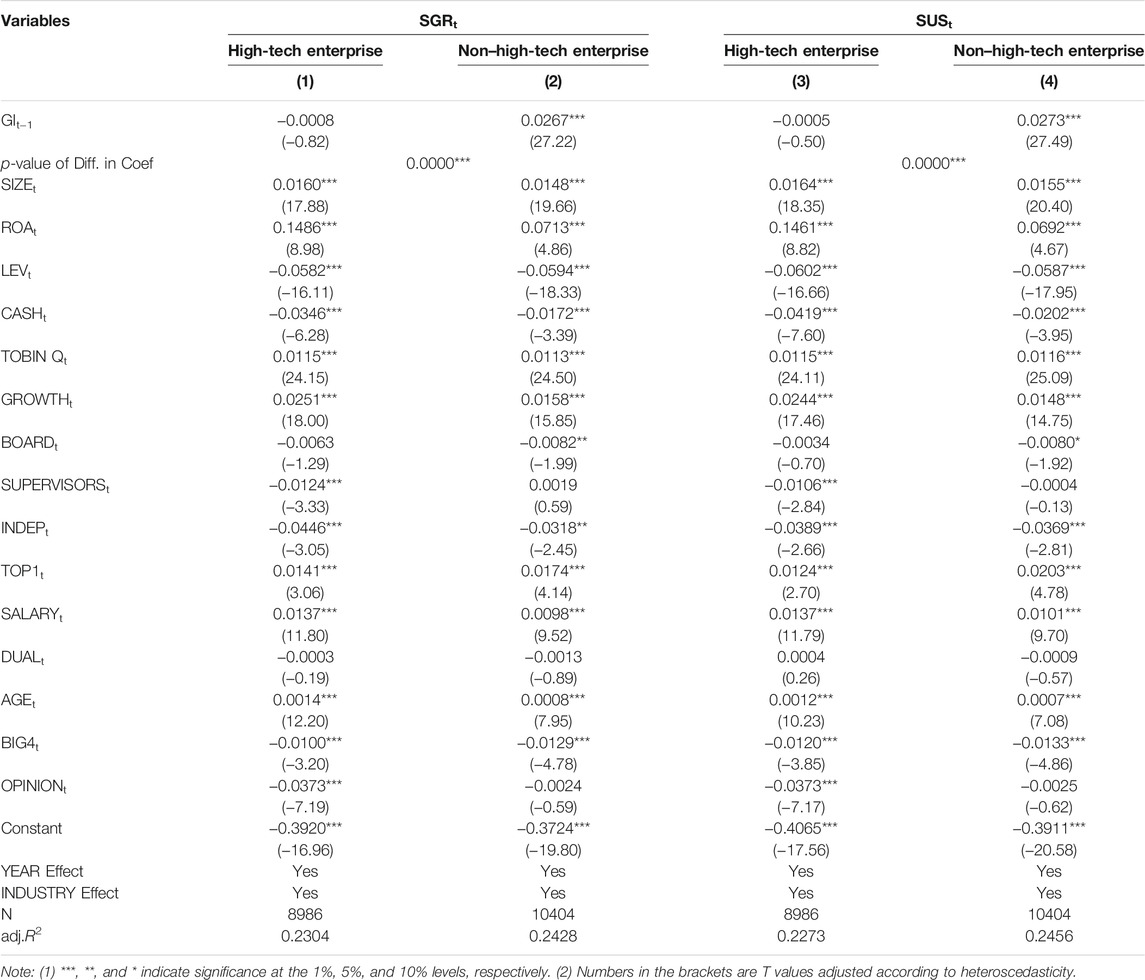
TABLE 7. Green innovation, scientific research ability, and sustainable development ability.
4.4 Robustness Test
4.4.1 PSM Procedure
In this paper, three ways are used to test robustness. Firstly, we adopt the one-to-one PSM method to solve the potential endogeneity problems. Referring to previous researches (Khan et al., 2013; Giannetti et al., 2015; Wu et al., 2020), we set the samples with more than one authorized number of green innovation patents as the experimental group and set the samples with the authorized number of green innovation patents equal to 0 as the control group. The Probit regression method is then used to calculate the propensity score of each control group sample, and a control group sample with the closest probability is matched for each test group sample. Finally, all the 5,139 control group samples in this paper are successfully matched. Then, we the matched samples and the corresponding paired samples are combined and obtain 10,278 samples in the end.
Table 8 lists the regression results of the paired samples by the propensity score matching method. The regression results show that, when SGRt or SUSt is used as the explained variable, the coefficient of GIt−1 is significantly positive at the statistical level of 1%, which is consistent with the test results above, and the original regression results are robust.
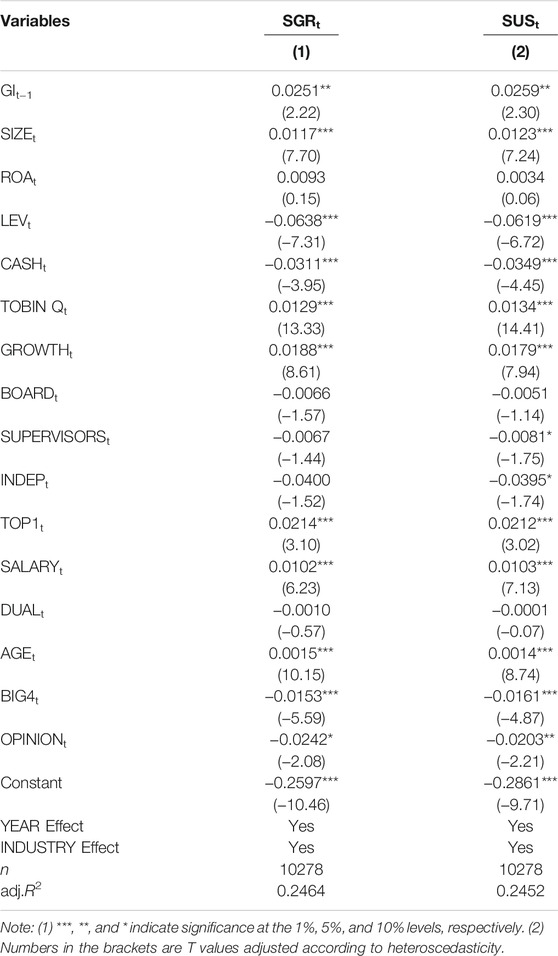
TABLE 8. Endogeneity examination PSM procedure.
4.4.2 Two-Stage Least Square Regression
We mainly study the impact of green innovation on the sustainable development ability of enterprises in this study, but enterprises with better sustainable development ability are more capable and motivated to carry out green innovation. To solve the problem of reverse causation, we use the two-stage least square method to conduct the endogeneity test.
Drawing on the research of Meng et al. (2019), we select the unemployment rate of the city where the enterprise is located (Unemploymentt) and the number of “985 Project” universities in the province where the enterprise is located (Academict) as instrumental variables. From the perspective of correlation, the higher the unemployment rate, the weaker the innovation ability and the lower the willingness of enterprises to carry out green innovation. “Project 985” universities are the 39 universities with the strongest comprehensive scientific research ability in China. The more “985 Project” universities in the province, the better the scientific research foundation and environment in the region and the higher the willingness of enterprises to carry out green innovation. From the perspective of externality, there is no obvious logical relationship between the regional unemployment rate or the number of regional “985 projects” colleges and the sustainable development ability of a single enterprise. The test results of instrumental variable correlation and homogeneity also support the above conclusions in this paper. Specifically, as shown in Table 9, on the one hand, the test of weak instrumental variables shows that partial R2 is 0.0000, and the F statistic is equal to 91.0423, exceeding the threshold value of 10. Therefore, there is no evidence that Unemploymentt and Academict are weak instrumental variables. On the other hand, neither Sargan χ2 nor Baumann χ2 is significant at the 1% level. Therefore, there is no evidence that the instrumental variables of Unemploymentt and Academict have the problem of over-identification.
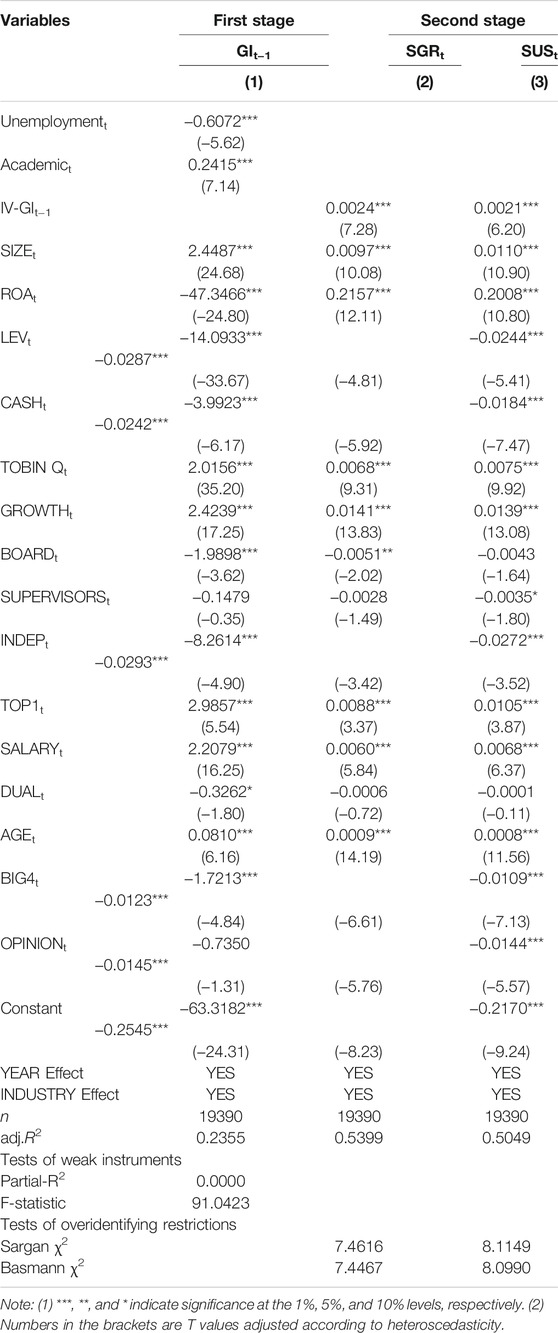
TABLE 9. Endogeneity examination using two-stage least square regression.
The test results of the two-stage least square method of instrumental variables are shown in Table 9. In the first stage, two instrumental variables are respectively regressed to green innovation (GIt−1). It can be seen that the unemployment rate of the city where the enterprise is located is negatively correlated with green innovation, whereas the number of “985 Project” universities is positively correlated with green innovation, which conforms to the realistic situation. In the second stage, the fitting value of green innovation is returned to SGRt and SUSt. After the endogeneity problem was controlled, the coefficient of IV-GIt−1 is significantly positive at the level of 1%, consistent with the previous conclusion. The above results show that the impact of green innovation on the sustainable development ability of enterprises is less influenced by endogeneity.
4.4.3 Substitution of Green Innovation
In the previous study, green patent authorized is used to measure green innovation. In the robustness test, we use green patent applications (GI_Applicationt−1) to measure green innovation. Specifically, GI_Applicationt−1 is the natural logarithm of one plus the number of green patent applications. Regression results in Table 10 show that the coefficient of GI_Applicationt−1 is significantly positive at the statistical level of 1% whatever SGRt or SUSt is used as the explained variable. The result of hypothesis H1 remains robust.
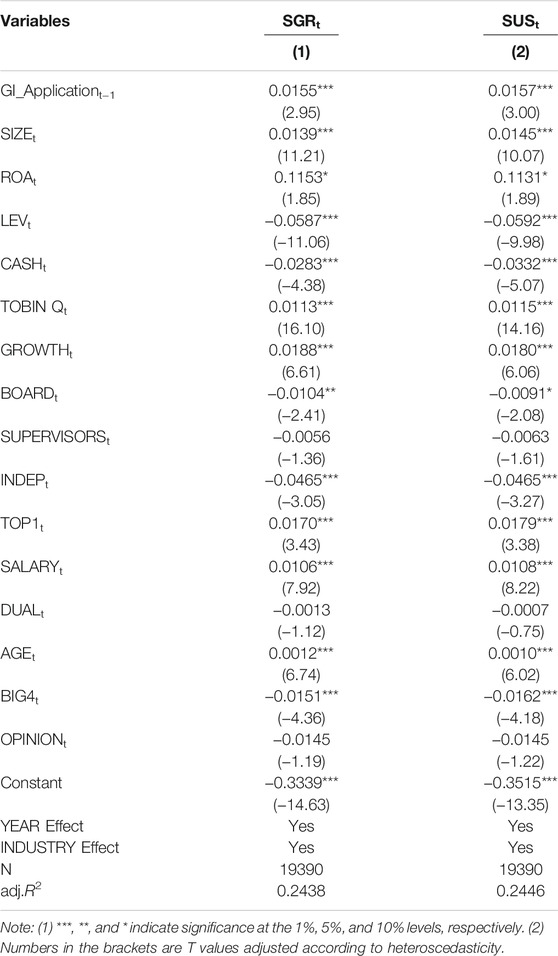
TABLE 10. Using the substitution of green innovation (hypothesis H1).
In columns (1) and (3) of Table 11, the high social responsibility group is tested, and it is found that the coefficient of GI_ Applicationt−1 is not significant no matter SGRt or SUSt is used as the explained variable. In columns (2) and (4) of Table 9, the high social responsibility group is tested, and it is found that the coefficient of GI_ Applicationt−1 is significantly positive at the statistical level of 1% no matter SGRt or SUSt is taken as the explained variable. The cross-model coefficient difference test is significant at the level of 1% as well. The above studies show that hypothesis H2 remains robust.
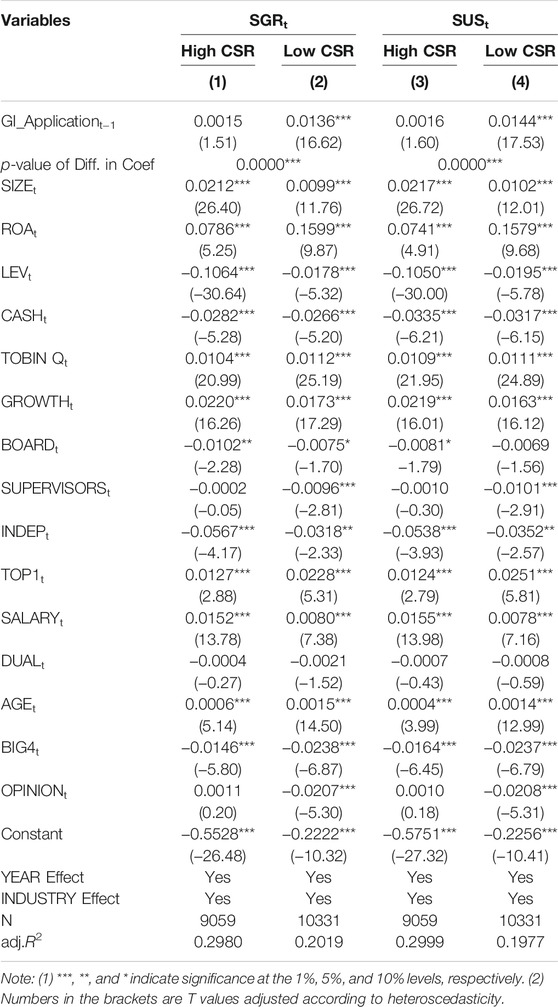
TABLE 11. Using the substitution of green innovation (hypothesis H2).
In columns (1) and (3) of Table 12, the high-tech enterprise group is tested, and we find that the coefficient of GI_ Applicationt−1 is not significant whether SGRt or SUSt is used as the explained variable. We test non–high-tech enterprises in columns (2) and (4) of Table 9 and find that no matter SGRt or SUSt is used as explained variables, the coefficient of GI_ Applicationt−1 is significantly positive at the statistical level of 1%. The cross-model coefficient difference test is significant at the level of 1%. The above studies indicate that hypothesis H3 remains robust.
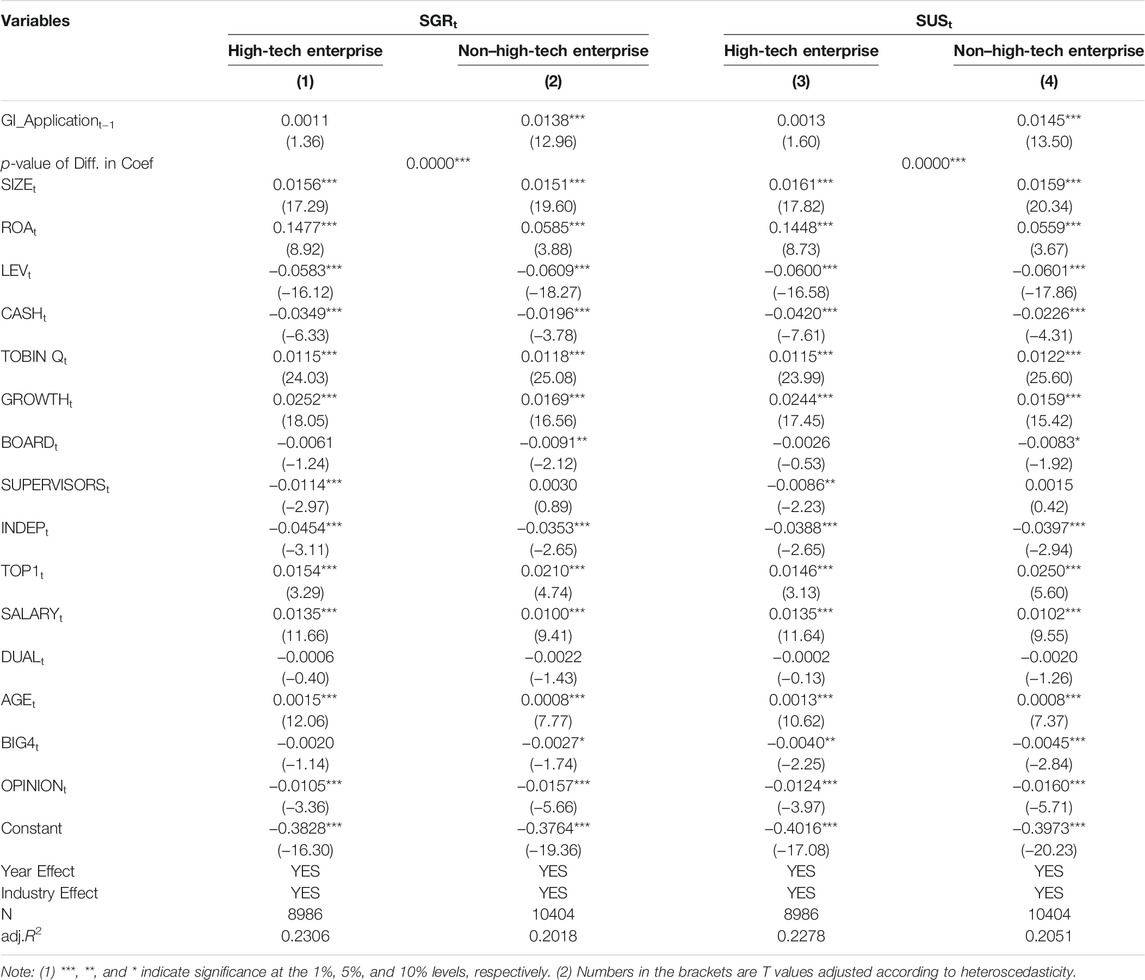
TABLE 12. Using the substitution of green innovation (hypothesis H3).
4.5 Further Test
4.5.1 Heterogeneity Analysis of Different Property Rights
Under the special institutional background of China, the relevant researches at the micro-level of enterprises need to consider the differences brought by the nature of property rights. Therefore, we further analyze the impact of property difference on the relationship between green innovation and the sustainable development ability of enterprises. According to the previous analysis, green innovation can improve the reputation of enterprises and enhance the efficiency of resource utilization, thus improving the ability of sustainable development. Previous studies have shown that, compared with non–state-owned enterprises, state-owned enterprises usually have a higher reputation (Tan, 2017) and better scientific research ability (Xiao et al., 2013). Therefore, we point out that, when the enterprise is state-owned, there is less space for green innovation to improve the reputation of the enterprise and strengthen the scientific research ability, which makes it more difficult to improve the ability of sustainable development. On the contrary, when the enterprise is non–state-owned, green innovation can help to improve its reputation and strengthen its scientific research ability, to significantly improve its ability of sustainable development.
Columns (1) and (3) of Table 13 test the state-owned enterprise group and find that the coefficient of GIt−1 is not significant whether SGRt or SUSt is taken as the explained variable. Columns (2) and (4) of Table 13 test the non–state-owned enterprise group and find that the coefficient of GIt−1 is significantly positive at the statistical level of 1% whether SGRt or SUSt is taken as the explained variable. The cross-model coefficient difference test is significant at the level of 1%. The above results indicate that, compared with state-owned enterprises, green innovation plays a more significant role in enhancing the ability of sustainable development in non–state-owned enterprises.
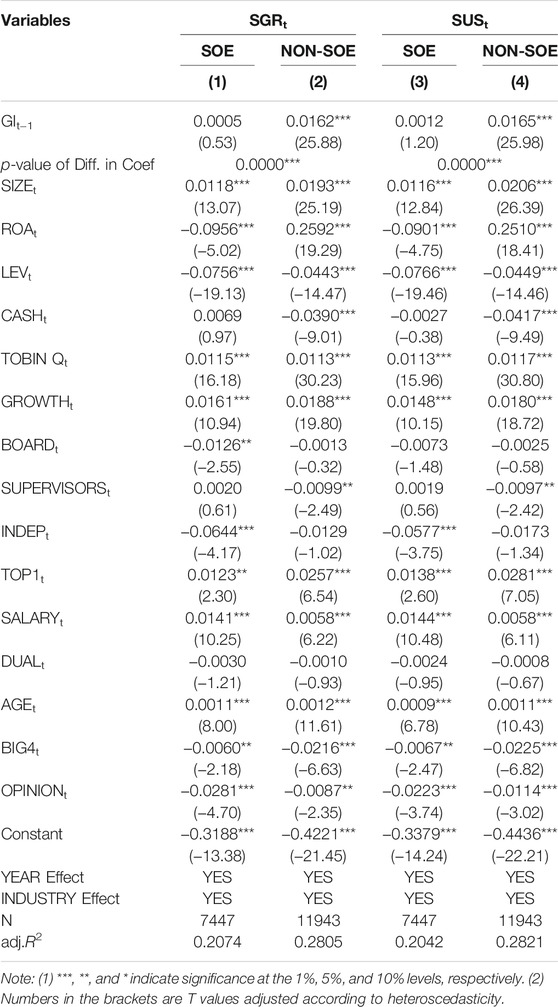
TABLE 13. Green innovation, property right nature and sustainable development of enterprises.
4.5.2 Heterogeneity Analysis of Different Types of Green Innovation
The previous study finds that the output of green innovation significantly improves the sustainable development ability of enterprises. At present, the patent is divided into invention patent, utility model patent, and appearance design patent in China. Invention patent relates to the new product’s manufacturing and application method, utility model patent relates to the technical improvement and product reconstruction, and appearance design patent only relates to the design of product appearance and pattern. Existing studies have suggested that only invention patents can reflect the technological innovation level of enterprises, whereas utility model patents and appearance design patents have a low correlation with technological innovation (Li and Zheng, 2016). Therefore, we construct the variables GI-INVENTIONt−1 and GI-OTHERt−1. GI-INVENTIONt−1 is the natural logarithm of one plus the number of green invention patents authorized. GI-OTHERt−1 is the natural logarithm of one plus the number of green utility model patents and green appearance patents authorized.
The results in columns (1) and (3) of Table 14 show that the coefficient of GI-INVENTIONt−1 is significantly positive at the 1% statistical level whether SGRt or SUSt is used as the explained variable. The results in columns (2) and (4) of Table 14 show that the coefficient of GI-OTHERt−1 is not significant whether SGRt or SUSt is taken as the explained variable. The above results show that only invention patents of green innovation can significantly improve the sustainable development ability of enterprises, whereas non-invention patents cannot affect the sustainable development ability of enterprises.
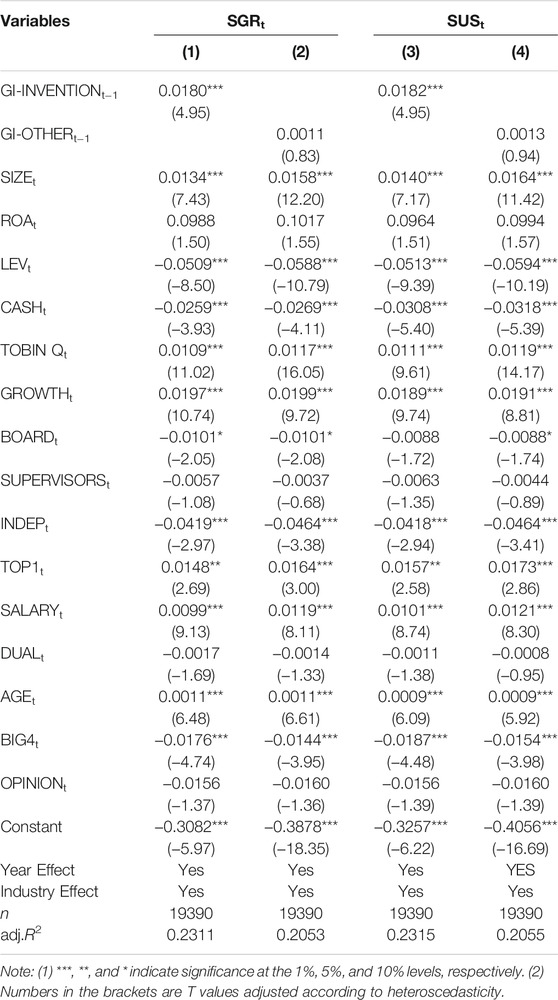
TABLE 14. Green innovation, type of innovation patent and sustainable development of enterprises.
5 Conclusions and Policy Implications
5.1 Conclusion
In recent years, China has stepped up the punishment for environmental pollution and advocated sustainable development vigorously. Under this background, exploring the impact of green innovation on the sustainable development ability of enterprises not only can expand the boundary of the research on the factors influencing the enterprises’ sustainable development ability and the economic consequences of green innovation but also can provide reference for the decision-making of the listed companies.
We take the Chinese A-share listed companies from 2010 to 2018 as the research subject and empirically test the impact of green innovation on the sustainable development ability of enterprises. The study finds the following: 1) green innovation significantly improves the sustainable development ability of enterprises; and 2) when the CSR performance is worse and scientific research ability is limited, green innovation plays a more significant role in improving the sustainable development ability of enterprises. The above results remain valid after the robustness test. In the further test, the study shows that compared with state-owned enterprises, the improvement of green innovation on sustainable development ability is more obvious in non–state-owned enterprises. In addition, only invention patents of green innovation can significantly improve the sustainable development ability of enterprises, whereas non-invention patents cannot affect the sustainable development ability of enterprises.
5.2 Policy Implications
The conclusions of this study have the following inspirations for enterprises and their managers: Firstly, the results of the above empirical test show that the output of green innovation significantly improves corporate sustainable development. Therefore, corporate managers are supposed to fully recognize the important role of green innovation. They should attach importance to the transformation of green innovation achievements and realize the sustainable development of enterprises through green innovation. Secondly, the previous study find that only invention patents of green innovation can significantly improve the corporate sustainable development ability, whereas non-invention patents cannot affect it. Therefore, among different types of innovation, enterprises can invest more in the R&D of invention patents, to effectively help improve the sustainable development ability of enterprises. Thirdly, the above empirical test results show that reputation incentive and research incentive can influence the relationship between green innovation and sustainable development ability of enterprises. Therefore, enterprises should improve the reputation evaluation mechanism and the incentive system of scientific research, strengthen the reputation among enterprises with the help of social responsibility, and effectively improve the ability of sustainable development with the help of scientific and technological innovation.
Data Availability Statement
The raw data supporting the conclusion of this article will be made available by the authors, without undue reservation.
Author Contributions
Conceptualization, YL and AW; Methodology, XQ; Software, PL; Validation, XQ and HS; Writing-Original Draft, YL and QS; Writing - Review and Editing, XQ, PL, and HS. All authors have read and agreed to the published version of the manuscript.
Funding
This research is supported by the National Natural Science Foundation of China (grant nos. 71572009 and 71872010).
Conflict of Interest
The authors declare that the research was conducted in the absence of any commercial or financial relationships that could be construed as a potential conflict of interest.
Publisher’s Note
All claims expressed in this article are solely those of the authors and do not necessarily represent those of their affiliated organizations or those of the publisher, the editors, and the reviewers. Any product that may be evaluated in this article, or claim that may be made by its manufacturer, is not guaranteed or endorsed by the publisher.
References
Aghion, P., Bloom, N., Blundell, R., Griffith, R., and Howitt, P. (2005). Competition and Innovation: An Inverted-U Relationship*. Q. J. Econ. 120 (2), 701–728. doi:10.1162/0033553053970214
Ahmad, A. (2015). Business Intelligence for Sustainable Competitive Advantage. Adv. Business Mark. Purch. 22, 3–220. doi:10.1108/s1069-096420150000022014
Ali, R., Sial, M. S., Brugni, T. V., Hwang, J., Khuong, N. V., and Khanh, T. H. T. (2019). Does CSR Moderate the Relationship between Corporate Governance and Chinese Firm's Financial Performance? Evidence from the Shanghai Stock Exchange (SSE) Firms. Sustainability 12 (1), 149. doi:10.3390/su12010149
Amores-Salvadó, J., Castro, G. M.-d., and Navas-López, J. E. (2014). Green Corporate Image: Moderating the Connection between Environmental Product Innovation and Firm Performance. J. Clean. Prod. 83, 356–365. doi:10.1016/j.jclepro.2014.07.059
Banerjee, S. B. (2001). Managerial Perceptions of Corporate Environmentalism: Interpretations from Industry and Strategic Implications for Organizations. J. Manage. Studs 38 (4), 489–513. doi:10.1111/1467-6486.00246
Barney, J. (1991). Firm Resources and Sustained Competitive Advantage. J. Manage. 17 (1), 99–120. doi:10.1177/014920639101700108
Baskentli, S., Sen, S., Du, S., and Bhattacharya, C. B. (2019). Consumer Reactions to Corporate Social Responsibility: The Role of CSR Domains. J. Business Res. 95 (2), 502–513. doi:10.1016/j.jbusres.2018.07.046
Baumgartner, R. J., and Ebner, D. (2010). Corporate Sustainability Strategies: Sustainability Profiles and Maturity Levels. Sust. Dev. 18 (2), 76–89. doi:10.1002/sd.447
Bhandari, A., Javakhadze, D., Bhandari, A., and Javakhadze, D. (2017). Corporate Social Responsibility and Capital Allocation Efficiency. J. Corporate Finance 43, 354–377. doi:10.1016/j.jcorpfin.2017.01.012
Carrión-Flores, C. E., and Innes, R. (2010). Environmental Innovation and Environmental Performance. J. Environ. Econ. Manage. 59 (1), 27–42. doi:10.1016/j.jeem.2009.05.003
Chang, X., Fu, K., Low, A., and Zhang, W. (2015). Non-Executive Employee Stock Options and Corporate Innovation. J. Financ. Econ. 115 (1), 168–188. doi:10.1016/j.jfineco.2014.09.002
Chen, Y. S., Chang, C. H., and Wu, F. S. (2012). Origins of Green Innovations: The Differences between Proactive and Reactive Green Innovations. Manage. Decis. 50 (3), 368–398. doi:10.1108/00251741211216197
Chen, Y.-S. (2008). The Driver of Green Innovation and Green Image - Green Core Competence. J. Bus Ethics 81 (3), 531–543. doi:10.1007/s10551-007-9522-1
Cheng, B., Ioannou, I., and Serafeim, G. (2014). Corporate Social Responsibility and Access to Finance. Strat. Mgmt. J. 35 (1), 1–23. doi:10.1002/smj.2131
Costantini, V., Mazzanti, M., and Montini, A. (2013). Environmental Performance, Innovation and Spillovers. Evidence from a Regional NAMEA. Ecol. Econ. 89, 101–114. doi:10.1016/j.ecolecon.2013.01.026
Edward Freeman, R., and Evan, W. M. (1990). Corporate Governance: A Stakeholder Interpretation. J. Behav. Econ. 19 (4), 337–359. doi:10.1016/0090-5720(90)90022-y
Eiadat, Y., Kelly, A., Roche, F., and Eyadat, H. (2008). Green and Competitive? an Empirical Test of the Mediating Role of Environmental Innovation Strategy. J. World Business 43 (2), 131–145. doi:10.1016/j.jwb.2007.11.012
Fernando, Y., Chiappetta Jabbour, C. J., and Wah, W.-X. (2019). Pursuing Green Growth in Technology Firms through the Connections between Environmental Innovation and Sustainable Business Performance: Does Service Capability Matter? Resour. Conserv. Recycl. 141, 8–20. doi:10.1016/j.resconrec.2018.09.031
Fombrun, C., and Shanley, M. (1990). What's in a Name? Reputation Building and Corporate Strategy. Amj 33 (2), 233–258. doi:10.5465/256324
Ghisetti, C., and Quatraro, F. (2017). Green Technologies and Environmental Productivity: A Cross-Sectoral Analysis of Direct and Indirect Effects in Italian Regions. Ecol. Econ. 132 (132), 1–13. doi:10.1016/j.ecolecon.2016.10.003
Giannetti, M., Liao, G., and Yu, X. (2015). The Brain Gain of Corporate Boards: Evidence from China. J. Finance 70 (4), 1629–1682. doi:10.1111/jofi.12198
Godfrey, P. C., Merrill, C. B., and Hansen, J. M. (2009). The Relationship between Corporate Social Responsibility and Shareholder Value: An Empirical Test of the Risk Management Hypothesis. Strat. Mgmt. J. 30 (4), 425–445. doi:10.1002/smj.750
Hall, B. H., Jaffe, A. B., and Trajtenberg, M. (2005). Market Value, and Patent Citations. RAND J. Econ. 36 (1), 16–38. doi:10.1007/s11127-005-3550-0
Hojnik, J., and Ruzzier, M. (2016). The Driving Forces of Process Eco-Innovation and its Impact on Performance: Insights from Slovenia. J. Clean. Prod. 133 (133), 812–825. doi:10.1016/j.jclepro.2016.06.002
Huang, X., Hu, Z., Fu, C., and Yu, D. (2015). The Influence Mechanism of Green Innovation Strategy on Enterprise Performance. Based on the Mediating Effect of Green Dynamic Capability. Sci. Technol. Prog. Pol. 32 (17), 104–109. doi:10.6049/kjjbydc.2015030337
Jia, X., and Liu, Y. (2014). External Environment, Internal Resource, and Corporate Social Responsibility. Nankai Business Rev. 17 (06), 13–18+52.
Jin, L. (2006). An Empirical Study on Corporate Social Responsibility Evaluating Scale System. Consumers’ Viewpoint. China Ind. Econ. (06), 114–120. doi:10.3969/j.issn.1006-480X.2006.06.015
Jin, S. (2019). Debt Heterogeneity, Nature of Property Right and Enterprises’ Sustainable Development. J. Shanxi Univ. Finance Econ. 41 (06), 67–84. doi:10.13781/j.cnki.1007-9556.2019.06.006
Khan, A., Muttakin, M. B., and Siddiqui, J. (2013). Corporate Governance and Corporate Social Responsibility Disclosures: Evidence from an Emerging Economy. J. Bus Ethics 114 (2), 207–223. doi:10.1007/s10551-012-1336-0
Lee, D. D., and Faff, R. W. (2010). Corporate Sustainability Performance and Idiosyncratic Risk: A Global Perspective. Financ. Rev. 44 (2), 213–237. doi:10.1111/j.1540-6288.2009.00216.x
Li, W., and Zheng, M. (2016). Is it Substantive Innovation or Strategic Innovation? --Impact of Macroeconomic Policies on Micro-enterprises' Innovation. Econ. Res. J. 51 (04), 60–73.
Li, S., Hong, T., and Wu, C. (2012). Patent Output, Intellectual Property Protection, and Market Value: Evidence from China’s Listed Companies. Nankai Business Rev. 15 (06), 4–13. doi:10.3969/j.issn.1008-3448.2012.06.002
Li, T. X. (2013). Research Progress of Sustainable Development Index System at Home and Abroad. J. Eco-Environ. 22 (06), 1085–1092. doi:10.3969/j.issn.1674-5906.2013.06.029
Lu, X., and Bai, T. (2020). How Can Green Technology Innovation Effectively Reduce Smog Pollution? China Soft Sci. (06), 174–182. doi:10.3969/j.issn.1002-9753.2020.06.016
Lu, T., and Dang, Y. (2014). Corporate Governance and Innovation: Differences Among Industry Categories. Econ. Res. J. 49 (06), 115–128.
Marom, I. Y. (2006). Toward a Unified Theory of the CSP-CFP Link. J. Bus Ethics 67 (2), 191–200. doi:10.1007/s10551-006-9023-7
Mata, F. J., Fuerst, W. L., and Barney, J. B. (1995). Information Technology and Sustained Competitive Advantage: A Resource-Based Analysis. MIS Q. 19 (4), 487–505. doi:10.2307/249630
Mccarthy, S., Oliver, B., and Song, S. (2017). Corporate Social Responsibility and CEO Confidence. J. Banking Finance 75, 280–291. doi:10.1016/j.jbankfin.2016.11.024
Meng, Q., Hou, C., and Lu, B. (2019). Firms' Innovation and the Risk of Default. The J. World Econ. 42 (10), 169–192.
Montiel, I. (2008). Corporate Social Responsibility and Corporate Sustainability. Organ. Environ. 21 (3), 245–269. doi:10.1177/1086026608321329
Porter, M. E., and Linde, V. C. (1995). Green and Competitive: Ending the Stalemate. Harv. Business Rev. 73 (5), 120–134.
Ren, Q., Xu, Y., and Zhou, R. (2020). Can CEO’s Humble Leadership Behavior Improve Enterprise Performance and Sustainability? A Case Study of Chinese Start-Up Companies. Sustainability 12, 3168. doi:10.3390/su12083168
Rennings, K. (2000). Redefining Innovation - Eco-Innovation Research and the Contribution from Ecological Economics. Ecol. Econ. 32 (2), 319–332. doi:10.1016/s0921-8009(99)00112-3
Russo, A., and Pogutz, S. (2009). Eco-efficiency vs Eco-Effectiveness. Exploring the Link between Ghg Emissions and Firm Performance. Amproc 2009 (1), 1–6. doi:10.5465/ambpp.2009.44263752
Sharma, S., and Vredenburg, H. (1998). Proactive Corporate Environmental Strategy and the Development of Competitively Valuable Organizational Capabilities. Strat. Mgmt. J. 19 (8), 729–753. doi:10.1002/(sici)1097-0266(199808)19:8<729:aid-smj967>3.0.co;2-4
Song, W., and Yu, H. (2018). Green Innovation Strategy and Green Innovation: The Roles of Green Creativity and Green Organizational Identity. Corp. Soc. Responsib. Environ. Mgmt. 25 (2), 135–150. doi:10.1002/csr.1445
Stefan, A., and Paul, L. (2008). Does it Pay to Be Green? A Systematic Overview. Amp 22 (4), 45–62. doi:10.5465/amp.2008.35590353
Stubbs, W., and Cocklin, C. (2008). Conceptualizing a "Sustainability Business Model". Organ. Environ. 21 (2), 103–127. doi:10.1177/1086026608318042
Su, D., Chen, C., Xu, Z., and Li, B. (2017). Social Networks of Commercial Banks and the Sustainable Development of Microfinance in China. Econ. Res. J. 52 (02), 140–155.
Sun, L., Cao, X., Alharthi, M., Zhang, J., Taghizadeh-Hesary, F., and Mohsin, M. (2020). Carbon Emission Transfer Strategies in Supply Chain with Lag Time of Emission Reduction Technologies and Low-Carbon Preference of Consumers. J. Clean. Prod. 264, 121664. doi:10.1016/j.jclepro.2020.121664
Sun, H., Pofoura, A. K., Adjei Mensah, I., Li, L., and Mohsin, M. (2020). The Role of Environmental Entrepreneurship for Sustainable Development: Evidence from 35 Countries in Sub-Saharan Africa. Sci. Total Environ. 741, 140132. doi:10.1016/j.scitotenv.2020.140132
Tan, X. (2017). Industry Competition, Ownership and Disclose of Corporate Social Responsibility Information: Based on Signaling Theory. Ind. Econ. Res. (03), 15–28. doi:10.13269/j.cnki.ier.2017.03.002
Tao, J., Liu, L., and Zhang, W. (2017). IT Capability and Enterprise Sustainable Development Performance. Soft Sci. 31 (10), 10–14. doi:10.13956/j.ss.1001-8409.2017.10.03
Wang, H., and Han, B. (2016). Social Responsibility, Internal Control and Corporate Sustainable Development--Based on an Empirical Analysis of Chinese A-Share Main Board Enterprises. J. Beijing Technol. Business Univ. (Soc. Sci.) 31 (01), 75–84.
Wang, X., and Hu, G. (2020). Green Innovation, Corporate Reputation and Earnings Information Content. J. Beijing Technol. Business Univ.(Soc. Sci.) 35 (01), 50–63.
Wang, C. M., and Li, J. (2019). China's Regional Green Innovation Performance Evaluation and Analysis of its Temporal and Spatial Differences: Based on Panel Data of Inter-provincial Industrial Enterprises from 2005 to 2015. Sci. Res. Manage. 40 (6), 29–42. doi:10.19571/j.cnki.1000-2995.2019.06.004
Weina, D., Gilli, M., Mazzanti, M., and Nicolli, F. (2016). Green Inventions and Greenhouse Gas Emission Dynamics: A Close Examination of Provincial Italian Data. Environ. Econ. Pol. Stud. 18 (2), 247–263. doi:10.1007/s10018-015-0126-1
Wen, W., and Song, J. (2017). Executives' Foreign Experience and Corporate Social Responsibility. J. Manage. Sci. 30 (02), 119–131. doi:10.3969/j.issn.1672-0334.2017.02.010
Wu, C., and Deng, M. (2019). Scientific, and Technological Innovation, Opening to the Outside World and High-Quality Development of the Yangtze River Economic Belt. Sci. Technol. Prog. Pol. 36 (03), 33–41. doi:10.6049/kjjbydc.L201808436
Wu, X., and Zhang, X. (2015). Enterprise Capability, Technology Innovation, Value Network Cooperation Innovation, and Firm Performance. J. Manage. Sci. 28 (06), 12–26. doi:10.3969/j.issn.1672-0334.2015.06.002
Wu, L., and Zhang, Y. (2017). Accounting Conservatism, Charitable Donation and Sustainable Development Enterprises: Empirical Evidence from Chinses A-Share Market. Mod. Finance Econ. 37 (08), 85–100. doi:10.19559/j.cnki.12-1387.2017.08.007
Wu, L., Shao, Z., Yang, C., Ding, T., and Zhang, W. (2020). The Impact of CSR and Financial Distress on Financial Performance-Evidence from Chinese Listed Companies of the Manufacturing Industry. Sustainability 12 (17), 6799. doi:10.3390/su12176799
Wu, G. C. (2013). The Influence of green Supply Chain Integration and Environmental Uncertainty on green Innovation in Taiwan's IT Industry. Supp Chain Mnagmnt 18 (5), 539–552. doi:10.1108/scm-06-2012-0201
Xiao, X., Wang, Y., and Li, S. (2013). Government Incentives, Property Rights, and Corporate Innovation. Res. Financ. Econ. Issues (12), 26–33. doi:10.3969/j.issn.1000-176X.2013.12.004
Xu, J., and Wang, M. (2018). Green Technology Innovation, Environmental Regulation, and Energy Intensity--An Empirical Study Based on Chinese Manufacturing Industry. Stud. Sci. Sci. 36 (04), 744–753. doi:10.3969/j.issn.1003-2053.2018.04.018
Yang, X., Peng, C., and Yao, A. (2018). Management Capability, Internal Control and Corporate Sustainability. Auditing Res. (03), 121–128. doi:10.3969/j.issn.1002-4239.2018.03.017
Zhang, D., Mohsin, M., Rasheed, A. K., Chang, Y., and Taghizadeh-Hesary, F. (2021). Public Spending and Green Economic Growth in BRI Region: Mediating Role of Green Finance. Energy Policy 153, 112256. doi:10.1016/j.enpol.2021.112256
Keywords: executives’ willingness to invest in green innovation, corporate sustainable development, CSR, scientific research ability, property rights, innovation types
Citation: Liao Y, Qiu X, Wu A, Sun Q, Shen H and Li P (2022) Assessing the Impact of Green Innovation on Corporate Sustainable Development. Front. Energy Res. 9:800848. doi: 10.3389/fenrg.2021.800848
Received: 25 October 2021; Accepted: 23 December 2021;
Published: 21 February 2022.
Edited by:
Fateh Belaid, King Abdullah Petroleum Studies and Research Center (KAPSARC), Saudi ArabiaCopyright © 2022 Liao, Qiu, Wu, Sun, Shen and Li. This is an open-access article distributed under the terms of the Creative Commons Attribution License (CC BY). The use, distribution or reproduction in other forums is permitted, provided the original author(s) and the copyright owner(s) are credited and that the original publication in this journal is cited, in accordance with accepted academic practice. No use, distribution or reproduction is permitted which does not comply with these terms.
*Correspondence: Haomin Shen, MTgxMTMwNzVAYmp0dS5lZHUuY24=; Peiyang Li, MjAxMjA2NTlAYmp0dS5lZHUuY24=