- 1School of Nuclear Science and Technology, University of South China, Hengyang, China
- 2Science and Technology on Reactor System Design Technology Laboratory, Nuclear Power Institute of China, Chengdu, China
- 3School of Resource Environment and Safety Engineering, University of South China, Hengyang, China
This work is interested in verifying and analyzing the advanced neutronics lattice code KYLIN V2.0. Assembly calculations are an integral part of the two-step calculation for core design, and their accuracy directly affects the results of the core physics calculations. In this paper, we use the Doppler coefficient numerical benchmark problem and CPR1000 AFA-3G fuel assemblies to verify and analyze the advanced neutronics lattice code KYLIN V2.0 developed by the Nuclear Power Institute of China. The analysis results show that the Doppler coefficients calculated by KYLIN V2.0 are in good agreement with the results of other well-known nuclear engineering design software in the world; the power distributions of AFA-3G fuel assemblies are in good agreement with the results of the RMC calculations, it’s error distribution is in accordance with the normal distribution. It shows that KYLIN V2.0 has high calculation accuracy and meets the engineering design requirements.
Introduction
The main task of reactor physics analysis is to simulate various nuclear reaction processes in the core and to analyze various key parameters related to the “nuclear” in the nuclear reactor, including core criticality (reactivity), core three-dimensional power distribution, various reactivity coefficients, control rod values, shutdown margins, and isotope changes of various assemblies in the nuclear fuel, etc. The key to the physical analysis of the reactor is to solve the neutron transport equation and the fuel consumption equation. There are two methods to solve the neutron transport equation, one is the approximate method to solve the seven-dimensional equation, and the other is the probabilistic method to solve the neutron transport equation - Monte Carlo transport calculation method (Hammersley, 2013). However, the Monte Carlo method cannot be widely used in the engineering design of nuclear reactor core physics due to the large calculation rate and the difficulty of multi-physics coupling calculation (Lang et al., 1993).
Nuclear Power Institute of China (NPIC) has developed a software platform with independent property rights for nuclear power design and system safety analysis, NEPRI, in which the lattcie code KYLIN-V2.0 (Chai et al., 2017) is mainly used to calculate the few group constants for transport of single rods and assemblies of pressurized water reactors and the nucleon density of important nuclides for the core diffusion code for full core calculations. KYLIN-V2.0 uses the subgroup resonance calculation method to obtain effective resonance self-shielding cross sections, eliminating the limitations of lattice geometry and ensuring accuracy and efficiency, with multi-group energy structure in the cross section database. When multiple resonance nuclides are present, the Bondarenko iterative method is used to deal with resonance interference effects. The neutron transport calculation adopts the method of characteristics (MOC) (Douglas and Russell, 1982), the Chebyshev rational approximation method (CRAM) (Maria, 2016) with good computational accuracy and efficiency is used in the fuel burnup calculation in KYLIN V2.0 program. The KYLIN V2.0 program solves the multigroup diffusion equation by the fractional group diffusion theory and obtains the fewgroup parameters needed for the core procedure by parallel group homogenization.
In order to further confirm the engineering applicability of KYLIN V2.0 code and the credibility of the calculation results, an application study and additional validation experiments of the key nuclear power design software were conducted. In this paper, the Doppler temperature coefficient and neutron transport functions of the KYLIN V2.0 code are verified based on the Doppler temperature coefficient numerical benchmark problem and the AFA-3G fuel assembly problem.
KYLIN V2.0 Software
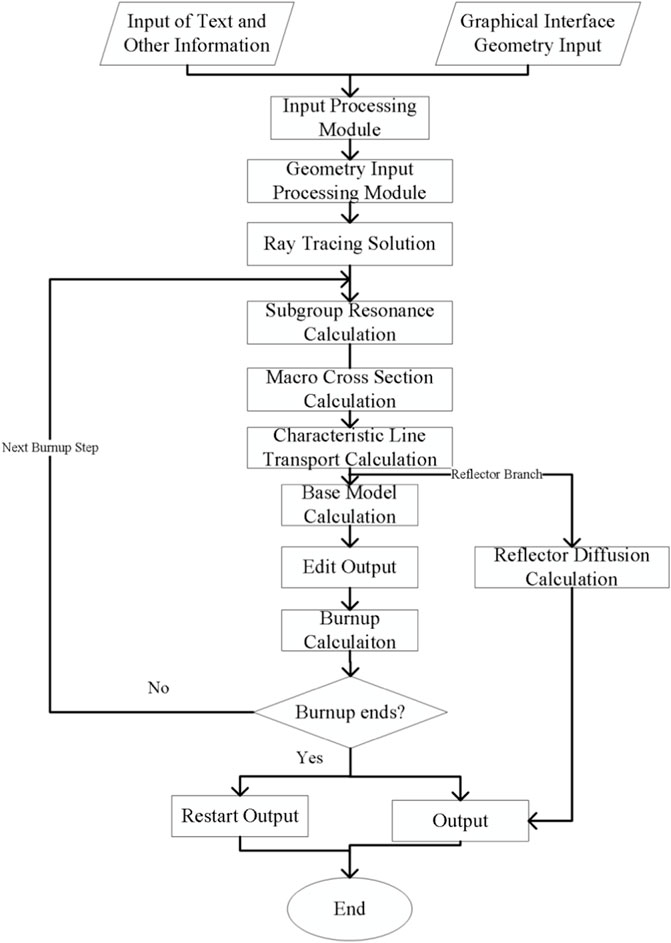
The neutronics lattice calculation code KYLIN-V2.0 is an important program in the core design program system, which provides the homogenization parameters of two-dimensional components for the core design software CORCA 3D through the cross-section production software PACFAC. The calculation flow chart of KYLIN-V2.0 is shown in Figure 1, and the program uses the 45-group or 190-group multi-group cross-section library generated by the NJOY code to calculate. KYLIN-V2.0 code uses the relevant computational procedures to rigorously solve the slowing down equations for homogeneous mixtures to obtain the effective resonance cross sections of resonant nuclides. Method of characteristics (MOC) is used to solve the neutron transport problem for two-dimensional steady-state multi-group neutron transport equation. The coarse mesh finite difference (CMFD) (Zhu et al., 2016) or generalized coarse mesh finite difference (GCMFD) (Yamamoto, 2005) are used to accelerate method of characteristics, and the P1 or B1 approximation to perform neutron leakage calculations to obtain the and group constants. The improved predictor-corrector method (PPC) (Wang et al., 2018) was used to solve the fuel consumption. KYLIN-V2.0 code is based on the PPC method. The log-linear extrapolation of the reaction rate is used for strong absorption nuclei such as 155Gd and 157Gd, and the Chebyshev rational approximation method (CRAM) is used to solve the fuel consumption equation.
Benchmark Question Validation
Doppler Temperature Coefficient Numerical Benchmark Problem
The data underlying the Doppler temperature coefficient benchmark question are obtained from Los Alamos National Laboratory, United States, which has been jointly approved by the American Nuclear Society’s Division of Mathematics and Computation, Reactor Physics, and Radiation Protection Committees (Mosteller et al., 1991; Mosteller, 2007; Thilagam et al., 2007). The reactivity Doppler temperature coefficient is a key parameter for the reactivity evaluation of several transients in light water reactors (LWRs), including pressurized water reactor control rod ejection accidents and steam pipe rupture accidents. However, it is relatively small in magnitude. The Doppler feedback from hot zero power (HZP) to hot full power (HFP) produces a reactivity change in LWRs of only about 1,000 pcm. In addition, the reactivity change cannot be measured directly in an operating reactor, but must be derived from the derivation of other parameters.
The benchmark contains the corresponding gate element structures for the hot zero power (HZP) and hot full power (HFP) conditions. At HZP, the temperature of all fuels, cladding and moderators is a uniform 600K. At HFP, the fuel temperature is 900K, while all others remain at 600K. The reactivity difference between the HFP and HZP conditions is used to calculate the Doppler effect. The reactivity Doppler temperature coefficient is then determined as
where DC is the Doppler temperature coefficient, ΔTFuel is 300K, The changes from Doppler loss in reactivity is
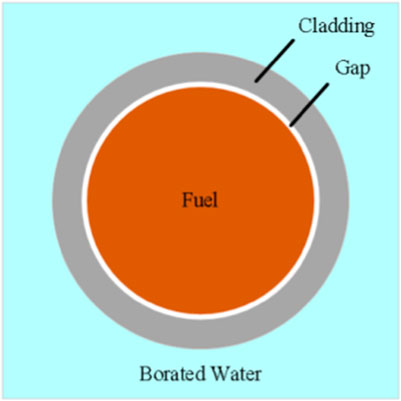
The geometric structure of the benchmark problem is shown in Figure 2, and its geometric data are shown in Table 1.
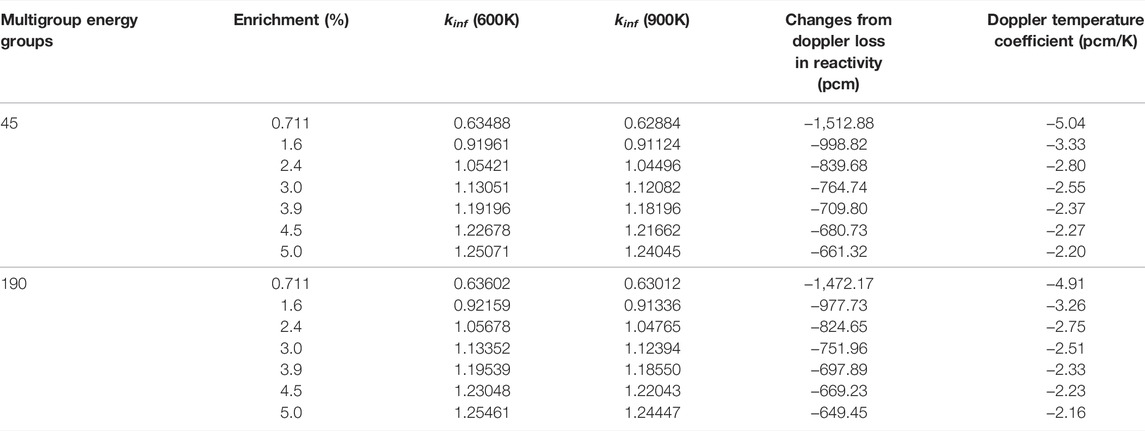
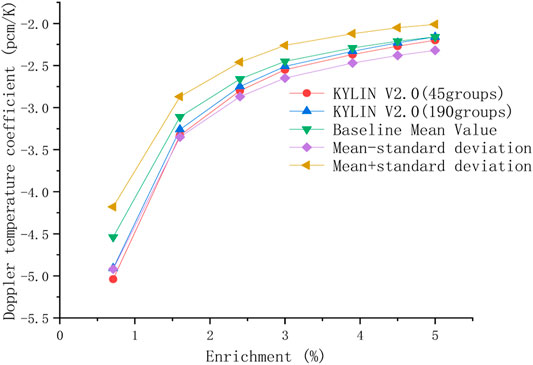
The results of Doppler temperature coefficients obtained by KYLIN V2.0 refined modeling are shown in Table 2. Fifteen organizations in eight countries obtained 44 different solution sets based on different cross-sectional libraries using different software such as MCNP, KENO, CASMO, DRAGON, APPLLO, NEWT, HELIOS, and based on these solution sets, the Doppler mean value of temperature coefficients and the ±standard deviation range are obtained by bringing the solution set of KYLIN V2.0 to obtain the Doppler temperature coefficient trend graph.
Due to the microscopic cross-section in KYLIN V2.0 adopts ENDF/B-VIII.0 nuclear database, KYLIN V2.0 code provides overestimated values of FTC when compared to results of other codes. Through Table 2 and Figure 3, it can be concluded that KYLIN V2.0 is within the standard deviation envelope when using the 45-group cross-section library, except for the Doppler temperature coefficient when the enrichment is 0.711%. The result is slightly lower than the benchmark mean-standard deviation, and all solutions are within the standard deviation envelope when using the 190-group cross-section library, and through the results, it can be concluded that KYLIN V2.0 is comparable to the standard deviation envelope in calculating the Doppler temperature coefficient. The accuracy of KYLIN V2.0 in calculating Doppler temperature coefficients is similar to that of international nuclear design related software, which meets the engineering design requirements.
AFA-3G Fuel Assembly Benchmark Questions
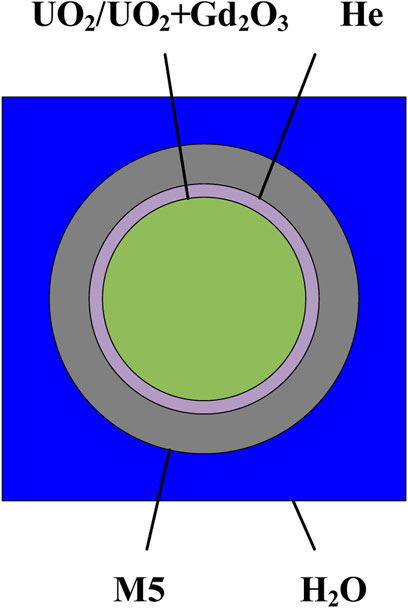
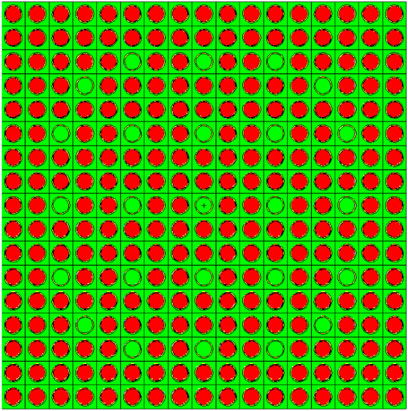
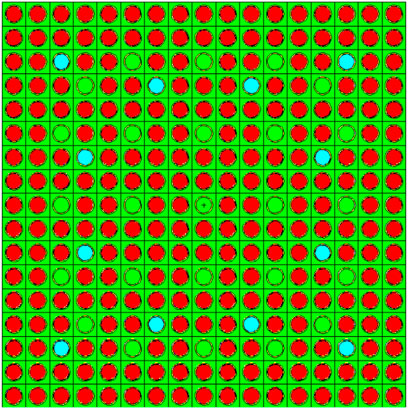
The base data of the AFA-3G fuel assembly benchmark question was obtained from the Chinese Electrical Engineering Dictionary, Volume 6 - Nuclear Power Generation Engineering. The benchmark question was established by referring to the operating parameters of units 3 and 4 of the Ningde Phase I project (Forat and Florentin, 1999; Lu et al., 2002; Ye et al., 2009; Lei et al., 2021). The AFA-3G fuel assembly continues the standard Westinghouse fuel assembly arrangement with a 17 × 17 square arrangement, and the burnable poison is selected as Gd2O3 with 9% by weight and 235U enrichment of 0.711% in Gd rods (Wang et al., 2018). The AFA-3G fuel assembly, with the grid element geometry arrangement shown in Figure 4, is used in this paper for a 235U enrichment of 3.7% without burnable poison rod assembly (37,000-type fuel assembly) and a 235U enrichment of 4.45% with 12 burnable poison rods assembly ( The 44,512 fuel assembly). Figure 5 shows Geometric arrangement of AFA-3G37000 type assembly and Figure 6 Geometric arrangement of AFA-3G44512 type assembly (the red grid element is the fuel grid element, the green grid element is the control rod conduit grid element, and the blue grid element is the combustible poison rod grid element).
According to the relevant references, the eigenvalues and relative errors of the assemblies at different depletion steps obtained by KYLIN V2.0 code and RMC code [9] based on the ENDF/B-VIII.0 database after refinement modeling are shown in Table 3. The relative errors between KYLIN V2.0 code and RMC code are within ±0.5% of the calculated eigenvalues, which meets the error requirement. According to Figure 7, where the power distribution is compared at the beginning (0 MWd/tU), middle (30,000 MWd/tU) and end (60,000 MWd/tU) of the life cycle.
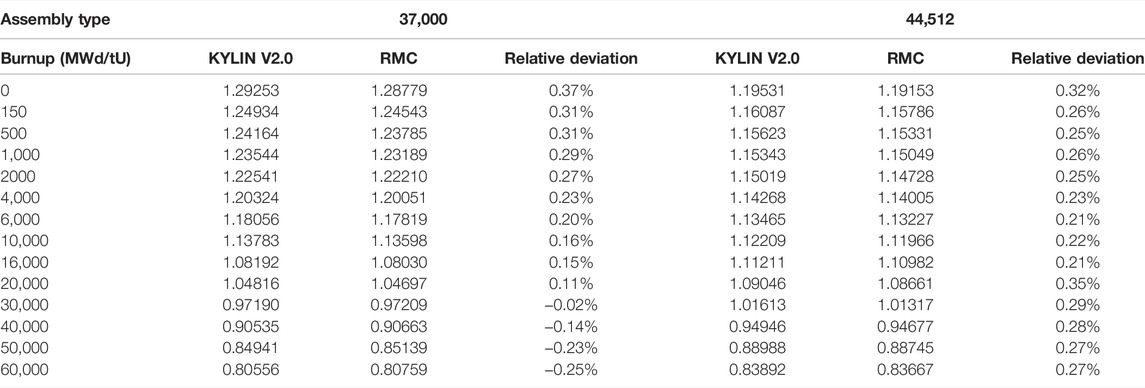
TABLE 3. Table of characteristic values of different depletion steps of AFA-3G assemblies calculated by KYLIN V2.0.
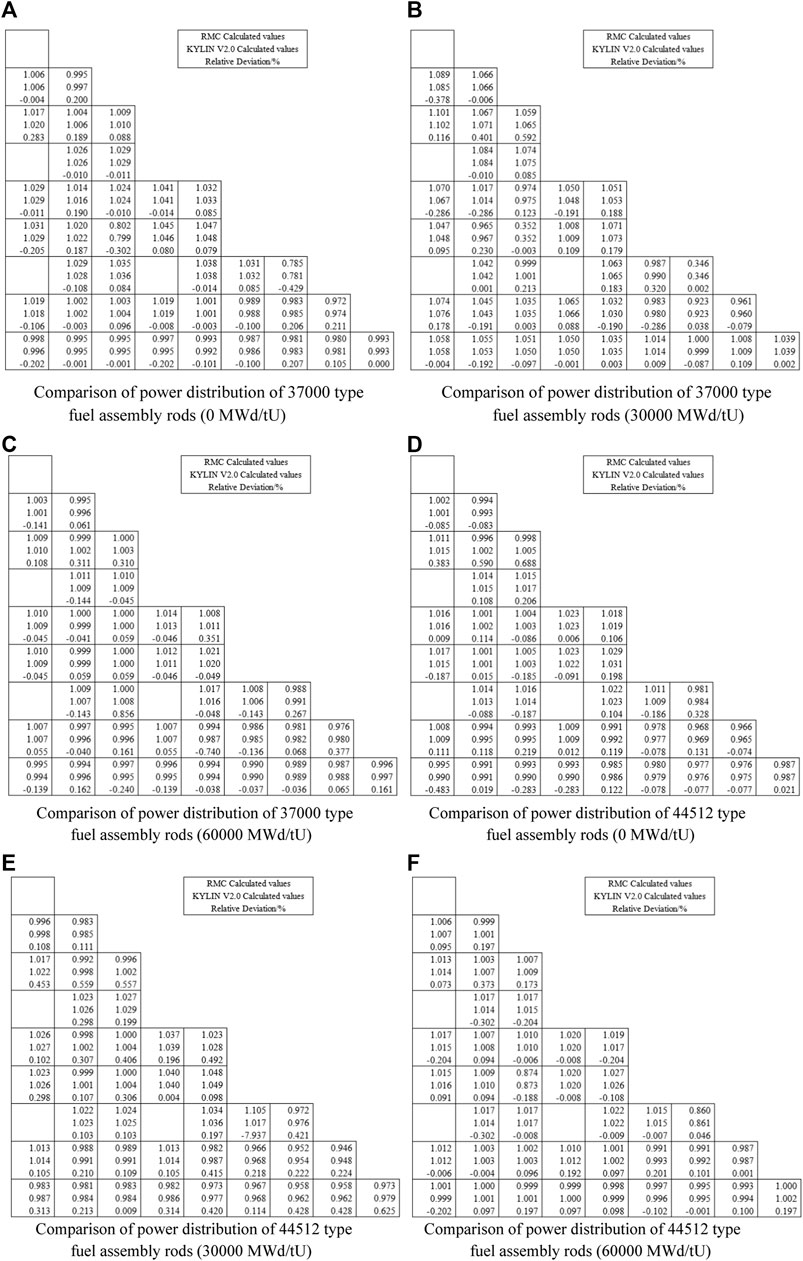
FIGURE 7. Comparison of KYLIN V2.0 and RMC power distribution. (A) Comparison of power distribution of 37000 type (B) Comparison of power distribution of 37000 type fuel assembly rods (0 MWd/tU) fuel assembly rods (30000 MWd/tU) (C) Comparison of power distribution of 37000 type (D) Comparison of power distribution of 44512 type fuel assembly rods (60000 MWd/tU) fuel assembly rods (0 MWd/tU) (E) Comparison of power distribution of 44512 type (F) Comparison of power distribution of 44512 type fuel assembly rods (30000 MWd/tU) fuel assembly rods (60000 MWd/tU)
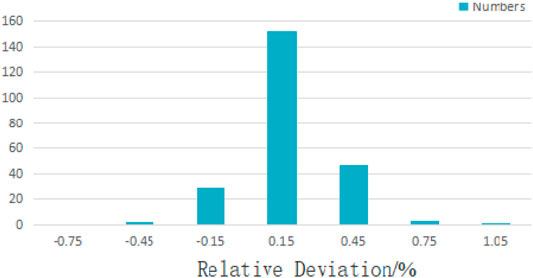
Through Figure 7, it can be found that the errors of the rod power distribution between KYLIN V2.0 code and RMC code are between ±1%, which meets the international index ±5% error range. The error statistics of the relative distribution error of the rods of AFA-3G 37,000 fuel assembly and AFA-3G 445,12 fuel assembly are shown in Figure 8. The statistical results using the Owen factor method (Mosteller et al., 1991) show that the relative error 95/95 confidence interval is (0.001%, 0.054%). The results show that the errors of the rod power distribution between KYLIN V2.0 code and RMC code are normally distributed and the confidence interval is within the error range. From the error, two software are in good compliance, and indicates that KYLIN V2.0 is able to meet the requirements for calculating the eigenvalues. It shows that KYLIN V2.0 can meet the engineering design requirements in terms of calculating the eigenvalues and the assembly power distribution.
Conclusion
In this paper, the calculation scheme and theoretical model in KYLIN-V2.0 code are briefly introduced. And in order to verify the calculation ability of KYLIN-V2.0 code, the Doppler coefficient numerical benchmark problems, AFA-3G 37,000 gadolinium-free fuel and AFA-3G 44,512 gadolinium-containing fuel assembly problems from Ningde nuclear power plant are chosen. By comparing the results with reference results from benchmark and the reference program RMC, the main conclusions were drawn as follows:
a) For the Doppler temperature coefficient benchmark question, the calculated Doppler temperature coefficient is between the mean ± standard deviation of the calculated results from references, which is consistent with good.
b) For the calculation of AFA-3G fuel assemblies with gadolinium and fuel assemblies without gadolinium, RMC was selected as the reference procedure. The relative errors of eigenvalues calculated within ±0.5%, which is in accordance with error criteria; the relative errors of power distribution meet the error requirement of ±5%.
c) The relative power of fuel assembly rods based on KYLIN V2.0 code and RMC code with 95/95 confidence intervals of (0.001%,0.054%) was calculated by the Owen factor method, and the relative errors were in accordance with the normal distribution.
d) The KYLIN-V2.0 program is able to meet engineering design requirements in terms of calculating Doppler temperature coefficients, eigenvalues, and assembly power distributions.
Data Availability Statement
The original contributions presented in the study are included in the article/Supplementary Material, further inquiries can be directed to the corresponding authors.
Author Contributions
LJ and XJ: Conceptualization, Methodology, Software YC and CZ: Data curation, Writing—Original draft preparation. WJ, ZB, and ZC: Visualization, Investigation. XJ, YT, and LX: Supervision: ZH, LJ and DN: Writing—Reviewing and Editing.
Funding
This work is supported by the Scientific Research Project of Hunan Provincial Education Department (No. 19A422), Hunan Province Science and Technology Talent Support Project (No. 2020TJ-N02), 2020 Graduate Research and Innovation Project of Hunan Province, PR China (No. CX20200946), University of South China Innovation Foundation For Postgraduate (213YXC009), and the National Natural Science Foundation of China (No. 12175101) for their funding.
Conflict of Interest
The authors declare that the research was conducted in the absence of any commercial or financial relationships that could be construed as a potential conflict of interest.
Publisher’s Note
All claims expressed in this article are solely those of the authors and do not necessarily represent those of their affiliated organizations, or those of the publisher, the editors and the reviewers. Any product that may be evaluated in this article, or claim that may be made by its manufacturer, is not guaranteed or endorsed by the publisher.
Acknowledgments
The authors would like to show their great appreciation to NEAL (Nuclear Engineering and Application Laboratory) Team for its contribution to this research.
References
Chai, X., Tu, X., Lu, W., Lu, Z., Yao, D., Li, Q., et al. (2017). The Powerful Method of Characteristics Module in Advanced Neutronics Lattice Code KYLIN-2[J]. J. Nucl. Eng. Radiat. Sci. 3 (3), 031004. doi:10.1115/1.4035934
Douglas, J., and Russell, T. F. (1982). Numerical Methods for Convection-Dominated Diffusion Problems Based on Combining the Method of Characteristics with Finite Element or Finite Difference Procedures. SIAM J. Numer. Anal. 19 (5), 871–885. doi:10.1137/0719063
Forat, C., and Florentin, F. (1999). The AFA 3G Fuel Assembly: A Proven Design for High burnups[M]. LWR nuclear fuel highlights at the beginning of the third millennium.
Lang, G. H., Johnson, C. W., Koonin, S. E., and Ormand, W. E. (1993). Monte Carlo Evaluation of Path Integrals for the Nuclear Shell Model. Phys. Rev. C 48 (4), 1518–1545. doi:10.1103/physrevc.48.1518
Lei, J. C., Zhou, J. D., Zhao, Y. N., Chen, Z. P., Zhao, P. C., Xie, C., et al. (2021). Prediction of Burn‐up Nucleus Density Based on Machine Learning[J]. Int. J. Energ. Res. 45, 14052. doi:10.1002/er.6660
Lu, H., Liu, T., Jiao, Y., and Pang, H. (2002). AFA 2G and AFA 3G Fuel Rod Performance Analysis[J]. Nucl. Power Eng. 23 (5), 58–61, 84.
Maria, P. (2016). Higher-Order Chebyshev Rational Approximation Method and Application to Burnup Equations. Nucl. Sci. Eng. 182 (3), 297–318. doi:10.13182/nse15-26
Mosteller, R. D., Eisenhart, L. D., Little, R. C., Eich, W. J., and Chao, J. (1991). Benchmark Calculations for the Doppler Coefficient of Reactivity. Nucl. Sci. Eng. 107 (3), 265–271. doi:10.13182/nse91-a23789
Mosteller, R. D. (2007). “The Doppler-Defect Benchmark: Overview and Summary of Results,” in Joint International Topical Meeting on Mathematics & Computation and Supercomputing in Nuclear Applications (M&C + SNA 2007), Monterey, California, April 15–19, 2007.
Thilagam, L., Sunny, C. S., Subbaiah, K. V., Devan, K., Lee, Y. S., and Jagannathan, V. (2007). “Doppler Coefficient of Reactivity-Benchmark Calculations for Different Enrichments of UO2[C],” in Joint International Topical Meeting on Mathematics & Computation and Supercomputing in Nuclear Applications, Monterey, California.
Wang, B., Liu, Z., Chen, J., Zhao, C., Cao, L., and Wu, H. (2018). A Modified Predictor-Corrector Quasi-Static Method in NECP-X for Reactor Transient Analysis Based on the 2D/1D Transport Method. Prog. Nucl. Energ. 108, 122–135. doi:10.1016/j.pnucene.2018.05.014
Yamamoto, A. (2005). Generalized Coarse-Mesh Rebalance Method for Acceleration of Neutron Transport Calculations. Nucl. Sci. Eng. 151 (3), 274–282. doi:10.13182/nse151-274
Ye, Q. Z., Li, X. M., Yu, C. D., and Huang, X. (2009). China Electrical Engineering Dictionary, Vol. 6. Nuclear Power Generation Engineering [M]. China: China Electric Power Press.
Keywords: KYLIN V2.0, doppler temperature coefficient, power distribution, method of characteristic (MOC), AFA 3G
Citation: Jichong L, Jinsen X, Zhenping C, Tao Y, Chao Y, Bin Z, Chen Z, Xiangyang L, Jiebo W, Huajian Z and Nianbiao D (2021) Validation of Doppler Temperature Coefficients and Assembly Power Distribution for the Lattice Code KYLIN V2.0.. Front. Energy Res. 9:801481. doi: 10.3389/fenrg.2021.801481
Received: 25 October 2021; Accepted: 08 November 2021;
Published: 02 December 2021.
Edited by:
Shripad T. Revankar, Purdue University, United StatesReviewed by:
Donny Hartanto, University of Sharjah, United Arab EmiratesA. Abdelghafar Galahom, Higher Technological Institute, Egypt
Copyright © 2021 Jichong, Jinsen, Zhenping, Tao, Chao, Bin, Chen, Xiangyang, Jiebo, Huajian and Nianbiao. This is an open-access article distributed under the terms of the Creative Commons Attribution License (CC BY). The use, distribution or reproduction in other forums is permitted, provided the original author(s) and the copyright owner(s) are credited and that the original publication in this journal is cited, in accordance with accepted academic practice. No use, distribution or reproduction is permitted which does not comply with these terms.
*Correspondence: Yu Tao, eXV0YW8yOUBzaW5hLmNvbQ==; Chen Zhenping, Y2h6cGluZ0B5ZWFoLm5ldA==
 Lei Jichong
 Xie Jinsen1