 Qingxin Lan
 Wan Tang1
- 1School of International Trade and Economics, University of International Business and Economics, Beijing, China
- 2Business school, Jinggang Shan university, Jian, China
Green and low-carbon development is an important element of the Belt and Road Initiative, and a reasonable and objective evaluation of China’s green investment efficiency in B&R countries is of great significance to promote the sustainable development of those area. This paper applies the Slack-based measure model that considers undesirable outputs and Malmquist total factor productivity index to measure the efficiency of China’s green investment in B&R countries from 2011 to 2018 from both static and dynamic perspectives, as well as provides an in-depth analysis of the differences, changes, and influential factors. The empirical results reveal that the overall efficiency of China’s green investment in B&R countries is relatively low, showing a distinctly uneven trend and the main driving force of the decline in total factor productivity comes from technical change. Some significant differences have also been reported amongst these countries in terms of their industrial development and income levels. These findings provide a valuable reference for B&R countries to identify unique strategies that can promote their green total productivity factor.
1 Introduction
At the second Belt and Road Forum for International Cooperation in April 2019, General Secretary Xi Jinping pointed out that we should put into practice the principles of common business, common construction and sharing, and build the “Belt and Road” with the concept of openness, green and honesty. The “Belt and Road” initiative (BRI) focuses on both economic prosperity and green development. China has always upheld the concept of green development in the practice of “Belt and Road” construction, promoted green and low-carbon infrastructure construction and operation management, emphasized the concept of ecological civilization in investment and trade, and strengthened cooperation in ecological and environmental management, biodiversity conservation and climate change.
According to World Bank, the greenhouse gases emitted during the construction and operation of infrastructure in Belt and Road (B&R) countries account for 70% of the total global carbon emissions, and once completed, their annual emissions will remain unchanged for decades to come, with an obvious “carbon lock-in effect”. Apart from the energy consumption caused by the B&R project, most B&R countries are from the developing world whose economic development patterns are still featured by “high inputs, high consumption, and high emissions” (Hou et al., 2019). With the outbreak of conflicts accumulated over years of uneven development, the crude development method can no longer maintain the original growth rate of the economy and brings a series of environmental and social problems. The specifics of socio-economic and technological development levels and systems vary greatly. An effective assessment of the relationship between the level of economic development (Wei et al., 2019) and environmental efficiency (Hu and Zheng, 2021) of B&R countries is essential to analyze the level of green development and its development trend. Green upgrade is an important support force to promote high-quality economic development and people’s happiness. (Li and Zhang, 2021).
A recent report released by the United Nations Environment Programme (UNEP) shows that only $368 billion of the $14.6 trillion in announced recovery plan-related spending in 2020 meets the “green standards” and that most green spending is concentrated in a few high-income countries, which is likely to exacerbate the uneven development of the green economy that existed before the epidemic (Hu et al., 2018). After the COVID-19 epidemic, green development will be gradually centralized under the BRI, and the support of governments and financial institutions for the development of green industries will be further strengthened; highly-polluting and energy-intensive industries may be eliminated at an accelerated rate, and people will pay more attention to and support environmental protection, which may force the realization of green development. In the post-epidemic economic recovery phase, the Chinese government has proposed green low-carbon development initiatives such as the “China Carbon Neutral Commitment”, calling on all countries to establish a new development concept of innovation, coordination, green, openness and sharing, seize the historic opportunity of the new round of technological revolution and industrial change, nurture new opportunities in the crisis, and take a series of green measures to promote a “green recovery” of the post-epidemic world economy.
2 Literature Review
American economist Simon Kuznets pointed out in 1995 that there is an inverted U-shaped curve between the income disparity and per capita income, called the “Kuznets Curve” (Kuznets, 1955). Through many empirical analyses, economists have found that the relationship between the degree of environmental pollution and the level of economic development also presents an inverted “U-shaped” curve (Grossman and Krueger, 1991), so this curve is called the environmental Kuznets curve (EKC) (Panayotou, 1993), as shown in Figure 1.
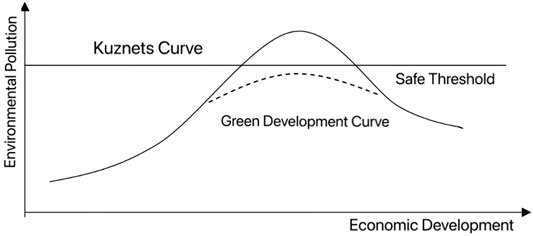
FIGURE 1. Environmental Kuznets curve.
To a certain extent, the Environmental Kuznets Curve (EKC) can visualize the role of green investment in the relationship between environmental pollution and economic development. Along with economic globalization and the global spread of environmental pollution, scholars have focused on the analysis of environmental effects generated by foreign direct investment (FDI) in host countries covering the aspects of opening up, environment and green development. Classical studies have suggested that the mechanism of international trade affecting the environment consists of scale, structural and technological effects (Grossman, 1995), as is shown in Figure 2 which also applies to the transmission path of outward foreign direct investment (OFDI) affecting the environment. In terms of scale effect, along with the entry of FDI, the input of natural resources and other factors will increase, and the scale of production will expand, but it may also lead to excessive input and more pollution emissions. Scholars have studied the structural effects by arguing that multinational companies move pollution-intensive industries to countries with low environmental standards for cost-saving purposes (Taylor, 2005), but FDI also drive industrial upgrading by improving the production efficiency of host countries (Feng, 2003). Some studies have confirmed the environmental improvement effect brought by FDI to the host country from the aspect of technological effect (Frankel, 2003; Sheng and Lv, 2012; Jing and Zhang, 2014; Shao et al., 2021), believing that environment-friendly new technologies and international environmental protection standards provided by FDI can promote the environmental improvement of the host country through learning effect and demonstration effect. The impact of FDI is closely related to the type and degree of environmental regulation, and appropriate environmental regulation helps to enhance the efficiency of green development (Tian and Hao, 2020). Another influencing factor is the size of FDI. The relationship between FDI and environmental pollution is a U-shaped curve that decreases and then rises, which is because the initial FDI mainly plays the advantage of green technology and produces the “pollution halo” effect, and as the scale of FDI expands, the technology of domestic and foreign investment gradually converges, and the impact of environmental pollutants brought by FDI exceeds the effect of technological improvement. (Gu et al., 2020).
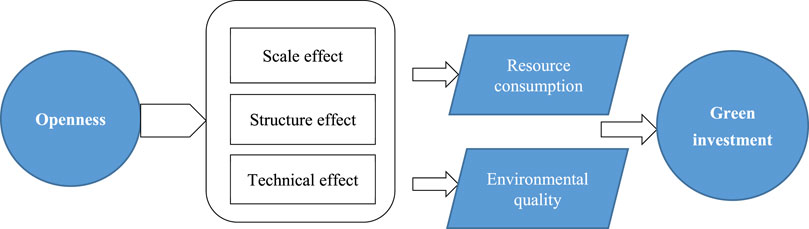
FIGURE 2. The mechanism of openness on the efficiency of green investment.
The economic agglomeration caused by FDI will improve the efficiency of green economy through resource allocation optimization, industrial structure upgrading and technological progress of energy conservation and emission reduction (Jia and Lei, 2019). However, when agglomeration is excessive, crowding effect will be generated and environmental pollution will be aggravated (Zhou and Zhang, 2021). Meanwhile, most existing studies focus on the analysis of the impact of China’s OFDI on domestic technological innovation, arguing that China’s OFDI promotes domestic technological innovation capability, and the impact mechanisms mainly include industrial transfer mechanism, high-end production link gathering in home countries, reverse technology spillover effect, and competition mechanism (Nie and Qi, 2019), and the reverse technology spillover effect of OFDI is influenced by the institutional quality (Ran et al.,2019). However, it has also been argued that the reverse technology spillover effect of China’s OFDI has not yet emerged and is constrained by the structure of OFDI (Liang, 2019). With the rapid development of China’s OFDI, its impact on the environment of B&R countries has become a controversial issue that needs to be resolved urgently. The “pollution transfer theory” argues that Chinese enterprises, under the pressure of increasingly stringent domestic environmental regulations (Jing and Zhang, 2014), will transfer polluting industries to B&R countries, especially those with poor environmental management (Tracy et al.,2017). Further, China’s infrastructure investments can destabilize ecosystems and lead to new environmental risks for B&R countries (Teo et al., 2019). These studies are mainly theoretical in nature and are not yet supported by empirical studies. However, in fact, China’s OFDI has a positive “pollution halo” effect (Huang et al., 2020). Firstly, those projects are mainly environment-friendly projects such as information technology, and the main investors focus on well-qualified enterprises, which have a strong sense of social responsibility and high level of green technology, which will produce obvious technology spillover effect in project implementation. Secondly, China’s OFDI and the industrial structure of the B&R countries form a benign complementarity, which is in line with the industrial transformation and upgrading needs of the B&R countries and promotes the development of low-pollution and low-energy-consuming industries (Liu and Dai, 2017). Finally, there is a threshold effect of China’s OFDI, which has a significant positive impact on the green total factor productivity of the B&R countries, which is affected by the ability to internalize advanced technology. (Xue and Ge, 2019).
China’s outward foreign direct investment (OFDI) is not limited to simple currency flows but mainly the integration of resource elements, including technology, management, and systems, thus achieving the optimal allocation of production factors through industrial transfer and other methods (Huang et al., 2021). At the same time, B&R countries can also effectively learn, digest, and absorb advanced technologies, accumulate human capital, optimize industrial structure (Lei and Hong, 2019), and promote the growth of total factor productivity (TFP). In addition, the BRI runs through Asia, Europe and Africa, and there are differences in the overall economic scale, infrastructure quality and human capital accumulation among those countries, which may affect the ability of the host country to internalize Chinese advanced technologies and lead to the non-linear impact of China’s OFDI on the GTFP of the B&R countries. However, there is a paucity of research in the literature on this issue. Throughout the existing literature on GTFP in the BRI, most of them have been developed from trade opening (Qi and Xu, 2018), scientific research and innovation (Ge et al., 2017), financial development (Ge et al., 2017) and urbanization (Wu and Ge, 2019), and no scholars have yet started from China’s OFDI perspective to cut into.
How to choose a suitable theoretical perspective and research method to evaluate the green level of the countries reasonably and objectively and identify their influencing factors are yet to be studied in depth. Regarding the investment efficiency estimation method, Data Envelopment Analysis (DEA) was first proposed by Charnes and Cooper et al., in 1979, which is a non-parametric efficiency evaluation method that uses a mathematical planning model to calculate the distance between each Decision-Making Unit (DMU) and the production Frontier consisting of the best performing DMUs in practice, and further to calculate the efficiency score of each DMU. Tone (2001) proposed an SBM model considering the slack measure, which effectively overcomes the radial and angular deficiencies. Fukuyama and Weber (2009) and Fare and Grosskopf (1994), on the other hand, propose a more tractable directional distance function based on slack measures based on Tone’s study (Tone and Tsutsui, 2010; Tone and Tsutsui, 2014), which is applicable to the Luenberger productivity index analysis first proposed by Chambers in 1996. With the application and expansion of DEA analysis by domestic scholars, research on environmental performance continue to emerge. Zheng et al. (2017) used DEA model with ML index to measure the eco-efficiency of Chinese provinces, and then examined the factors influencing eco-efficiency through panel Tobit model. Fang and Xiao (2019) measured ecological efficiency of 30 Provinces in China based on the S-DEA model and analyzed the factors influencing regional eco-efficiency using spatial panel regression. Undesirable outputs, such as CO2 emissions, are inevitable in actual production processes. Therefore, one fundamental way of improving environmental efficiency is to generate desirable economic outputs whilst minimizing both inputs and undesirable outputs (Shen et al., 2019). In addition, TFP is usually regarded as an important evaluation indicator for the quality of economic growth of a country or region, but the traditional TFP measurement process ignores resource and environmental factors, which leads to bias in evaluating regional development performance, and it is advisable to refer to TFP with resource and environmental factors taken into account as green TFP. Regarding the GTFP estimation method, the Malmquist–Luenberger (ML) productivity index proposed by Chung (1997) has been widely applied in the previous studies. Wang and Wu, (2011) adopted the super-efficiency SBM model, emphasizing the dual objectives of economic production and environmental quality, with energy and carbon emissions as inputs, to measure the ecological efficiency and its temporal and spatial differences in East, West and Northeast China. Han et al. (2014) constructed a systematic GMM model, and a threshold panel model based on the SBM function to empirically investigate the spatial and temporal impact paths of environmental regulations on industries with heterogeneous pollution emissions, technology levels, and production cycles. Liu and Zeng (2018) adopted the Meta-Frontier-GML index method to measure the GTFP of 47 B&R countries based on data from 2003 to 2012. It is found that the GTFP in Central and Eastern Europe, Southeast Asia and CIS region is relatively high. Ran et al. (2019) revised the traditional TFP by constructing a comprehensive index of the discharges of industrial wastewater, industrial waste gas, and industrial solid waste (“three wastes”) as undesirable output. Dong et al. (2019) measured and decomposed GTFP by using SBM function and ML index considering environmental pollution indicators under the constant constraint of return to scale.
A review of the literature reveals that there is room for improvement in the study of China’s green investment efficiency in B&R countries. First, most of the existing studies focus on countries in a certain region, lacking green investment efficiency analysis based on the whole B&R region. Second, existing studies generally adopt the DEA method, which only stays at the level of static analysis of investment efficiency, lacking dynamic analysis decomposition of national investment dynamic efficiency research, thus failing to scientifically reflect the differences in investment as well as technical output contribution. Based on this, this paper will be improved in two aspects: first, to expand the vision of overall investment efficiency research, select the whole Belt and Road region, including 47 countries with complete data as research objects, comprehensively explore the current situation of China’s green investment in B&R countries, systematically analyze the input and output problems, and propose corresponding strategies according to local conditions. It is an important reference for narrowing the green development gap of the B&R and solving the problems of unbalanced regional development. Secondly, we break through the single logical idea of traditional investment efficiency measurement and choose DEA-SBM model and Malmquist index method to conduct empirical research from a single investment process to an inter-period multidimensional input-output process, analyze the key factors affecting overall green investment efficiency based on previous research deficiencies, and comprehensively quantify the level of green investment efficiency and influencing factors.
3 Methodology and Data
3.1 Research Setting and Sample
To calculate the efficiency of China’s green investment in B&R countries, this study constructs a set of production possibilities including input, desirable output, and undesirable output items. First, based on the static view perspective and using the SBM-Undesirable model, we analyse the general characteristics and country differences of green investment efficiency. Then, based on the dynamic perspective and using the Malmquist index method, we also analyse the dynamic evolution characteristics of China’s green investment efficiency in B&R countries in time and space dimensions and then discuss the change in TFP in B&R countries from three aspects: total factor productivity, efficiency change, and technological progress.
3.2 Methods
3.2.1 The Slacks-Based Measure Model
DEA has become the most mainstream method for measuring production efficiency because it can consider multiple inputs and outputs simultaneously and does not require a specific functional form. (Sun et al., 2020). However, the traditional DEA model cannot deal with efficiency issues that include undesirable outputs. Then, a Slacks-Based Measure (SBM) model based on relaxation measures was proposed by Tone in 2001, which can solve the efficiency evaluation problem including undesired outputs.
Suppose there are
Matrixes
At the same time, Tone defines indicator ρ as follows:
Thus, the SBM model is defined as (Tone 2001):
s.t:
To measure the effect of negative externalities on efficiency, such as environmental factors, the SBM-Undesirable model, was proposed by Tone in 2003.
The production possibility set is closed and bounded, so input and output can be disposed freely. When
s.t:
3.2.2 The Malmquist Index
The Malmquist index is a nonparametric method based on a distance function compared to the effective Frontier, which can be regarded as the distance between a certain production point and the optimal production point. Fare et al. (1994) transformed the Malmquist index from a theoretical index to an empirical index based on the DEA method proposed by Charnes et al., 1979 et al. Since then, the Malmquist index has been widely used in the analysis of input and output. According to D.W. Caves et al. (1982), it can be expressed as follows:
where
According to R. Fare, S. Grosskopf, B. Lindgren and P. Roos, Eq. 7 can be further decomposed into two parts (hereinafter referred to as FGLR decomposition), as follows:
That is,
where
The Malmquist index measures the dynamics of total factor productivity of green investment from period t to period t + 1. When M > 1, it indicates an increase in total factor productivity, and vice versa. TECFGLR (·) is the efficiency change (EC) index under the condition of fixed return to scale, which measures the degree of change in the relative technical efficiency of the DMU from period t to period t + 1, that is, the catch-up change to the technological Frontier, also known as the “Frontier movement effect” (Jamaluddin and David, 1997). When EC > 1, the relative efficiency of the DMU is improved in period t + 1 compared to period t; that is, a higher output level can be achieved under the same level of input factors, and vice versa. TCFGLR (·) is a technological progress (TC) index that measures the movement of the technological Frontier from period t to t + 1, also known as the “technological Frontier movement effect” (Jamaluddin and David, 1997), which reflects the impact of changes in relevant production technology levels on the investment efficiency index. When TC > 1, it indicates technological progress, that is, the technological Frontier has expanded, and vice versa.
The discussion above is carried out under the condition of fixed returns to scale. In the case of variable returns to scale, according to R. Fare, S. Grosskopf, M. Norris and Z. Zhang (1994) further decomposed the index into two parts, efficiency change (EC) and technical change (TC), of which EC can be further decomposed into the pure technical efficiency index (PEC) and scale efficiency index (SEC), hereinafter referred to as FGNZ decomposition, with the following expression:
Therefore, Eq. 8 can be further decomposed into:
That is,
When TFP >1, it means that the production efficiency is improved, and vice versa.
3.3 Data
Based on the relevant research literature and considering practicality, follow the principles of relevance and appropriateness, and combine the relevance of indicators and data accessibility, we select the data of 47 B&R countries excluding Maldives, Bhutan, Turkey, Egypt, Syria, Palestine, and Romania during 2010–2018 as the study sample As is shown in Table 1. And according to the 2018–2019 country classification by income level provided by the World Bank, these 47 countries are classified into four major categories: low-income countries, lower-middle-income countries, upper-middle-income countries, and high-income countries.

TABLE 1. The classification of B&R countries.
It should be noted that null values are not allowed to ensure the overall objectivity of the evaluation objects while considering the availability of data. However, due to the limitations of the DEA model, the input indicators should be no less than the output indicators (Yang and Wei, 2021), the input-output model is shown in Figure 3. Thus, a low-carbon development efficiency evaluation system is established. The input-output indicator system is shown in Table 2.
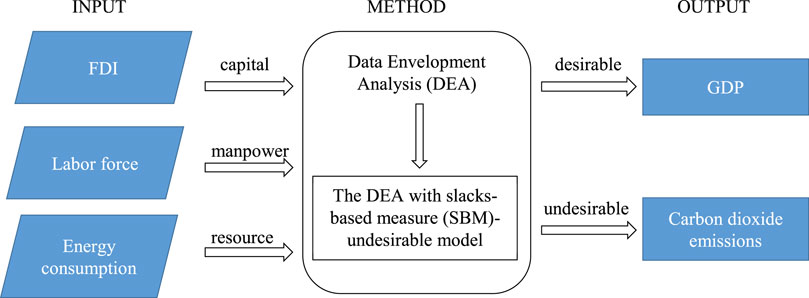
FIGURE 3. Schematic diagram of SBM input and output.

TABLE 2. The measurement indicators system.
The inputs and outputs are explained as follows:
1) Labor: the year-end employment of each country, obtained from Word Bank.
2) Capital: Since official data on capital stock cannot be obtained directly, we estimate capital stock by the stock of China’s FDI in each country, sourced from the Statistical Communique of China’s Outbound Investment 2019.
3) Energy consumption: energy consumption of each country, including coal usage, crude oil usage, refined oil usage, natural gas usage, wind energy, solar energy, electricity consumption, and biofuels, etc. obtained from the International Energy Agency.
4) Desirable output (GDP): the gross domestic product of each country is chosen as the proxy for the desirable output at the constant price of 2000, obtained from Word Bank.
5) Undesirable output (CO2): the carbon dioxide emissions of each country, obtained from the Word Bank.
Table 3 represents the summary statistics of the input and output indicators for the study. There is a considerable gap between the minimum and maximum values among all the regions’ capital and labour indicators during the study period. The wide gap observed in the summary statistics may highlight differences in the level of green development across the region.

TABLE 3. Descriptive statistics of input and output variables.
4 Results and Discussion
4.1 The Result of Green Investment Efficiency
This segment provides the description of the findings of the DEA and green investment efficiency. We adopt the SBM-undesirable model to measure the green investment efficiency of China in B&R countries between 2010 and 2018. Table 4 shows the results, ignoring the effects of random errors. It can be seen that the efficiency of green investment has generally shown an upward trend, with the highest efficiency value in 2016. In 2016, for example, Singapore, Qatar, Lebanon, Israel, Bahrain, Yemen, Estonia, Latvia, the Czech Republic and Slovakia, had high green investment efficiency with an efficiency value equal to 1. However, the average investment efficiency has not reached the optimal level. The low level of comprehensive green investment efficiency indicates that the waste of resources and environmental pollution are still relatively serious, and the efficiency of energy use needs to be further improved.
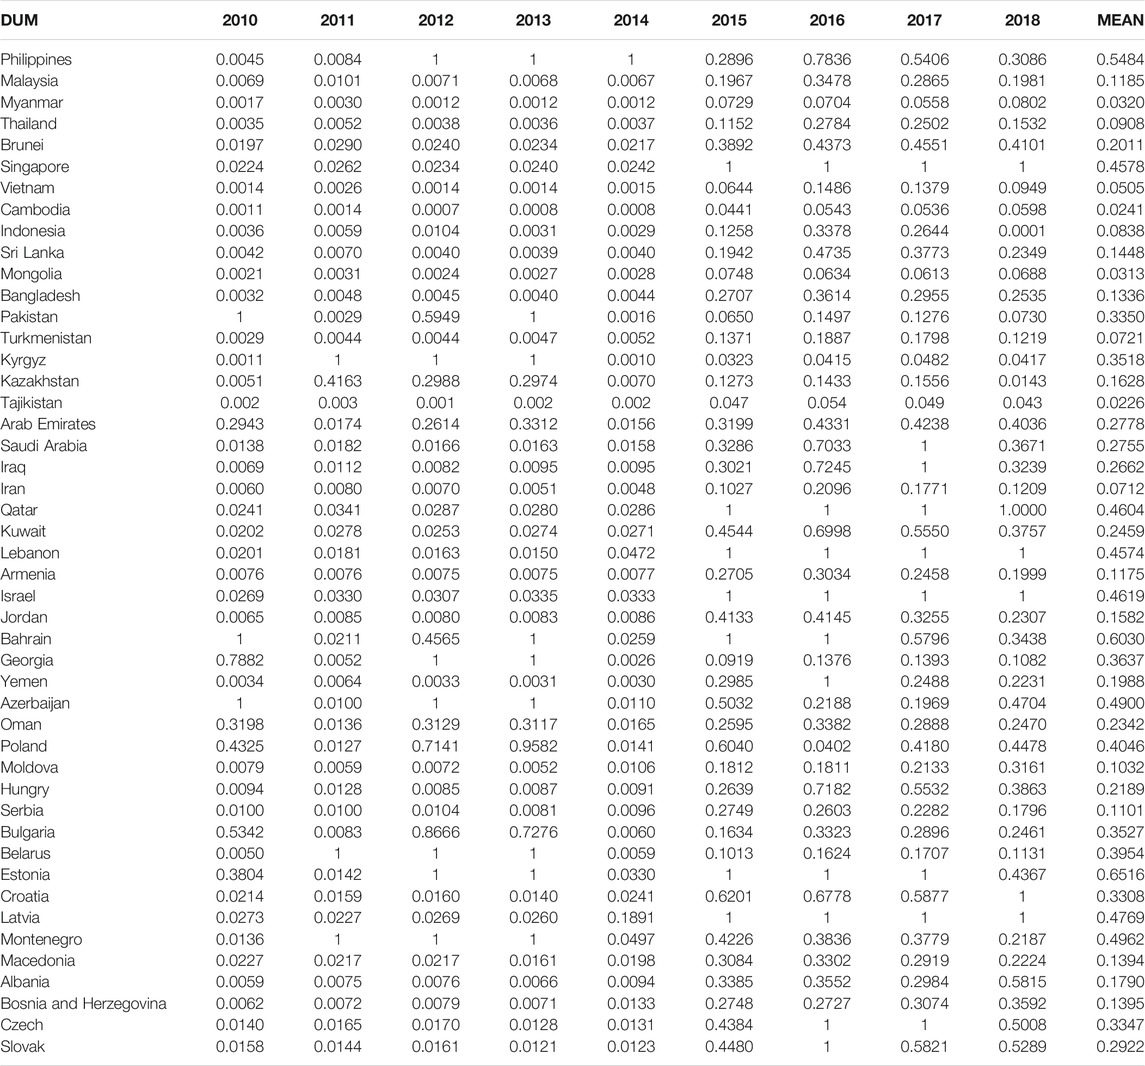
TABLE 4. Measurement results of green investment efficiency.
As shown in Figure 4, the efficiency of green investment in B&R countries has recently shown a stable upward trend, with a small drop in the efficiency values in 2014, followed by a significant increase. Those countries are classified into four major categories: low-income countries, lower-middle-income countries, upper-middle-income countries, and high-income countries. The green investment efficiency of high-income countries is the highest, followed by upper-middle-income countries, and the investment efficiency of lower-middle and low-income countries is relatively low. The green investment efficiency of high-income, lower-middle-income, and upper-middle-income countries all showed a significant increase during 2011–2013, while that of low-income countries was very low from 2010 to 2014. However, the green investment efficiency of both high-income and low-income countries showed a huge increase from 2014 to 2016, and the overall investment efficiency of all countries decreased slightly from 2016 to 2018, with the largest decrease in low-income countries. In general, there is still a huge space to improve the efficiency of green investment in B&R countries, and there is a large regional difference.
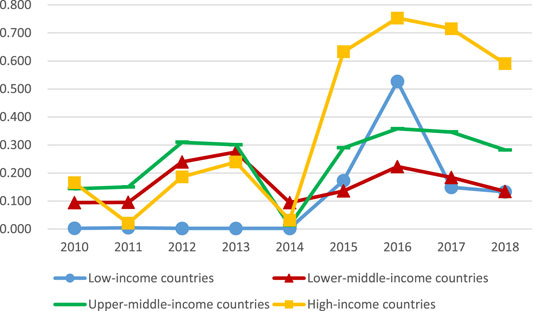
FIGURE 4. Green investment efficiency by category in B&R countries.
TE measures whether B&R countries utilize China’s investment in an optimal way or at the most appropriate scale, reflecting the effectiveness of China’s green investment, showing that the area can obtain the maximum output under the current factor input scale and combination structure through the current production technology, production organization and management of green investment.
Pure technical efficiency (PTE) is mainly related to factors such as production methods, production processes, technology and equipment levels, and organizational management levels. The area where the PTE is equal to 1 is the technical effectiveness area, showing that the area can obtain the maximum output under the current factor input scale and combination structure through the current production technology, production organization and management of green investment.
The scale effect (SE) is closely related to the factor input scale and its social allocation and combination level. The region with scale effectiveness equal to 1 is scale effectiveness, that is, marginal output equals marginal input, indicating that all kinds of resources can be effectively allocated and used in the region under the current factor input and production scale.
As shown in Table 5, the TE of relatively economically developed areas, the countries in Southeast Asia and Central and Eastern Europe, such as the Philippines (0.5484), Singapore (0.4578), Poland (0.4046), Estonia (0.6516) and Montenegro (0.492), have not yet reached the best production Frontier, indicating that although B&R countries attach great importance to green development, still do not utilize China’s investment in an optimal way or at the most appropriate scale.
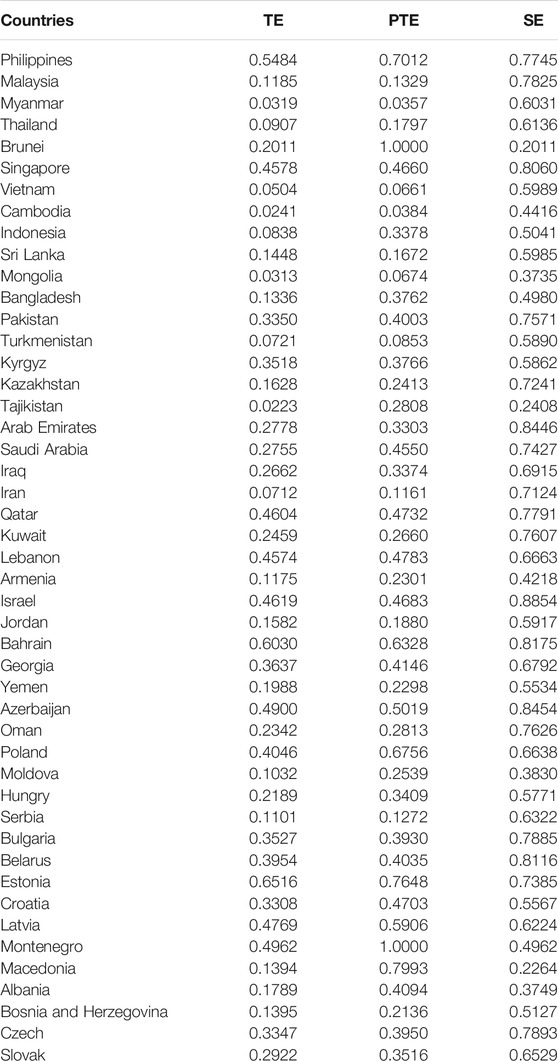
TABLE 5. Estimated results of green investment efficiency.
As shown in Figure 5, the average value of SE is less than 1, indicating that with the current factor inputs and production scale, all kinds of resources can still be inefficiently allocated and utilized in the region. The average value of PTE is far less than 1, indicating that the region cannot obtain the maximum output with the existing factor input size and mix structure through the existing green investments in production technology, production organization and management. The ability of Chinese companies to adapt to the market environment of B&R countries still needs to be strengthened. These results show that B&R countries all demonstrate inefficiency, among which that of Central Asia is particularly severe, indicating that there is still much room for improvement in the input or output level of factors.
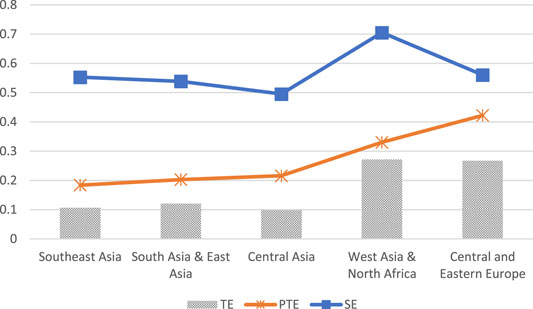
FIGURE 5. Green investment efficiency and its decomposition trend.
To compare the differences in the green investment efficiency in various countries, according to the classification of the existing research results (Zhao et al., 2010), since the investment efficiency measured by the DEA model belongs to relative efficiency, which is dimensionless and has a value range of 0–1, the three types of investment efficiency of each country can be compared with the mean value to determine their relative status in B&R countries, and the green investment efficiency can be divided into four types, as shown in Table 6.

TABLE 6. Types of green investment efficiencies.
The first category refers to “high–high–high” development areas. In this type of area, technical factors and management factors have been fully utilized, and TE has reached or approached the best production Frontier (comparatively). From the above analysis results, there are fifteen such countries, mainly in Southeast Asia, West Asia and Central and Eastern Europe.
The second category refers to “low–high–low” development areas. Countries of this type have a high contribution of PTE but a low contribution of SE. The key to improving development efficiency in these areas is to further improve management elements that can bring SE. Examples of this type include Brunei Bangladesh, North Macedonia, and Albania, showing that the efficiency of green investment in those countries depends more on the technology effect than the scale effect.
The third category refers to “low–low–high” development areas. Countries in this category have a low contribution of PTE but a high contribution of SE. Six countries were classified as this type, showing that the efficiency of green investment in those countries depends more on the scale effect than on the technology effect.
The fourth category refers to “low–low–low” development areas, which were characterized by low comprehensive TE, low production technology, and insignificant scale effects. There were fifteen countries of this type.
4.2 Malmquist Index Analysis
This study applies the Malmquist Index to examine investment efficiency in a panel of 47 countries. For each pair of adjacent years, measures of technical efficiency change, technical change and total factor productivity change have been calculated for each DMU. Only relevant sections of the results are presented in this research as there are a lot of computer output (Sun Y et al., 2020).
Table 7 displays the mean technical efficiency change, technical change, and total factor productivity change for all the countries under study from 2010 to 2018. Based on the DEA-Malmquist model, the MI is further decomposed to explore the main driving components of its dynamic changes. EC represents the index of change in efficiency change, which refers to the ratio of the actual output level to the potential maximum output level of the B&R countries at a certain amount of factor input level, which shows the ability of the countries to obtain the maximum potential production under the condition of certain input factors. TC represents the index of change in technological progress, which reflects the impact of changes in the relevant level of production technology on the investment efficiency index.
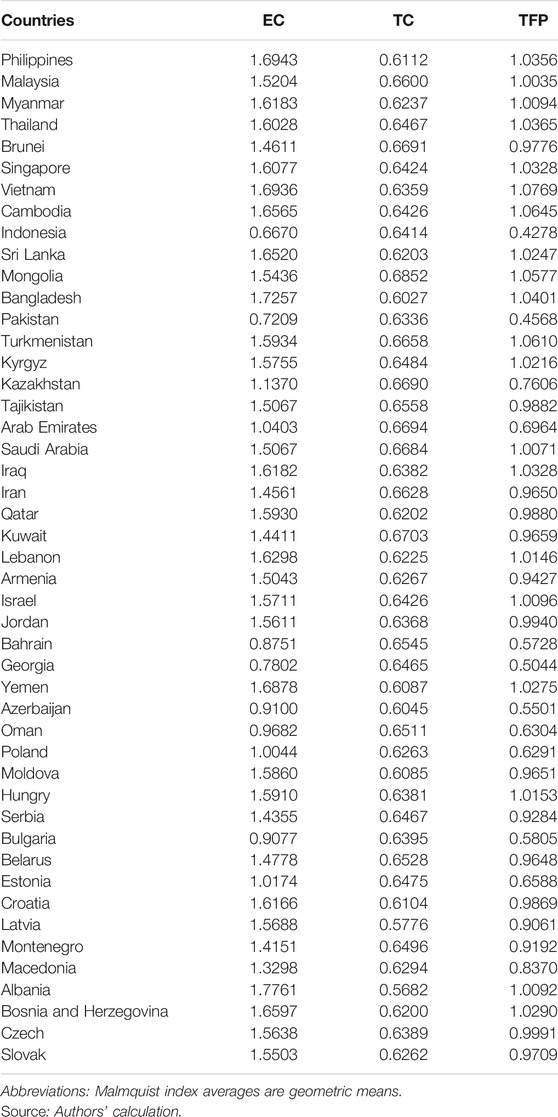
TABLE 7. Average productivity growth.
As shown in Table 7, Vietnam, Cambodia and Turkmenistan are countries with highest total factor output growth. Vietnam recorded an 7.7% average increase in total factor output attributable to a 69.4% increase in efficiency change. Indonesia, Pakistan, and Georgia, however, are countries with the least total factor output. Indonesia experienced a 57.2% decline in total factor output due to a 33.3% decline in the mean efficiency scores and a 35.9% decline in technical scores over the period. From the perspective of the average value of MI, that of Southeast Asia, South Asia, East Asia and Central and Eastern Europe is greater than 1, indicating that the overall productivity of these regions has increased, and of Central Asia, West Asia and North Africa is less than 1, especially the use efficiency of production inputs in Central Asian countries needs to be improved. The average value of the MPI from 2010 to 2018 was 0.845, which is less than 1, indicating that the growth rate of the efficiency of China’s green investment in B&R countries declined and that there is still much room for improvement in resource use efficiency. Over the entire sample period, the mean value of EC is greater than 1, indicating that the desirable output (GDP) increases, and the undesirable output (CO2 emissions) decreases in B&R countries due to their own technological progress or the lower cost of China’s investment.
As shown in Table 8, all the regions recorded growths in efficiency changes over the period. The value of EC is greater than 1 throughout the sample period. South Asia reported the highest average efficiency changes of about 45.6%. However, all the regions recorded declines in total factor productivity changes as well as technical changes. West Asia and North Africa reported the hugest decline, 18.8% decline in total factor output due to a 35.9% decline in technical scores over the period.
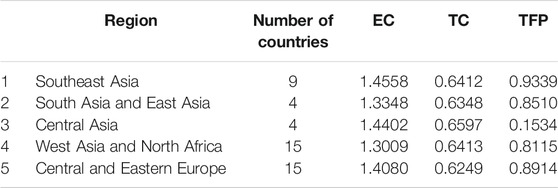
TABLE 8. Average regional productivity changes (2010–2018).
Figure 6 shows the trends of technical change, efficiency change and total factor productivity change for regions during the years under study. Average total factor productivity change is attributable to the average decrease in technical change more than to the average growth in efficiency change in all regions. The technical change has therefore, been the predominant driver in global total factor productivity decline over the period.
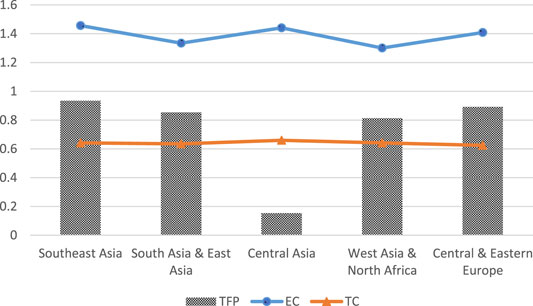
FIGURE 6. Regional productivity changes.
5 Conclusion and Policy Implications
5.1 Main Conclusion
This study examines China’s green investment efficiency in B&R countries from 2010 to 2018 using the SBM-Undesirable model and Malmquist total factor productivity index with labour, capital and energy consumption as inputs and GDP and carbon emission as desirable and undesirable output respectively to analyse the topic from both static and dynamic perspectives, as well as provides an in-depth analysis of the differences, changes, and influential factors in the regional coordination of industries with the environment. The following conclusions and policy implications may be extrapolated:
From a static analysis of green investment efficiency, we find that the overall green investment efficiency has generally maintained an upward trend but not reached 1, indicating that the efficiency of China’s green investment in B&R countries is still not at its best, which show that most of the Chinese enterprises investing in the region have not been able to better adapt to the investment environment of the B&R countries or actively integrate into the local market. The average value of SE is less than 1, indicating that China’s input of resources to those countries has not yet reached the optimal allocation. There are still many wasted investments and there is room for improvement in the optimization and improvement of the scale of green investment. In terms of decision-making technology, Chinese enterprises should also make adjustments as soon as possible to improve the efficiency of green investment with PTE less than 1. From the perspective of dynamic analysis of total factor productivity, the average total factor productivity change is attributable to the average decrease in technical change more than to the average growth in efficiency change in all regions, indicating that the main driving force of the decline in total factor productivity comes from technical change. This result implies that in order to promote green investment efficiency, it is more effective and appropriate to invest in environmental-related technologies than policies that aim to keep up with the global Frontier technology.
5.2 Policy Implication
Based on the above empirical results, some implications are proposed as follows:
1. The scale of green investment should be adjusted to create a global green value chain. 1) For Africa and Central Asia, scale up investment. In response to the huge investment gap in transportation and infrastructure in Central Asia and Africa, we should accelerate the delivery of China’s excellent green products and advantageous effective production capacity, expand the number of high-quality sustainable projects in green energy, clean energy, green buildings and wastewater treatment on both sides, and build “China’s business card” with high standards and quality. 2) For the Central and Eastern Europe region, maintain the steady development of the current investment scale. Focus on promoting technical cooperation with Central and Eastern Europe in the field of green science and technology and green standards, accelerate the speed of transformation and application of achievements in the field of sustainable development such as resource-saving, environment-friendly, safe, and efficient on both sides, and enhance the technology spillover effect. 3). For Southeast and South Asia, moderately reduce the scale of green investment. Green investment in the region should focus on playing a leading role in green technologies and reducing investment in high-emission, energy-consuming areas such as thermal power and copper and iron smelting. Expand high-quality cooperation in low-carbon areas such as high-speed rail and communications with key countries such as Malaysia and Indonesia to promote the optimization and upgrading of economic structures and green development in the region.
2. The domestic green governance system should be coordinated to promote and reshape the green governance cooperation model. A reasonable environmental regulation policy can effectively enhance the technological innovation capacity of each region and promote economic growth while reducing environmental pollution. China should raise the green threshold for export technologies and reshape the green governance cooperation model according to the different levels of economic and social development of the B&R countries. In cooperation with countries at a lower level of economic development, the fiscal expenditure level of local governments should be appropriately increased by green investment and green financial cooperation, especially to strengthen green financial cooperation with such governments for environmental pollution control. When cooperate with countries at a higher level of economic development, we can introduce and exchange their experience in green governance by establishing cooperation mechanisms for green governance policies. At the same time, promote the establishment of a coordination mechanism for environmental protection, conduct performance assessment of sustainable development levels, and establish a consultation model for green governance cooperation in the construction of green infrastructure and green investment.
3. The green science and technology cooperation should be strengthened to enhance technical efficiency and promote technological progress. China can cooperate by way of green investment through continuous improvement of its production process to promote technical efficiency, take the “Made in China 2025 policy” as an opportunity to internalize the upgrading requirements of green transformation and environmental standards embedded in the process of manufacturing in China, promote China’s green technology standards, green technology products can be promoted out and jointly enhance sustainable development. The sustainable development information sharing and think tank platform should also be established in conjunction with existing international and regional organization cooperation mechanisms to jointly negotiate and improve green technology standards, promote the common upgrading of technology levels, and play the driving role of technological progress in enhancing sustainable development levels. New technologies such as artificial intelligence, satellite monitoring and big data will be used to real-time monitoring of the global carbon emissions of key projects and promote the construction of the ecological and environmental protection big data service platform.
4. The green capital chain should be supported. Strengthen the support and leadership of green financing for green investment, establish the Belt and Road Green Investment Fund, give full play to the synergy effect of its complementary advantages with bilateral and multilateral development funds and domestic financial institutions, and support green investment in countries and regions along the route in all aspects. For the key green investment projects and the green industrial chain formed around them, we will provide more choices of financing tools for green investment and build a green capital chain that “green financing supporting and leading green investment, and green investment returning to green financing”.
Data Availability Statement
The original contributions presented in the study are included in the article/Supplementary Material, further inquiries can be directed to the corresponding author.
Author Contributions
QL: Conceptualization, Methodology, Writing–Review and Editing Supervision; WT: Writing–Original Draft, Data Curation, Formal analysis; The corresponding author is responsible for ensuring that the descriptions are accurate and agreed by all authors.
Conflict of Interest
The authors declare that the research was conducted in the absence of any commercial or financial relationships that could be construed as a potential conflict of interest.
Publisher’s Note
All claims expressed in this article are solely those of the authors and do not necessarily represent those of their affiliated organizations, or those of the publisher, the editors, and the reviewers. Any product that may be evaluated in this article, or claim that may be made by its manufacturer, is not guaranteed or endorsed by the publisher.
References
Caves, D. W., Christensen, L. R., and Diewert, W. E. (1982). The Economic Theory of Index Numbers and the Measurement of Input, Output, and Productivity. Econometrica 50 (6), 1393–1414. doi:10.2307/1913388
Charnes, A., Cooper, W. W., and Rhodes, E. (1979). Measuring the Efficiency of Decision-Making Units. Eur. J. Oper. Res. 2 (6), 429–444. doi:10.1016/0377-2217(78)90138-810.1016/0377-2217(79)90229-7
Chung, Y. H., Färe, R., and Grosskopf, S. (1997). Productivity and Undesirable Outputs: A Directional Distance Function Approach. J. Environ. Manage. 51, 229–240. doi:10.1006/jema.1997.0146
Färe, R., and Grosskopf, S. (1994). Measuring Productivity: a Comment. Int. Jrnl Op Prod. Mnagemnt 14 (9), 83–88. doi:10.1108/01443579410066802
Färe, R., Grosskopf, S., and Norris, M. (1994). Productivity Growth, Technical Progress, and Efficiency Change in Industrialized Countries. Am. Econ. Assoc. 84 (1), 66–83.
Feng, H. L. (2003). Does Foreign Direct Investment Harm the Host Country's Environment?. Evidence from China [EB/OL]Available at: https://ssrn.com/abstract=1479864.
Frankel, J. A. (2003). The Environment and globalization[R]. New York, NY: National Bureau of Economic Research.
Ge, P. F., Xu, Z. Y., and Huang, X. L. (2017). Green Total Factor Productivity in “Belt and Road” Countries: An Empirical Study [J]. Int. Trade Issues (09), 48–58. doi:10.13510/j.cnki.jit.2017.09.005
Grossman, G. M., and Krueger, A. B. (1995). Economic Growth and the Environment. Q. J. Econ. 110 (2), 353–377. doi:10.2307/2118443
Grossman, G. M., and Krueger, A. B. (1991). Environmental Impacts of a North American Free Trade agreement[R]. New York, NY: National Bureau of Economic Research.
Gu, J. J., Zheng, Q., and Xiao, D. (2020). Spatial Correlation Analysis of FDI and Environmental Pollution in China in the Context of green Development[J]. Macroeconomic Res. 66 (9), 119–129.
Hou, X., Liu, J., and Zhang, D. (2019). Regional Sustainable Development: The Relationship between Natural Capital Utilization and Economic Development. Sustain. Dev. 27 (1), 183–195. doi:10.1002/sd.1915
Hu, J., Zhang, W. Q., and Xing, F. (2018). Research on Measuring and Evaluating the Economic and Social Development Level of “Belt and Road” Countries: an Analysis Based on the Data of Indicators of 64 Countries along the Silk Road [J]. Stat. Inf. Forum 33 (6), 43–53.
Hu, M., and Zheng, W. (2021). Research on the Efficiency of China's Direct Investment in ASEAN—Based on DEA Model [J]. J. Shanxi Univ. (Philosophy Soc. Sci. Edition) 44 (03), 142–152. doi:10.13451/j.cnki.shanxi.univ(phil.soc.).2021.03.018
Huang, L., and Wu, C. Q. (2021). Foreign Investment, Environmental Regulation, and green Development Efficiency of Cities in Yangtze River Economic Zone[J]. Reform 38 (3), 94–110.
Huang, T. H., Hu, X. Y., Chen, S. F., Wang, Y., and Zhang, B. Q. (2020). Evaluation of Sustainable Development Level and its Influencing Factors in Countries along the Belt and Road--Empirical Evidence Based on Super-SBM Model and Tobit Model[J]. China Population-Resources Environ. 30 (12), 27–37. doi:10.12062/cpre.20200901
Huang, X. L., Han, X. F., and Ge, P. F. (2017). Spatio-temporal Evolution and Influence Mechanism of green Total Factor Productivity in “Belt and Road” Countries [J]. Econ. Manag. 39 (09), 6–19.
Jamaluddin, M. Y., and David, H. (1997). The Efficiency of the National Electricity Board in Malaysia: an Intercountry Comparison Using DEA. Energy Econ 19, 255–269. doi:10.1016/S0140-9883(96)01018-3
Jia, N. S., and Lei, H. Z. (2019). China’s OFDI and Industrial Upgrading in Countries along the "Belt and Road" -Impact Mechanism and Empirical Test[J]. Econ. Sci. (01), 44–56. doi:10.12088/PKU.jjkx.2019.01.04
Jing, W., and Zhang, L. (2014). Environmental Regulation, Openness to the outside World and green Technological Progress of Chinese Industry[J]. Econ. Res. 60 (9), 34–47.
Li, J. K., and Zhang, R. (2021). Research on the Influence Mechanism of Big Data Capability on green Competitiveness of Manufacturing Industry from the Perspective of Environmental Dynamism-Based on SBM-GML index model[J/OL]. Sci. Tech. Prog. Countermeasures. http://kns.cnki.net/kcms/detail/42.1224.g3.20211112.1549.012.html.
Liang, S. R. (2019). The Dynamic Effect of International R&D Capital Technology Spillover on the Efficiency of green Technology Innovation[J]. Sci. Res. Manag. 40 (3), 21–29. doi:10.19571/j.cnki.1000-2995.2019.03.003
Liu, N. Q., and Dai, J. (2017). Environmental Effects of China’s OFDI to Countries along the "Belt and Road"[J]. Econ. Manag. 33 (12), 6–23. doi:10.19616/j.cnki.bmj.2017.12.001
Malmquist, S. (1953). Index Numbers and Indifference Surface[J]. Trabajos de Estadística 4 (2), 9–142. doi:10.1007/bf03006863
Nie, M. H., and Qi, H. (2019). Can Foreign Direct Investment Enhance the Efficiency of green Innovation in Chinese Industry: A Perspective Based on Innovation Value Chain and Spatial Association[J]. World Econ. Res. 38 (2), 111–122.
Panayotou, T. (1993). Empirical Tests and Policy Analysis of Environmental Degradation at Different Stages of Economic Development. Geneva: International Labour Organization ILO Working papers.
Ran, Q., and Wu, H. T. (2019). OFDI Reverse Technology Spillover, Institutional Quality and Regional Innovation Capacity-Aan Empirical Analysis Based on a Two-step Differential GMM Threshold Panel Model[J]. Sci. Tech. Prog. Pol. 36 (7), 46–53. doi:10.6049/kjjbydc.2018090529
Shao, C. D., Su, D. N., and Yang, Q. (2021). Environmental Effects of Foreign Investment Entry on Local Firms in Host Countries: Evidence from China[J]. World Economy 44 (3), 32–60.
Shen, J., Wang, S., Liu, W., and Chu, J. (2019). Does Migration of Pollution-Intensive Industries Impact Environmental Efficiency? Evidence Supporting "Pollution Haven Hypothesis". J. Environ. Manage. 242, 142–152. doi:10.1016/j.jenvman.2019.04.072
Sheng, B., and Lv, Y. (2012). The Impact of Foreign Direct Investment on China’s Environment: an Empirical Study from Industrial Sector Panel Data[J]. China Soc. Sci. 33 (5), 54–75.
Sun, H., Kporsu, A. K., Taghizadeh-Hesary, F., and Edziah, B. K. (2020). Estimating Environmental Efficiency and Convergence: 1980 to 2016. Energy 208, 118224. doi:10.1016/j.energy.2020.118224
Sun, Y., Chen, L., Sun, H., and Taghizadeh-Hesary, F. (2020). Low-carbon Financial Risk Factor Correlation in the Belt and Road PPP Project. Finance Res. Lett. 35, 101491. doi:10.1016/j.frl.2020.101491
Taylor, M. S. (2005). Unbundling the Pollution haven Hypothesis [J]. The B.E. J. Econ. Anal. Pol. 3 (2), 1–28. doi:10.2202/1538-0637.1408
Teo, H. C., Lechner, A. M., Walton, G. W., Chan, F. K. S., Cheshmehzangi, A., Tan-Mullins, M., et al. (2019). Environmental Impacts of Infrastructure Development under the Belt and Road Initiative. Environments 6 (6), 72–93. doi:10.3390/environments6060072
Tian, H. B., and Hao, W. W. (2020). FDI, Environmental Regulation and green Innovation Efficiency[J]. China Soft Sci. 35 (8), 179–188.
Tone, K., and Tsutsui, M. (2014). Dynamic DEA with Network Structure: a Slacks-Based Measure Approach. Omega 42 (1), 124–131. doi:10.1016/j.omega.2013.04.002
Tone, K., and Tsutsui, M. (2010). Dynamic DEA: A Slacks-Based Measure Approach☆. Omega 38 (3-4), 145–156. doi:10.1016/j.omega.2009.07.003
Tracy, E. F., Shvarts, E., Simonov, E., and Babenko, M. (2017). China's New Eurasian Ambitions: the Environmental Risks of the Silk Road Economic Belt. Eurasian Geogr. Econ. 58 (1), 56–88. doi:10.1080/15387216.2017.1295876
Wang, E. X., and Wu, C. Y. (2011). A Study of Inter-provincial Spatial and Temporal Differences in Eco-Efficiency in China Based on Super-efficiency DEA Model[J]. J. Manag. 8 (03), 443–450.
Wei, Y., Li, Y., and Wu, M. (2019). Progressing Sustainable Development of “The Belt and Road”: Estimating Environmental Efficiency Based on the Super-slack-based Measure Model [J]. Sustain. Dev. (9), 1–19. doi:10.1002/sd.2006
Xue, F., and Ge, P. F. (2019). The Impact of Chinese OFDI on green Total Factor Productivity in Countries along the Belt and Road[J]. J. Shanghai Univ. Finance Econ. (6), 96–110. doi:10.16538/j.cnki.jsufe.2019.06.007
Yang, L., and Wei, Q. F. (2021). Regional R&D Efficiency Evaluation Based on Super Efficiency DEA and Malmquist index-a Comparative Study of Four national city clusters[J/OL]. Sci. Tech. Prog. Countermeasures, 1–10. http://kns.cnki.net/kcms/detail/42.1224.g3.20211101.0918.004.html.
Zhao, Y., Hao, L., and Yang, Z. (2010). Regional Differentiation of Energy Efficiency and its Causes in Jiangsu. CATA Geographical Sinica 65 (008), 919–928. doi:10.11821/xb201008003
Keywords: “The Belt and Road”, green investment efficiency, SBM-undesirable model, Malmquist index, total factor productivity
Citation: Lan Q, Tang W and Hu Q (2022) Estimation of China’s Green Investment Efficiency in Belt and Road Countries -Based on SBM-Undesirable Model and Malmquist Index Model. Front. Energy Res. 9:802946. doi: 10.3389/fenrg.2021.802946
Received: 27 October 2021; Accepted: 02 December 2021;
Published: 18 January 2022.
Edited by:
Hong-zhou Li, Dongbei University of Finance and Economics, ChinaCopyright © 2022 Lan, Tang and Hu. This is an open-access article distributed under the terms of the Creative Commons Attribution License (CC BY). The use, distribution or reproduction in other forums is permitted, provided the original author(s) and the copyright owner(s) are credited and that the original publication in this journal is cited, in accordance with accepted academic practice. No use, distribution or reproduction is permitted which does not comply with these terms.
*Correspondence: Qiao Hu, MzgzMDAwMjc2QHFxLmNvbQ==