 Pablo A. García-Salaberri
 Arturo Sánchez-Ramos
 Prodip K. Das
- 1Department of Thermal and Fluids Engineering, University Carlos III of Madrid, Leganés, Spain
- 2School of Engineering, Newcastle University, Newcastle, United Kingdom
A high advancement has been achieved in the design of proton exchange membrane fuel cells (PEMFCs) since the development of thin-film catalyst layers (CLs). However, the progress has slowed down in the last decade due to the difficulty in reducing Pt loading, especially at the cathode side, while preserving high stack performance. This situation poses a barrier to the widespread commercialization of fuel cell vehicles, where high performance and durability are needed at a reduced cost. Exploring the technology limits is necessary to adopt successful strategies that can allow the development of improved PEMFCs for the automotive industry. In this work, a numerical model of an optimized cathode CL is presented, which combines a multiscale formulation of mass and charge transport at the nanoscale
1 Introduction
The development of thin-film catalyst layers (CLs) at Los Alamos National Laboratory (LANL) at the beginning of the 90s (thickness, δcl ≈ 50–100 μm) was a breakthrough in proton exchange membrane fuel cells (PEMFCs). The replacement of microstructures that worked with liquid electrolytes based on Pt black catalyst and polytetrafluoroethylene (PTFE) binder by microstructures based on Pt/C catalyst and ionomer (Nafion) dramatically increased catalyst utilization, decreasing Pt loading from LPt = 4 mgPt cm−2 to LPt = 0.4 mgPt cm−2 (Wilson and Gottesfeld, 1992). However, Pt loadings around LPt = 0.4 mgPt cm−2 are still the commercial standard, since a further reduction of the Pt loading has been difficult since then due to performance and durability issues (Kongkanand and Mathias, 2016; Nguyen et al., 2021; Tellez-Cruz et al., 2021). Losses are more important at the cathode due to the sluggish kinetics of the oxygen reduction reaction (ORR) and lower diffusivity of oxygen compared with the fast kinetics of the hydrogen oxidation reaction (HOR) and high diffusivity of hydrogen (Garcia-Salaberri, 2022). Concern about this situation has increased in the last decade as PEMFCs are reaching their commercialization stage, especially in the automotive sector, where they compete with other technologies (internal combustion engine and Li-ion battery) (Atanassov et al., 2021). Recent targets set by the U.S. Department of Energy (DOE) for fuel cell vehicles to make PEFC technology competitive have been hardly met (Wang et al., 2020a). The Toyota Mirai presented in 2018 showed limited durability of 3,000 h in a real-world driving test and failed largely in a DOE accelerated stress test (AST) protocol. The performance decreased significantly after 5,000 cycles with a cathode CL thickness reduction from approximately 10 μm–3 μm (Borup et al., 2018). Recently, an assessment performed by a team of experts concluded that the median 2017 automotive cost of a PEMFC system is around 75 $ kW−1 with a stack durability and power density of 4, 000 h and 2.5 kW L−1, whilst the DOE ultimate targets are 30 $ kW−1, 8, 000 h and 3 kW L−1, respectively. The ultimate performance target is expected to be met by 2035 and the ultimate cost and durability targets by 2050 (Whiston et al., 2019). Despite the ongoing progress, other numbers are also still away of targets established for 2025 by the U.S. and other regions, such as the European Union (Yunzhe et al., 2020)) (the status reported during 2015-2020 is indicated in brackets (DOE, 2015; Wang et al., 2020a)): 1) total Pt group metal (PGM) content lower than 0.1 g kW−1 (0.16 g kW−1); 2) rated power density of 1 W cm−2 (0.81 W cm−2); 3) minimum electrical resistance of 1000 Ω cm2(1635 Ω cm2).
A key issue for decreasing Pt loading (mainly at the cathode) is caused by local mass transport resistance introduced by thin ionomer films surrounding Pt nanoparticles (Weber and Kusoglu, 2014; Sánchez-Ramos et al., 2021, 2022). The local oxygen transport resistance (per unit of geometric area) is inversely proportional to the roughness factor, the ratio between the electrochemically active surface area and the cell geometric area,
A large effort has been devoted to improving performance at low Pt loading, including the increase of the ECSA, the development of more active catalysts with reduced Pt content, and the decrease of mass transport resistances in the membrane electrode assembly (MEA), flow field and stack (Goshtasbi et al., 2019; Park et al., 2019; Chen et al., 2020; Cochet et al., 2020). Here, we shall focus mainly on the latter approach, since the other options can be incorporated into a previously optimized design in terms of mass transport. Reducing the oxygen transport resistance in a PEMFC can be addressed by: 1) a reduction of the internal mass transport resistance of the CL microstructure, 2) a reduction of the mass transport resistance of the backing layer (gas diffusion layer, GDL, and microporous layer, MPL) and at the GDL/channel/rib interface, 3) a decrease of the along-the channel and stack flow distributor resistance caused by difficulties in liquid water removal (especially at high current densities above 2–3 A cm−2), or a combination thereof (see, e.g. (Yi et al., 2012; Choi et al., 2014; García-Salaberri P. et al., 2017; Azarafza et al., 2019; Deng et al., 2021; Zhang et al., 2021; Zapardiel and García-Salaberri, 2022), among others). The ohmic loss in the proton exchange membrane (PEM) and CLs is less relevant at low Pt loading in state-of-the-art designs. Figure 1A shows the peak power density per unit mass of Pt achieved with some CL designs presented in the last years. To facilitate the presentation, two groups are distinguished: 1) conventional CLs (CONV and C-ENG in Figure 1) based on the original thin-film CL design without and with engineered or modified nanoporous supports (pore radius, Rp ≲ 10 nm), and 2) innovative CLs (VA, NSTFC and I-ENG in Figure 1), which includes alternative CL designs aimed at reducing mass and ohmic transport losses across the CL thickness, at local Pt sites, or at both locations. Advances achieved in both groups are discussed below.
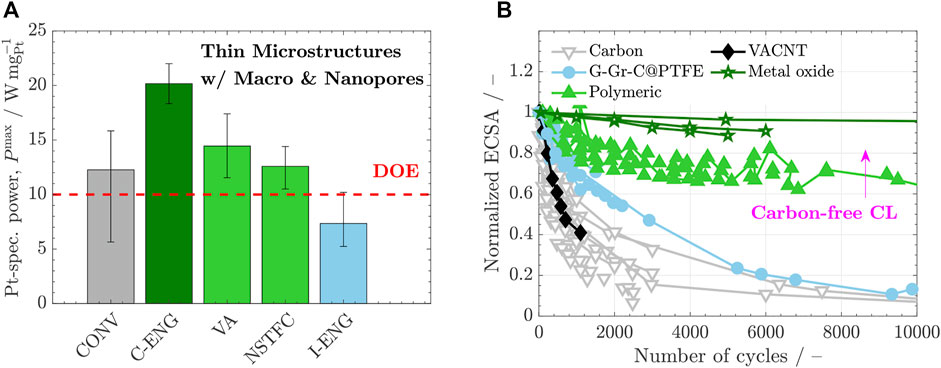
FIGURE 1. (A) Peak power per Pt miligram, Pmax, achieved with different cathode CL designs: CONV, conventional CLs with solid (Vulcan) and nanoporous (e.g., KetjenBlack) carbon supports prepared by different techniques (e.g., airbrush or electrospraying) (Orfanidi et al., 2017; Garsany et al., 2018; Conde et al., 2019; Talukdar et al., 2019; Cui et al., 2021); CONV-ENG, conventional CLs with engineered or modified nanoporous supports (Yarlagadda et al., 2018; Ramaswamy et al., 2020); VA, CLs with vertically aligned supports covered by ionomer (i.e., based on Middelman’s ideal microstructure) (Murata et al., 2014; Xia et al., 2015; Meng et al., 2022); NSTFC, ionomer-free nanostructured thin film catalysts Debe (2012); Debe et al. (2011); Debe (2011); Debe et al. (2006); Ostroverkh et al. (2019); ION-ENG, CLs with engineered or modified ionomer distributions (e.g., a combination of ionomer nanofibers and conventional microstructures with reduced ionomer content) (Zhang and Pintauro, 2011; Borup and Weber, 2019; Sun et al., 2019; Yoshino et al., 2020). The 2020 DOE target,
In terms of conventional CLs, two main approaches have been used to enhance performance at low Pt loading: 1) reduction of bulk transport losses considering alternative production techniques (e.g., catalyst deposition by electrospraying or freeze drying (Folgado et al., 2018; Talukdar et al., 2019)), and 2) the modification of nanoporous supports to optimize triple phase points at catalyst sites (CONV-ENG) (Yarlagadda et al., 2018; Ramaswamy et al., 2020; Kobayashi et al., 2021). The second strategy is more fundamental. Provided that a continuous electron pathway exists across a CL, there are two options to form triple phase points (allowing a simultaneous access of oxygen, protons and electrons): 1) active catalyst in contact with liquid water, and 2) active catalyst in contact with hydrated ionomer. Compared with transport in an ionomer film, oxygen diffusion in liquid water is easier while proton conduction in liquid water is more difficult (Zenyuk and Litster, 2014; Muzaffar et al., 2018). Since oxygen transport is typically the limiting process at low Pt loading, transport in liquid water at triple phase points is preferred Yarlagadda et al. (2018). In addition, catalyst sites in contact with liquid water do not suffer from a reduction of the electrochemical activity due to adsorption of sulfonate groups at hydrophilic Pt surfaces (Takeshita et al., 2020). The General Motors Company exploited this approach by engineering accessible nanopores already present in high surface area carbon (HSAC) supports, such as Ketjenblack, in contrast to low surface area carbon (LSCA) supports (e.g., Vulcan) (Yarlagadda et al., 2018). Van der Waals adsorption, capillary condensation and water generation ensured the presence of liquid water in nanopores. As a result, efficient oxygen and proton transport around catalyst sites was possible, while providing good proton transport at the layer scale through ionomer films (Zenyuk and Litster, 2014). The achieved Pt mass-specific performance was remarkably high (the largest reported so far to the authors’ knowledge),
In terms of innovative CLs, Toyota Motor Corporation developed vertically aligned (VA) microstructures based on the idealized design proposed by Middelman (Middelman, 2002; Murata et al., 2014). This idealized microstructure is composed of a structured array of electron-conductive pillars catalyzed with Pt and covered with a co-axial ionomer film for proton transport. This design provides the best theoretical solution to minimize bulk transport losses provided that water flooding is not an issue and the ionomer film is able to conduct protons efficiently with a negligible local mass transport resistance. However, this is not usually the case in practice, where the ionomer mass transport resistance significantly reduces the performance at low Pt loading, leading to a non-optimal ECSA utilization (Spingler et al., 2017; Schuler et al., 2019). Two worth noting designs have been proposed to overcome this issue: 1) ionomer-free nanostructured thin film catalyst (NSTFC) developed by The 3M Company (Debe et al., 2006; Debe, 2011; Debe et al., 2011; Debe, 2012; Ostroverkh et al., 2019), and 2) designs based on a combination of ionomer nanofibers (proton transport highways) and a conventional microstructure with reduced ionomer content (ION-ENG) examined by U.S. National Laboratories and Toyota Motor Corporation (Zhang and Pintauro, 2011; Borup and Weber, 2019; Sun et al., 2019; Yoshino et al., 2020). Ultra-thin NSTFC electrodes (δcl < 1 μm) are solely composed of polymer whiskers catalyzed by a Pt monolayer, so that the Pt skin is used to conduct electrons and (generated) liquid water to conduct protons. Despite its simplicity, the main drawback of this design is caused by flooding of the cathode CL at low operating temperature, which can be ascribed to the hydrophilicity of the Pt skin and CL thinness (Debe, 2012; Zenyuk et al., 2016a). Moreover, oxygen diffusion and proton conduction across hundreds of nanometers of liquid water in NSTFC electrodes is a sub-optimal solution to increase the peak power density compared with the lower lengths that can be achieved in CON-ENG designs. ION-ENG electrodes are an interesting option toward the development of bi-functionalized microstructures that can combine facilitated domains for oxygen and proton transport. Currently, the main practical difficulty lies in producing composite microstructures with a good transition between ionomer nanofibers and ionomer thin films. The performance achieved with this variant is still below the 2020 DOE target, even though it has been shown to be a viable route to increase performance at reduced RH due to enhanced water uptake (Yoshino et al., 2020).
The ECSA reduction normalized with respect to the value at the beginning of life (BOL) achieved in ASTs with different catalyst supports is shown in Figure 1B. Although the high activity of Pt/C catalysts is desirable, carbon supports can suffer from limited durability mainly due to: 1) agglomeration of Pt nanoparticles (RPt ∼ 2 nm) caused by electrochemical Ostwald ripening and/or migration-coalescence, and 2) an overlap between the operating voltage and the carbon corrosion potential, especially at cell voltages above Vcell ≈ 1 V (Babu et al., 2021; Zhao et al., 2021). Catalyst agglomeration leads to a direct reduction of the ECSA, since larger Pt nanoparticles feature a lower specific surface area,
In this work, as shown in Figure 2, the performance of an idealized cathode CL which features a VA geometry with a bimodal pore size distribution is examined. The microstructure is fully bi-functionalized, so there is no interaction between the ionomer space devoted to proton transport and the secondary space devoted to oxygen transport. The ORR takes place in water-filled primary nanopores grooved in an electron-conductive shell in contact with both domains, and catalyzed with an atomic Pt skin to maximize the ECSA. This microstructure provides an idealized version of the situation found in engineered HSAC supports (CONV-ENG) in which the solid volume fraction has been minimized with the aim of providing a continuous path for electron transport without a significant electrical loss Wilson and Gottesfeld (1992). The design further considers that all nanopores (i.e., Pt sites) are accessible and removes entirely any ionomer transport resistance at the entrance of nanopores. The proposed microstructure is to be optimized geometrically. The organization of the paper is as follows. In Section 2, the assumptions and the multiscale approach considered to model the idealized cathode CL and exterior mass and ohmic transport resistances are presented. A special focus is devoted in Subsection 2.1 to the assumptions made on water management, which has not been explicitly modeled here. The formulations of the macroscopic model at the layer scale and the microscopic model at the nanopore scale are presented in Sections 3 and 4, respectively. The case studies are described in Section 5, which considers an analysis of the optimized geometry of the idealized cathode CL, the effect of exterior transport resistances, and the effect of catalyst activity. The results are discussed in Section 6, where technological frontiers are analyzed. Finally, the conclusions are presented in Section 7.
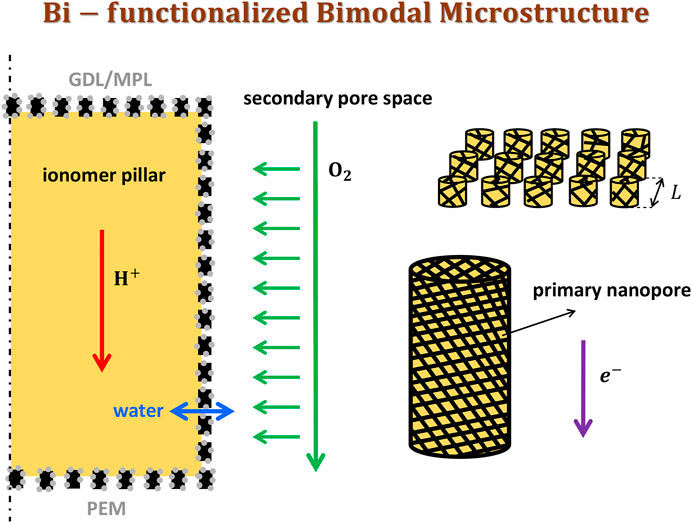
FIGURE 2. Schematic of a bi-functionalized bimodal cathode CL microstructure with targeted domains for proton and gas species transport, and a primary (R ≲ 10 nm)/secondary (R ≳ 10 nm) pore size distribution. ORR and electron transport take place in a nanoporous shell covering ionomer pillars, which is made of a highly electron-conductive material catalyzed with Pt. Liquid water can be transported both through ionomer pillars and released to secondary pores. The characteristic spacing between pillars is L.
2 Numerical model
2.1 Assumptions
The main simplifying assumptions adopted in the model formulation are as follows:
1) Steady state operation, isothermal conditions and ideal gases.
2) Full gas humidification
3) The PEM is perfectly impermeable to gas species and convection is negligible in the CL.
4) Adsorption kinetics at catalyst sites for the examined voltage close to peak power density (Vcell = 0.5 V) is infinitely fast (Sánchez-Ramos et al., 2021).
5) The oxygen concentration drop from the channel to the CL/MPL interface and the voltage drop in other components different from the cathode CL are quantified by an overall mass transport resistance,
6) Ohmic and thermal contact resistances are negligible.
7) The CL microstructure is macroscopically homogeneous, being composed of evenly spaced ionomer pillars covered by a nanoporous electron-conductive shell. The interior surface of nanopores is catalyzed with an atomic Pt skin, and the solid fraction of the shell is composed of a highly conductive material, such as graphite (σe ∼ 104 S cm−1), graphene (σe ∼ 105 S cm−1) or a metal (e.g., Ti, σe ∼ 104 S cm−1). The secondary pore space between ionomer pillars shows a uniform pore size distribution (rather than a heterogeneous pore size distribution as in conventional CLs (Sakai et al., 2009)).
8) Degradation is negligible and the stiffness of the CL is infinitely high (Jomori et al., 2012).
9) The CL temperature is high enough to avoid flooding due to electrochemical generation and net water transport from anode to cathode. The secondary pore space is partially saturated with a prescribed average saturation savg, which is used to correct the bulk effective diffusivity. Two-phase flow of water saturation and water vapor is not modeled (see below).
10) Primary nanopores grooved in the electron-conductive shell are filled with liquid water from the ORR due to Van der Waals adsorption, capillary condensation and Knudsen effect.
The last two assumptions deserve further attention. Unlike porous media with pore sizes larger than 1 μm, two-phase transport in a CL is affected by two nanoscale aspects: 1) reduction of the vapor pressure of water by Van der Waals adsorption and Kelvin effect, and 2) reduction of the diffusivity coefficient of gas species by Knudsen effect.
According to the Kelvin equation, the actual saturation pressure of water in a nanometric concave meniscus,
where Ro is the universal gas constant, σ ≈ 0.072 N m−1 is the surface tension of the water-air fluid pair,
The reduction of the diffusivity coefficient of species i due to Knudsen effect (i.e., the frequent collision of gas molecules with pore walls) depends on the pore radius, R, according to the expression
where
with Mi the molecular mass of species i.
Four key characteristic times can be distinguished related with two-phase transport in the pore space of a CL: 1) capillary action estimated according to the Young–Laplace equation, tc, 2) phase change of water from the Hertz-Knudsen equation (Jiao and Li, 2011; Attari Moghaddam et al., 2017), tpc, 3) viscous transport of liquid water from the Navier-Stokes equations, tv, and 4) diffusion of water vapor from Fick’s law, tH2O,d. For a pore radius R ∼ 50 nm and a characteristic velocity vc ∼ (Iavg/2F) (MH2O/ρH2O) ∼ 10–6 s at Iavg ≈ 1 A cm−2, the estimated times in increasing order are.
where alv is the liquid-water specific surface area, which is in the order of alv ∼ R−1 ∼ 2 × 10⁷ m−1 for R = 50 nm, and ρ ≈ 103 kg m−3 and ν ≈ 10–6 m2 s−1 are the density and the kinematic viscosity of liquid water, respectively. The effective diffusivity of water vapor,
The liquid-phase pressure drop needed to drive the flow of liquid water across a CL can be estimated from Darcy’s law. Considering a CL permeability, K ∼ 10–15 − 10–16 m2, and a thickness, δcl ∼ 5 μm (Zhao et al., 2018), we yield
According to this result, the effect of the liquid water flow on the liquid pressure distribution established by capillarity is virtually negligible, which agrees with the numerical results of Liu et al. (2013) and previous experimental pc-s curves reported for CLs without and with cracks Kusoglu et al. (2012).
Putting all together, the above estimations suggest that water transport in vapor and liquid forms take place on a time scale significantly slower than phase change phenomena and (virtually instantaneous) capillary action (i.e., tv, tH2O,d ≫ tpc ≫ tc). Water transport is also expected to be slower compared with water desorption/sorption from/to ionomer, since ionomer and liquid-water specific surface areas are of a similar order of magnitude in conventional CLs (alv ∼ ai ∼ R−1). This scenario is comparable to that reported for GDLs, where evaporation/condensation of water is controlled by transport rather than interfacial kinetics (Gebel et al., 2011; Fumagalli et al., 2015; Zenyuk et al., 2016b). As shown in Figure 3A, the bimodal pore size distribution of CLs offers a good balance to simultaneously provide a high liquid-gas interfacial area in water-filled primary pores due to Van der Waals adsorption and capillary condensation (R ∼ 2–10 nm), and an enhanced water vapor removal rate through secondary pores due to reduced Knudsen effect (R ≳ 50 nm) (Zientara et al., 2013; Li et al., 2019; Huang et al., 2021). Neglecting phase-change resistances, the water vapor removal rate under partially-saturated conditions driven by a temperature gradient across a CL is given by (Kim and Mench, 2009)
where
where
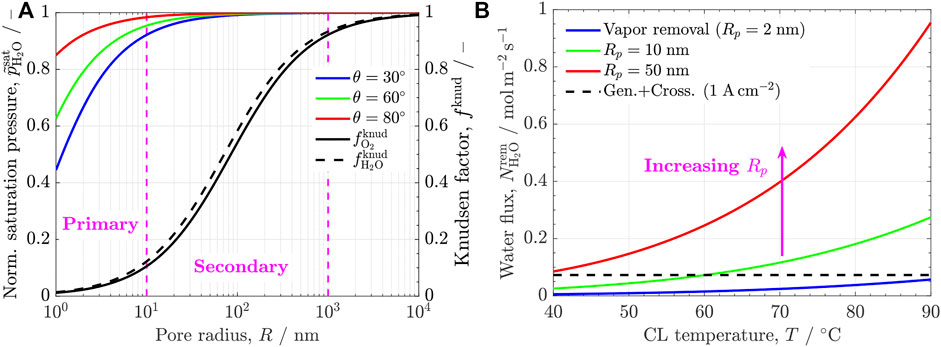
FIGURE 3. (A) Variation of the normalized saturation pressure,
Figure 3B shows the water vapor removal rate as a function of CL temperature for various pore radii, corresponding to an output current density Iavg ≈ 1 A cm−2 and a net water transport coefficient across the PEM from anode to cathode, β = 0.2 (savg ≈ 0.6). For a small pore radius, R ≈ 2 nm, the water removal flux in vapor form is not sufficient to transport the generation + crossover water flux in the temperature range T = 40–90°C. The same situation is found at temperatures below T ≲ 60°C for R ≈ 10 nm. Consequently, excess water is removed to the cathode MPL in liquid phase, condensed in the pore space, sorbed into the ionomer and/or pushed to the anode by a pressure difference (if a pressure difference between compartments exists). In contrast, when the pore radius is increased to tens of nanometers, R ≳ 50 nm, removal in vapor form is possible in the full temperature range. As a result, liquid water is desorbed from the ionomer to the pore space, liquid water is evaporated and/or liquid water enters the cathode CL by a pressure difference. This result highlights the importance of maintaining the CL at as high a temperature as possible within operational constraints. For a given current density (i.e., heat flux,
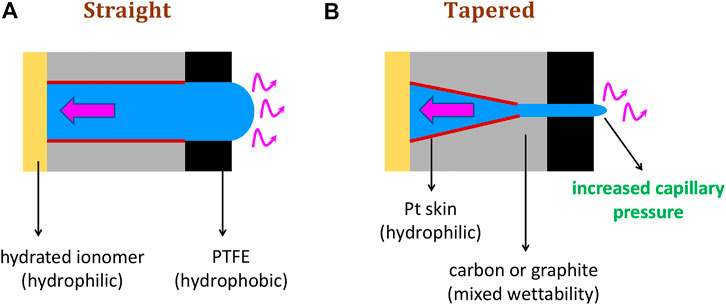
FIGURE 4. Schematic of tailored structures to mitigate cathode flooding in primary nanopores of the idealized bi-functional cathode CL examined in this work: (A) straight cylindrical nanopore with a PTFE coating added on the exterior surface of the nanoporous shell, and (B) tapered nanopore with increased Laplace pressure to enhance transport of liquid water from a hydrophobic PTFE coating toward hydrated ionomer (connected to the anode side through the PEM).
2.2 Multiscale approach
A multiscale across-the-membrane model is considered to describe oxygen, proton and electron transport in the idealized bi-functional cathode CL (Mu et al., 2022). As shown in Figure 5, the representative elementary area (REA) in the CL is composed of a square region of length L and thickness δcl with a central ionomer pillar of radius Ri. The average half-size of the secondary pore space surrounding an ionomer pillar is Rv. The ionomer pillar is covered by a nanoporous electron-conductive shell (see close-up view in Figures 5A,B). The microscopic representative elementary volume (REV) inside a shell is composed of a straight nanopore of radius Rp and length Lp ≪ Ri (negligible curvature), which is catalyzed with a Pt skin of thickness δPt. The nanoporosity of the shell is ɛp with an average spacing between pores lp (hexagonal packing). The effect of the multicomponent microstructure and the nanoscale current generation rate are plugged into a volume-average formulation across the CL thickness by means of: 1) effective transport properties (effective diffusivity, and effective electrical and ionic conductivities), and 2) a volume-specific reaction rate (see the macro-homogeneous domain in Figure 5C). The information extracted before and during a simulation from the macroscopic REA and the microscopic REV is as follows:
1) Before a simulation, the bulk effective transport properties in the CL are expressed in terms of primary geometrical parameters. In the idealized geometry, the normalized dry effective molecular diffusivity,
2) During a simulation, oxygen and proton transport are solved in a single pore using a 1D along-the-pore model that includes a surface reaction term. The current density generated in a single pore per unit of platinized area, Ip, is determined, and then converted into a local volumetric current density, jc(y), through the roughness factor, rf. The inlet boundary conditions for oxygen and protons in the microscopic model are provided by the local solution of the macroscopic model at each spatial coordinate across the thickness, y-coordinate. The local electronic potential, ϕe(y), used to evaluate the local overpotential, ηc(y), is also provided by the macroscopic model.
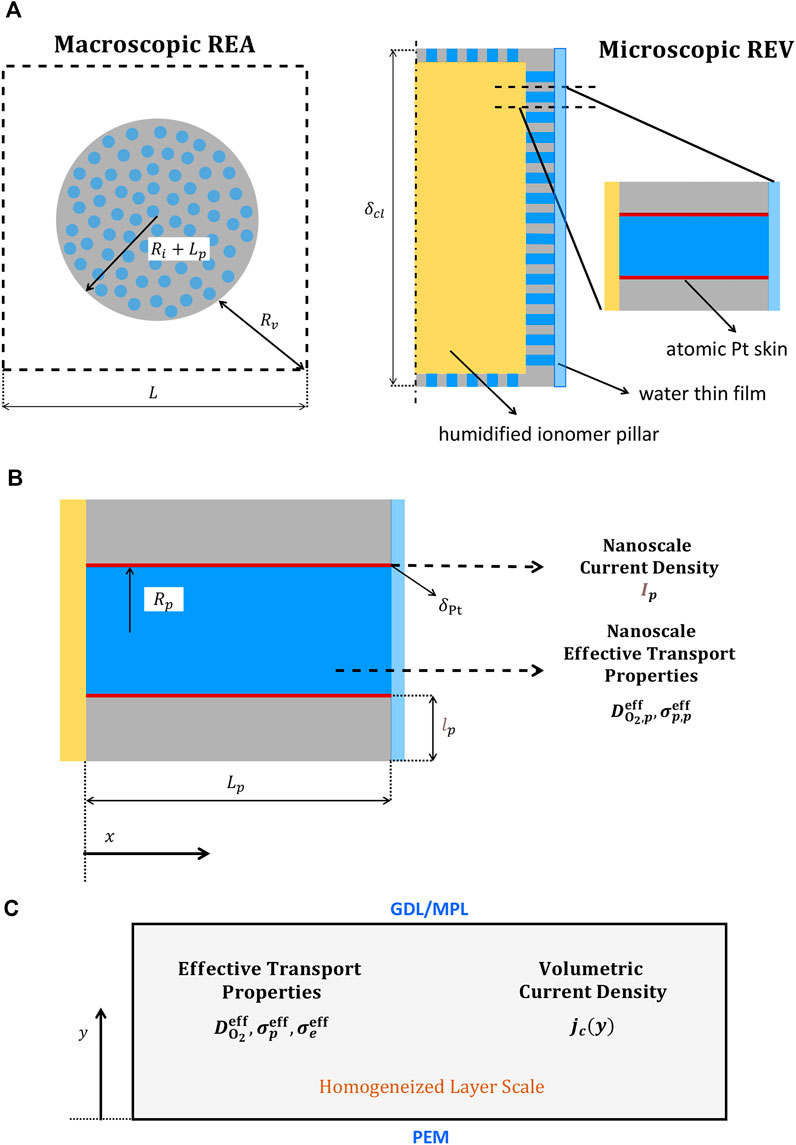
FIGURE 5. (A) REA of the examined bi-functionalized bimodal CL composed of cylindrical ionomer pillars surrounded by a nanoporous shell catalyzed with an atomic Pt skin. (B) Close-up view of the nanoscale geometry between an ionomer pillar and the secondary pore space. (C) Macro-homogenized representation of the CL at the layer scale with composition-dependent effective transport properties and volumetric current density determined from the microscopic model at the nanoscale.
The oxygen diffusive resistance from the channel to the CL and the ohmic resistance of the PEM and its interfaces are incorporated through integral mixed boundary conditions into the 1D cathode CL model. Further details of the implementation can be found in (Sánchez-Ramos et al., 2021). The formulations of the macroscopic and microscopic models are presented in the next two sections.
3 Macroscopic model (layer scale)
The macroscopic conservation equations of oxygen, protons and electrons across the CL thickness (y-coordinate) are given by
where
3.1 Boundary conditions
Equations (8a)–(8c) are supplemented with the following boundary conditions at the CL/MPL (y = δcl) and CL/PEM (y = 0) interfaces (see Figure 5).
where Vcell is the operating cell voltage,
where
According to the ideal gas law, the oxygen concentration in the air feed channel depends on the inlet cathode pressure,
3.2 Constitutive equations of the porous medium
Considering the representative geometry shown in Figure 5, the porosity of the secondary pore space, ɛ, the ionomer volume fraction, ɛi, the volume fraction of electron-conductive solid and Pt, ɛc+Pt, and the porosity of the primary pore space, ɛprim, are equal to.
where the ionomer radius ratio is equal to
The characteristic half-size of the secondary pore space, Rv, and the spacing between nanopores in the electron-conductive shell, lp, are given by.
Ideally, all nanopores are accessible and lined with active Pt. Hence, the roughness factor, rf, and the catalyst specific surface area, aPt, are equal to.
where Np is the number of pores in a conductive shell. For a prescribed nanoporosity, Np is given by
The CL thickness, δcl, is determined by the Pt loading, LPt, i.e.,
Here, ρPt = 21,450 kg m−3 is the density of Pt. Note that the
3.3 Effective transport properties
The expressions of the bulk effective transport properties at the layer scale are presented below.
3.3.1 Effective oxygen diffusivity
The effective oxygen diffusivity is decomposed into a dry component due to the obstruction of the dry CL microstructure and the Knudsen effect, f(ɛ, Rv), and the relative effective diffusivity due to the relative blockage of water saturation, g(savg) (Sánchez-Ramos et al., 2021; García-Salaberri et al., 2015b,a; García-Salaberri, 2021)
where
with T expressed in K and pg,c in Pa.
For a tortuosity factor τ ≈ 1, the normalized dry effective diffusivity is equal to
where
According to the data collected in Sánchez-Ramos et al. (2021), g(savg) in conventional CLs can be modeled as a power law of the form
This expression was considered a reasonable first approximation to evaluate g(savg) in this work.
3.3.2 Effective proton conductivity
Proton conduction through hydrated ionomer pillars also features a tortuosity factor τ ≈ 1. Hence, we have that
where σp is the bulk proton conductivity in ionomer. The value of σp in finite-sized ionomer domains depends on the size of the conductive medium and the confined morphology of protogenic groups (thin film vs. nanofiber). 2D thin ionomer films in conventional CLs show a lower conductivity than bulk PEMs (2-10 times lower) due to the more difficult percolation of protons through finite thickness domains (Siroma et al., 2009; Paul et al., 2014; Gostick and Weber, 2015; Chen et al., 2019), increasing with the film thickness–the bulk value of PEMs is reached when the film thickness is significantly larger than the size of protogenic nanodomains (around 10 nm) (Gomaa et al., 2022). However, ionomer nanofibers show an opposite behavior, reaching a higher ionic conductivity for small fiber diameters compared with bulk PEMs (up to 10 times higher) and a similar ionic conductivity to that of PEMs for significantly high fiber diameters (Pan et al., 2008; Sun et al., 2019). This opposite behavior can be explained by the preferential alignment of protogenic nanodomains along nanofibers, which act as highways for proton conduction (Pan et al., 2008). Thin films and nanofibers reach a value comparable to that of bulk PEMs for thicknesses and diameters around 50–100 nm, which is similar to the mean diameter of ionomer pillars considered here. Therefore, the bulk proton conductivity at fully humidified conditions was assumed equal to that of Nafion PEMs as a first approximation (Kusoglu and Weber, 2017)
3.3.3 Effective electrical conductivity
The effective electrical conductivity in the electron-conductive shell with a hexagonal packing of nanopores,
where σe is the bulk electrical conductivity of the electron-conductive material. Here, the electrical conductivity of graphite was taken as a representative value, σe ∼ 106 S m−1. A material with a high stiffness would also be necessary to provide mechanical integrity to the proposed core-shell microstructure for its fabrication.
At the layer scale,
4 Microscopic model (nanopore scale)
Oxygen and proton transport along a nanopore (local x-coordinate) is governed by a reaction-diffusion equation with a surface reactive term. Mass and charge balances in a pore segment of length dx and radius Rp yield.
The resulting differential conservation equations for the nanoscale oxygen concentration, CO2,p, and the ionic potential, ϕp,p, are
where Ip(x) is the current density generated in a single nanopore per unit of active surface area (i.e., internal nanopore surface). Ip(x) is described by Tafel kinetics (Sánchez-Monreal et al., 2018)
Here,
where ϕe(y) is the local electronic potential across the thickness (provided by the layer-scale model) and Er ≈ 1.2 V is the reversible cell voltage (Sánchez-Ramos et al., 2021).
The effective oxygen diffusivity,
where DO2,w and σp,w are the diffusivity coefficient of oxygen and the proton conductivity in liquid water, respectively. DO2,w can be extracted from values measured in bulk water (Han and Bartels, 1996; Muzaffar et al., 2018), while σp,w has been determined experimentally and numerically for pH values commonly found in operating PEMFCs (see (Zenyuk and Litster, 2014; Liu and Zenyuk, 2018) and references therein)
Comparatively, DO2,w is between one to three orders of magnitude higher than the oxygen diffusivity in ionomer films and PEMs (Kusoglu and Weber, 2017; Sánchez-Ramos et al., 2021), while σp,w is one order of magnitude lower than the proton conductivity through thin films in conventional CLs (Sabarirajan et al., 2020). This favorable situation was previously exploited in NSTFC electrodes with a relatively good performance (Debe et al., 2011; Debe, 2012).
At each y-coordinate, the surface current density drawn from one nanopore is equal to
The relationship between the nanoscale surface current density,
4.1 Boundary conditions
The boundary conditions at the nanopore inlet (x = Lp) and at the nanopore/ionomer interface (x = 0) are rather similar to those used at the layer scale due to the analogy between the arrangement of a nanopore inside the idealized bi-functional CL and a CL in a MEA
where the dissolved oxygen concentration in liquid water at the nanopore inlet is given by Henry’s law (Blunier et al., 2013) (rather than a Langmuir adsorption model as found for ionomers (Shen et al., 2017; Cheng et al., 2022))
The entry resistances at the nanopore edges,
leading to robin boundary conditions.
5 Case studies
The three case studies examined are schematized in Figure 6A: 1) baseline case devoted to the geometrical optimization of the CL microstructure (see optimization flow chart in Figure 6B) considering state-of-the-art channel-CL oxygen transport and area-specific ohmic resistances,
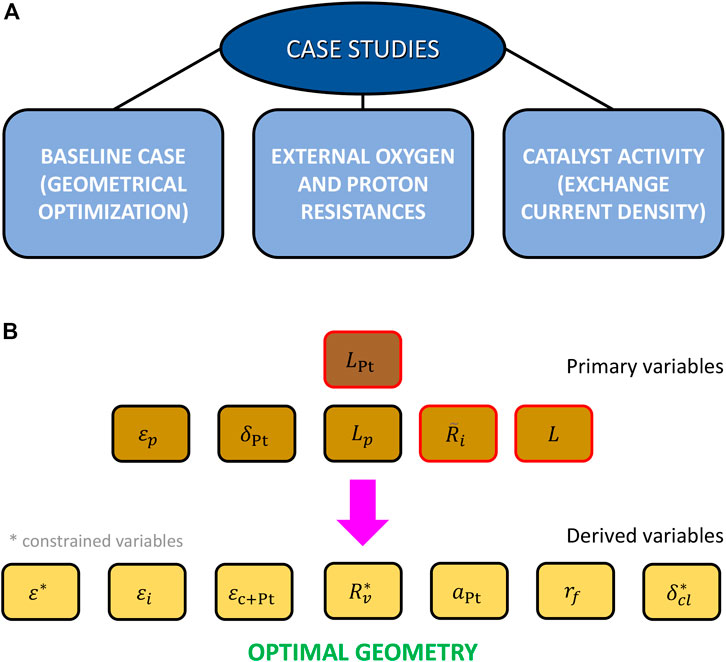
FIGURE 6. (A) Diagram of the case studies examined. The analysis of the baseline case with the geometrical optimization of the bi-functionalized cathode CL microstructure is presented in Section 6.1, the effect of the external oxygen and proton transport resistances,
The parameters that were kept constant and examined parametrically for the geometrical optimization (presented in Section 6.1) are listed in Table 1. The nanopore radius was fixed to Rp = 2.5 nm to ensure the presence of water in tiny nanopores and the average saturation in the secondary pore space was fixed to savg = 0.4, as previously discussed in Section 2.1. The cell voltage was set to Vcell = 0.5 V, close to maximum power density (see footnote in Table 1 for other operating conditions). The Pt loading was varied in the range LPt = 0.001–0.4 mgPt cm−2, which includes the loading needed to meet the ultimate target of a total PGM content below 0.1 mgPt cm−2 (LPt ∼ 10–2 mgPt cm−2). For a given Pt loading, the CL microstructure is defined by five primary variables: ɛp, δPt, Lp, L and
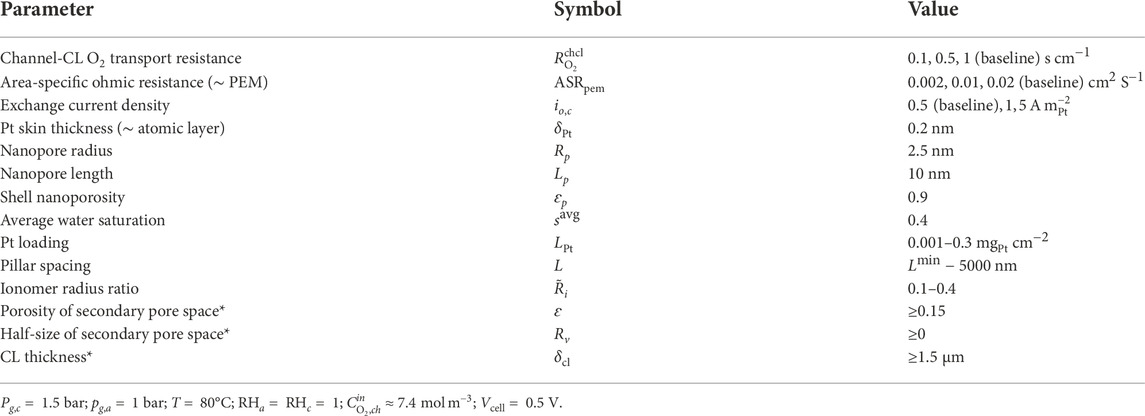
TABLE 1. Model parameters. The baseline case corresponds to
Therefore, the smallest pillar spacing allowed is equal to
6 Discussion of results
6.1 Baseline case (geometrical optimization)
The calculation of the optimal pillar spacing and ionomer radius ratio, L and
where the oxygen transport resistances at the layer scale and the nanoscale (under passive non-reactive conditions) are equal to
The most limiting transport process is oxygen transport at the nanoscale mainly due to the larger oxygen resistance at the nanoscale (compared with that of the bulk CL) and the dissolution of oxygen in liquid water to reach triple phase points unlike proton conduction. Ohmic losses at the layer scale can be lower or comparable to those found in water-filled nanopores depending on the value of the normalized ionic conductivity across the CL (
The maximum power density is achieved when all the dimensionless times (or penetration depths), Ωi, are minimized (maximized), so that oxygen and proton transport are fast enough to maintain the reaction rate at the targeted current density, Iavg, with a low cathode overpotential. According to Eqs. (38a)–(38d), this condition is achieved when transport resistances, Ri, are minimized at all scales. The other option is to increase the oxygen concentration at the CL/MPL interface, something that can be done through a reduction of the exterior mass transport resistance to the cathode CL,
Figure 7A shows the variation of the bulk oxygen transport resistance,
And the solid volume fraction, ɛc+Pt, can then be calculated from
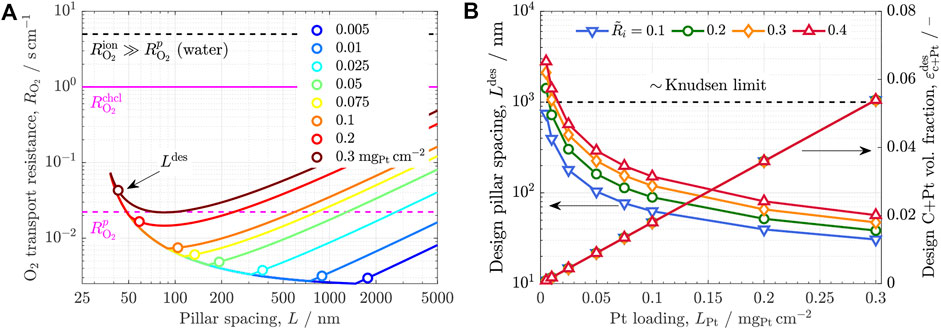
FIGURE 7. (A) Variation of the bulk O2 transport resistance of the bi-functionalized bimodal cathode CL,
As shown in Figure 7B, Ldes increases with decreasing Pt loading, given that a smaller amount of Pt can be allocated in the same thickness but with larger secondary pores (where most of the pore space is present). This method of reducing LPt is theoretically optimal (compared with the addition of bare carbon to maintain a constant thickness), since it decreases
The optimal
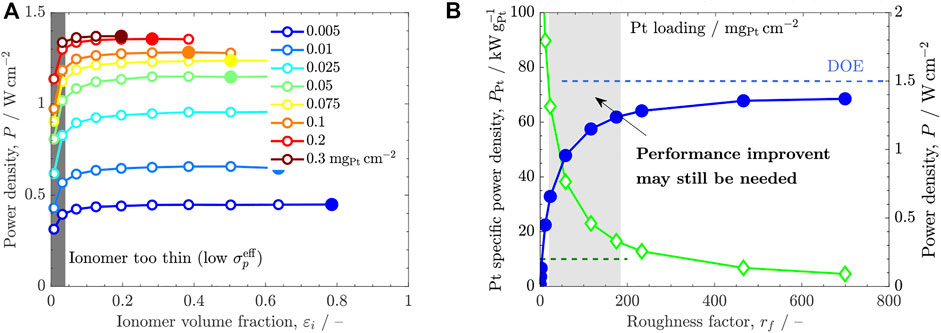
FIGURE 8. (A) Variation of the geometric power density, P, with the ionomer volume fraction, ɛi, at the design point of minimum transport resistance corresponding to several Pt loadings, LPt = 0.005 − 0.3 mgPt cm−2. The power density is reduced when ɛi is small because of the drop of
Figure 8B shows the variation of the Pt-specific and geometric power densities, PPt and P, with the roughness factor, rf, at the optimal design point
6.2 Effect of external transport resistances
The effect of the exterior ohmic and mass transport resistances, ASRpem and
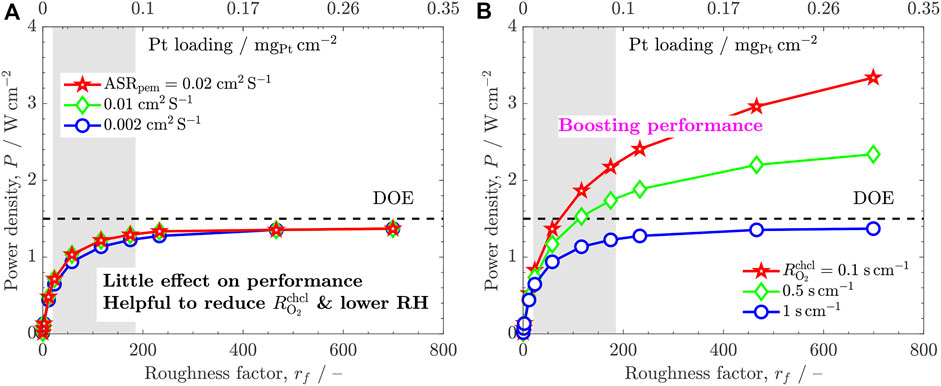
FIGURE 9. Variation of the geometric power density (Vcell = 0.5 V), P, with the roughness factor, rf, at the optimal design point, corresponding to: (A) three area-specific ohmic resistances, ASRpem = 0.02 (baseline case), 0.01, 0.002 cm2 S−1, and (B) three channel-CL oxygen transport resistances,
From the above calculations, it turns out that the exterior and nanoscale oxygen transport resistances,
Power densities above 1.5 W cm−2 are predicted with air feed at low Pt loading with a ten-fold reduction of the external oxygen resistance from
6.3 Effect of catalyst activity (exchange current density)
The last option to improve performance within DOE targets is catalyst modification by: 1) increasing the mass activity with the same amount of precious metals, and 2) maintaining the mass activity with a reduced amount of precious metals (or a combination of both). According to Tafel equation, for a given roughness factor and overpotential, a catalyst with a higher exchange current density can potentially increase the current density in the same proportion (if transport losses are small)
Figure 10 shows the variation of P with rf for three different exchange current densities,
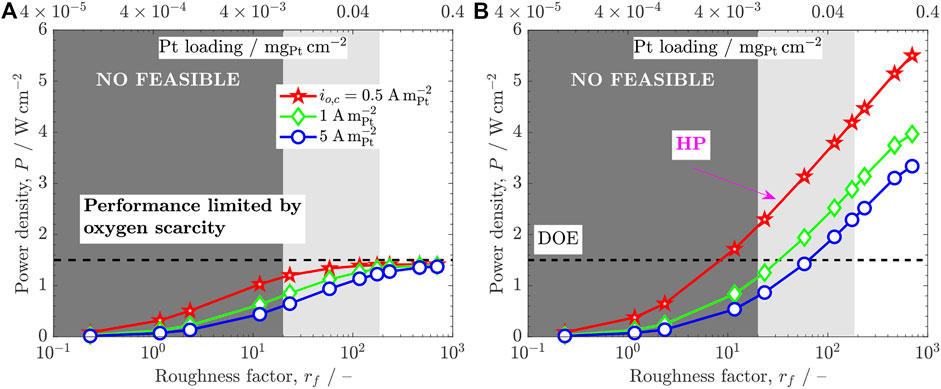
FIGURE 10. Variation of the geometric power density (Vcell = 0.5 V), P, with the roughness factor, rf, at the optimized design point for three exchange current densities, io,c=0.5,1,5 A m
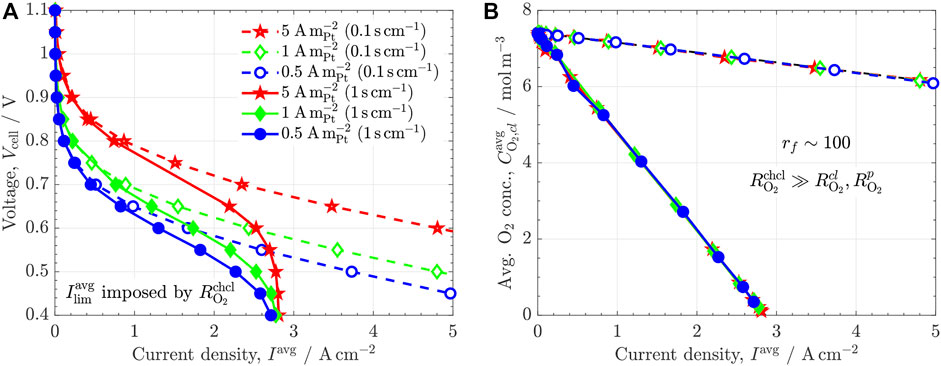
FIGURE 11. (A) Polarization curve, Vcell − Iavg, and (B) variation of the average oxygen concentration in the CL,
As a final remark, it is relevant to examine the limit to which LPt might be reduced to ensure a certain minimum performance. The frontier is largely controlled by rf. As shown in Figure 10B, the power density with a highly optimized PEMFC (i.e., CL based on water-filled triple phase points,
where
7 Conclusion
The performance and durability of proton exchange fuel cells (PEFCs) is largely linked to an optimal design of the cathode catalyst layer (CL), especially if a reduction of the Pt loading (LPt ∼ 10–2 mgPt cm−2) is desired to meet industrial requirements in terms of design and cost (e.g., ultimate targets set by the U.S. Department of Energy to make PEFC technology competitive). Based on the analysis conducted in this work, good practices to enhance the performance and enlarge the durability of the cathode CL at low Pt loading are as follows:
1) To increase the electrochemical surface area, ECSA, as much as possible to decrease the Pt loading needed to achieve a specified roughness factor, rf. Reaching high performance (say, beyond P ≈ 1.5 W cm−2) at low Pt loading with rf ≲ 10 can be difficult due to the sluggishness of the oxygen reduction reaction (ORR). An increase of the catalyst active area up to
2) To increase the percentage of triple phase points based on water-filled nanopores with no entry mass transport losses caused by (thin) ionomer films. Modification of nanoporous supports with short transport lengths
3) To reduce the oxygen transport resistance from the channel to the CL (i.e., from the stack inlet(s) to the CL),
4) Increasing the catalyst mass activity (exchange current density, io,c) can allow an improvement of the power density if other transport losses do not limit the cell performance. Increasing io,c (×10) in combination with a reduction of
5) Durability during dynamic operation can be increased if corrosion of the carbon support is avoided at the cathode. Polymer and metallic (e.g., TiO2) supports show a longer durability than carbon-based supports (e.g., carbon black, graphite or carbon nanotubes). However, an economic analysis is needed to quantify if a change of the support to more expensive materials (e.g., TiO2) is cost-effective.
Although commercialization of PEMFCs is underway for some applications, such as heavy-duty vehicles, trains, electric bicycles, etc., several aspects warrant future work to be addressed by a combination of experimental and numerical work. Research is expected to continue toward increasing performance and durability at low Pt loading, mainly for two reasons: 1) to examine the technology limits that could provide a more affordable and extended use in general purpose applications, and 2) to leverage the development of cheap, durable, high-performance PEMFCs for light-duty vehicles that can make the technology more competitive in the automotive sector. As exemplified in this work, research topics to be analyzed in more detail include: 1) reduction of Pt loading via optimization of the multiscale microstructure of CLs, 2) water management with a focus on CL design and interaction with other layers, 3) reduction of oxygen transport resistance in MEAs and stacks, 4) increasing durability of carbon-based supports through a reduction of carbon corrosion, and 5) simplification of balance of plant. An effort is to be made toward integrated, multidisciplinary work, since most of these topics are coupled with each other. This probably explains why most significant recent developments in PEMFC technology were accomplished by companies, while research in the field seems to be a scattered combination of chemical, electrical, electrochemical and mechanical engineering, among other disciplines. Modeling is an essential transversal tool for understanding and optimization.
Data availability statement
The raw data supporting the conclusion of this article will be made available by the authors, without undue reservation.
Author contributions
GS contributed to the conception and design of the study, the simulation campaign, and the writing of the first draft of the manuscript. All authors contributed to manuscript revision, read, and approved the submitted version.
Funding
This work was supported by projects PID2019-106740RB-I00 and EIN 2020-112247 of the Spanish Research Council.
Acknowledgments
GS acknowledges fruitful discussion with Dr. Adam Z. Weber at Lawrence Berkeley National Lab under the framework of the project “Multiphysics, Multiphase and Multiscale Modeling of Porous Media with Application to Energy Conversion and Storage Electrochemical Devices” granted by the Spanish Research Council.
Conflict of interest
The authors declare that the research was conducted in the absence of any commercial or financial relationships that could be construed as a potential conflict of interest.
Publisher’s note
All claims expressed in this article are solely those of the authors and do not necessarily represent those of their affiliated organizations, or those of the publisher, the editors and the reviewers. Any product that may be evaluated in this article, or claim that may be made by its manufacturer, is not guaranteed or endorsed by the publisher.
References
Antolini, E., and Gonzalez, E. (2009). Ceramic materials as supports for low-temperature fuel cell catalysts. Solid State Ionics 180, 746–763. doi:10.1016/j.ssi.2009.03.007
Atanassov, P., Di Noto, V., and McPhail, S. (2021). From hydrogen manifesto, through green deal and just transition, to clean energy act. Electrochem. Soc. Interface 30, 57–60. doi:10.1149/2.f14214if
Attari Moghaddam, A., Prat, M., Tsotsas, E., and Kharaghani, A. (2017). Evaporation in capillary porous media at the perfect piston-like invasion limit: Evidence of nonlocal equilibrium effects. Water Resour. Res. 53, 10433–10449. doi:10.1002/2017wr021162
Avcioglu, G. S., Ficicilar, B., and Eroglu, I. (2016). Effect of ptfe nanoparticles in catalyst layer with high pt loading on pem fuel cell performance. Int. J. hydrogen energy 41, 10010–10020. doi:10.1016/j.ijhydene.2016.03.048
Azarafza, A., Ismail, M. S., Rezakazemi, M., and Pourkashanian, M. (2019). Comparative study of conventional and unconventional designs of cathode flow fields in pem fuel cell. Renew. Sustain. Energy Rev. 116, 109420. doi:10.1016/j.rser.2019.109420
Babu, S. K., Mukundan, R., Wang, C., Langlois, D., Cullen, D. A., Papadias, D., et al. (2021). Effect of catalyst and catalyst layer composition on catalyst support durability. J. Electrochem. Soc. 168, 044502. doi:10.1149/1945-7111/abf21f
Blunier, B., Gao, F., and Miraoui, A. (2013). Proton exchange membrane fuel cells modeling. John Wiley & Sons.
Borup, R. L., Kusoglu, A., Neyerlin, K. C., Mukundan, R., Ahluwalia, R. K., Cullen, D. A., et al. (2020). Recent developments in catalyst-related pem fuel cell durability. Curr. Opin. Electrochem. 21, 192–200. doi:10.1016/j.coelec.2020.02.007
Borup, R. L., More, K. L., and Myers, D. J. (2018). Fc-pad: Fuel cell performance and durability consortium update to uscar analysis of toyota mirai components provided by uscar
Borup, R., and Weber, A. (2019). Fc135: Fc-pad: Fuel cell performance and durability consortium. Washington DC: Annual Merit Review Proceedings.
Chen, D., Kongkanand, A., and Jorne, J. (2019). Proton conduction and oxygen diffusion in ultra-thin nafion films in pem fuel cell: How thin? J. Electrochem. Soc. 166, F24–F33. doi:10.1149/2.0101902jes
Chen, K., Deng, S., Lu, Y., Gong, M., Hu, Y., Zhao, T., et al. (2021). Molybdenum-doped titanium dioxide supported low-pt electrocatalyst for highly efficient and stable hydrogen evolution reaction. Chin. Chem. Lett. 32, 765–769. doi:10.1016/j.cclet.2020.05.030
Chen, M., Zhao, C., Sun, F., Fan, J., Li, H., and Wang, H. (2020). Research progress of catalyst layer and interlayer interface structures in membrane electrode assembly (mea) for proton exchange membrane fuel cell (pemfc) system. ETransportation 5, 100075. doi:10.1016/j.etran.2020.100075
Chen, Z., Deng, W., Wang, X., and Yan, Y. (2007). Durability and activity study of single-walled, double-walled and multi-walled carbon nanotubes supported pt catalyst for pemfcs. ECS Trans. 11, 1289–1299. doi:10.1149/1.2781042
Cheng, X., Shen, S., Wei, G., Wang, C., Luo, L., and Zhang, J. (2022). Perspectives on challenges and achievements in local oxygen transport of low pt proton exchange membrane fuel cells. Adv. Mat. Technol. 7, 2200228. doi:10.1002/admt.202200228
Chi, B., Hou, S., Liu, G., Deng, Y., Zeng, J., Song, H., et al. (2018). Tuning hydrophobic-hydrophilic balance of cathode catalyst layer to improve cell performance of proton exchange membrane fuel cell (pemfc) by mixing polytetrafluoroethylene (ptfe). Electrochimica Acta 277, 110–115. doi:10.1016/j.electacta.2018.04.213
Choi, H., Kim, O.-H., Kim, M., Choe, H., Cho, Y.-H., and Sung, Y.-E. (2014). Next-generation polymer-electrolyte-membrane fuel cells using titanium foam as gas diffusion layer. ACS Appl. Mat. Interfaces 6, 7665–7671. doi:10.1021/am500962h
Cochet, M., Forner-Cuenca, A., Manzi-Orezzoli, V., Siegwart, M., Scheuble, D., and Boillat, P. (2020). Enabling high power density fuel cells by evaporative cooling with advanced porous media. J. Electrochem. Soc. 167, 084518. doi:10.1149/1945-7111/ab8e82
Conde, J. J., Folgado, M. A., Ferreira-Aparicio, P., Chaparro, A. M., Chowdhury, A., Kusoglu, A., et al. (2019). Mass-transport properties of electrosprayed pt/c catalyst layers for polymer-electrolyte fuel cells. J. Power Sources 427, 250–259. doi:10.1016/j.jpowsour.2019.04.079
Cui, L., Zhang, J., Wang, H., Lu, S., and Xiang, Y. (2021). The effects of different dimensional carbon additives on performance of pemfc with low-pt loading cathode catalytic layers. Int. J. Hydrogen Energy 46, 15887–15895. doi:10.1016/j.ijhydene.2021.02.032
Debe, M. K., Atanasoski, R. T., and Steinbach, A. J. (2011). Nanostructured thin film electrocatalysts-current status and future potential. ECS Trans. 41, 937–954. doi:10.1149/1.3635628
Debe, M. K. (2011). Effect of electrode surface area distribution on high current density performance of pem fuel cells. J. Electrochem. Soc. 159, B53–B66. doi:10.1149/2.032201jes
Debe, M. K. (2012). Nanostructured thin film electrocatalysts for pem fuel cells-a tutorial on the fundamental characteristics and practical properties of nstf catalysts. ECS Trans. 45, 47–68. doi:10.1149/1.3701968
Debe, M. K., Schmoeckel, A. K., Vernstrom, G. D., and Atanasoski, R. (2006). High voltage stability of nanostructured thin film catalysts for pem fuel cells. J. Power Sources 161, 1002–1011. doi:10.1016/j.jpowsour.2006.05.033
Deng, X., Huang, C., Pei, X., Hu, B., and Zhou, W. (2021). Recent progresses and remaining issues on the ultrathin catalyst layer design strategy for high-performance proton exchange membrane fuel cell with further reduced pt loadings: A review. Int. J. Hydrogen Energy 47, 1529–1542. doi:10.1016/j.ijhydene.2021.10.141
DOE (2015). Hydrogen and fuel cell technologies office multi-year research, development, and demonstration plan. Available at: https://www.energy.gov/eere/fuelcells/articles/hydrogen-and-fuel-cell-technologies-office-multi-year-research-development.
Ercelik, M., Ismail, M. S., Ingham, D. B., Hughes, K. J., Ma, L., and Pourkashanian, M. (2022). Efficient x-ray ct-based numerical computations of structural and mass transport properties of nickel foam-based gdls for pefcs. Energy 262, 125531. doi:10.1016/j.energy.2022.125531
Esfahani, R. A. M., and Easton, E. B. (2020). Exceptionally durable pt/toms catalysts for fuel cells. Appl. Catal. B Environ. 268, 118743. doi:10.1016/j.apcatb.2020.118743
Esfahani, R. A. M., Ebralidze, I. I., Specchia, S., and Easton, E. B. (2018). A fuel cell catalyst support based on doped titanium suboxides with enhanced conductivity, durability and fuel cell performance. J. Mat. Chem. A Mat. 6, 14805–14815. doi:10.1039/c8ta02470g
Folgado, M., Conde, J., Ferreira-Aparicio, P., and Chaparro, A. (2018). Single cell study of water transport in pemfcs with electrosprayed catalyst layers. Fuel Cells 18, 602–612. doi:10.1002/fuce.201700217
Fumagalli, M., Lyonnard, S., Prajapati, G., Berrod, Q., Porcar, L., Guillermo, A., et al. (2015). Fast water diffusion and long-term polymer reorganization during nafion membrane hydration evidenced by time-resolved small-angle neutron scattering. J. Phys. Chem. B 119, 7068–7076. doi:10.1021/acs.jpcb.5b01220
Garcia-Salaberri, P. A. (2022). “General aspects in the modeling of fuel cells: From conventional fuel cells to nano fuel cells,” in Nanotechnology in fuel cells (Elsevier), 77
García-Salaberri, P. A., Gostick, J. T., Hwang, G., Weber, A. Z., and Vera, M. (2015a). Effective diffusivity in partially-saturated carbon-fiber gas diffusion layers: Effect of local saturation and application to macroscopic continuum models. J. Power Sources 296, 440–453. doi:10.1016/j.jpowsour.2015.07.034
García-Salaberri, P. A., Gostick, J. T., Zenyuk, I. V., Hwang, G., Vera, M., and Weber, A. Z. (2017b). On the limitations of volume-averaged descriptions of gas diffusion layers in the modeling of polymer electrolyte fuel cells. ECS Trans. 80, 133–143. doi:10.1149/08008.0133ecst
García-Salaberri, P. A., Hwang, G., Vera, M., Weber, A. Z., and Gostick, J. T. (2015b). Effective diffusivity in partially-saturated carbon-fiber gas diffusion layers: Effect of through-plane saturation distribution. Int. J. Heat Mass Transf. 86, 319–333. doi:10.1016/j.ijheatmasstransfer.2015.02.073
García-Salaberri, P. A., Vera, M., and Zaera, R. (2011). Nonlinear orthotropic model of the inhomogeneous assembly compression of pem fuel cell gas diffusion layers. Int. J. Hydrogen Energy 36, 11856–11870. doi:10.1016/j.ijhydene.2011.05.152
García-Salaberri, P. A., Zenyuk, I. V., Hwang, G., Vera, M., Weber, A. Z., and Gostick, J. T. (2019). Implications of inherent inhomogeneities in thin carbon fiber-based gas diffusion layers: A comparative modeling study. Electrochimica Acta 295, 861–874. doi:10.1016/j.electacta.2018.09.089
García-Salaberri, P. A., Zenyuk, I. V., Shum, A. D., Hwang, G., Vera, M., Weber, A. Z., et al. (2018). Analysis of representative elementary volume and through-plane regional characteristics of carbon-fiber papers: Diffusivity, permeability and electrical/thermal conductivity. Int. J. Heat Mass Transf. 127, 687–703. doi:10.1016/j.ijheatmasstransfer.2018.07.030
García-Salaberri, P. (2021). Modeling diffusion and convection in thin porous transport layers using a composite continuum-network model: Application to gas diffusion layers in polymer electrolyte fuel cells. Int. J. Heat Mass Transf. 167, 120824. doi:10.1016/j.ijheatmasstransfer.2020.120824
García-Salaberri, P., Sánchez, D., Boillat, P., Vera, M., and Friedrich, K. A. (2017a). Hydration and dehydration cycles in polymer electrolyte fuel cells operated with wet anode and dry cathode feed: A neutron imaging and modeling study. J. power sources 359, 634–655. doi:10.1016/j.jpowsour.2017.03.155
Garsany, Y., Atkinson, R. W., Gould, B. D., and Swider-Lyons, K. E. (2018). High power, low-pt membrane electrode assemblies for proton exchange membrane fuel cells. J. Power Sources 408, 38–45. doi:10.1016/j.jpowsour.2018.10.073
Gebel, G., Lyonnard, S., Mendil-Jakani, H., and Morin, A. (2011). The kinetics of water sorption in nafion membranes: A small-angle neutron scattering study. J. Phys. Condens. Matter 23, 234107. doi:10.1088/0953-8984/23/23/234107
Gomaa, M. M., Sánchez-Ramos, A., Ureña, N., Pérez-Prior, M. T., Levenfeld, B., García-Salaberri, P. A., et al. (2022). Characterization and modeling of free volume and ionic conduction in multiblock copolymer proton exchange membranes. Polymers 14, 1688. doi:10.3390/polym14091688
Goshtasbi, A., García-Salaberri, P., Chen, J., Talukdar, K., Sanchez, D. G., and Ersal, T. (2019). Through-the-membrane transient phenomena in pem fuel cells: A modeling study. J. Electrochem. Soc. 166, F3154–F3179. doi:10.1149/2.0181907jes
Gostick, J. T., and Weber, A. Z. (2015). Resistor-network modeling of ionic conduction in polymer electrolytes. Electrochimica Acta 179, 137–145. doi:10.1016/j.electacta.2015.03.126
Greszler, T. A., Caulk, D., and Sinha, P. (2012). The impact of platinum loading on oxygen transport resistance. J. Electrochem. Soc. 159, F831–F840. doi:10.1149/2.061212jes
Hack, J., García-Salaberri, P. A., Kok, M. D., Jervis, R., Shearing, P. R., Brandon, N., et al. (2020). X-Ray micro-computed tomography of polymer electrolyte fuel cells: What is the representative elementary area? J. Electrochem. Soc. 167, 013545. doi:10.1149/1945-7111/ab6983
Han, P., and Bartels, D. M. (1996). Temperature dependence of oxygen diffusion in H2O and D2O. J. Phys. Chem. 100, 5597–5602. doi:10.1021/jp952903y
Huang, Z., Chen, B., Mo, X., Yang, X., Yu, L., Hu, X., et al. (2021). Fast water evaporation from nanopores. Adv. Mat. Interfaces 8, 2100660. doi:10.1002/admi.202100660
Jiao, K., and Li, X. (2011). Water transport in polymer electrolyte membrane fuel cells. Prog. energy Combust. Sci. 37, 221–291. doi:10.1016/j.pecs.2010.06.002
Jiao, K., Xuan, J., Du, Q., Bao, Z., Xie, B., Wang, B., et al. (2021). Designing the next generation of proton-exchange membrane fuel cells. Nature 595, 361–369. doi:10.1038/s41586-021-03482-7
Jomori, S., Nonoyama, N., and Yoshida, T. (2012). Analysis and modeling of pemfc degradation: Effect on oxygen transport. J. Power Sources 215, 18–27. doi:10.1016/j.jpowsour.2012.04.069
Kienitz, B., Kolde, J., Priester, S., Baczkowski, C., and Crum, M. (2011). Ultra-thin reinforced ionomer membranes to meet next generation fuel cell targets. ECS Trans. 41, 1521–1530. doi:10.1149/1.3635683
Kim, S., and Mench, M. (2009). Investigation of temperature-driven water transport in polymer electrolyte fuel cell: Phase-change-induced flow. J. Electrochem. Soc. 156, B353. doi:10.1149/1.3046136
Kobayashi, A., Fujii, T., Harada, C., Yasumoto, E., Takeda, K., Kakinuma, K., et al. (2021). Effect of pt and ionomer distribution on polymer electrolyte fuel cell performance and durability. ACS Appl. Energy Mat. 4, 2307–2317. doi:10.1021/acsaem.0c02841
Kongkanand, A., and Mathias, M. F. (2016). The priority and challenge of high-power performance of low-platinum proton-exchange membrane fuel cells. J. Phys. Chem. Lett. 7, 1127–1137. doi:10.1021/acs.jpclett.6b00216
Kulikovsky, A. (2010). The regimes of catalyst layer operation in a fuel cell. Electrochimica acta 55, 6391–6401. doi:10.1016/j.electacta.2010.06.053
Kusoglu, A., Kwong, A., Clark, K. T., Gunterman, H. P., and Weber, A. Z. (2012). Water uptake of fuel-cell catalyst layers. J. Electrochem. Soc. 159, F530–F535. doi:10.1149/2.031209jes
Kusoglu, A., and Weber, A. Z. (2017). New insights into perfluorinated sulfonic-acid ionomers. Chem. Rev. 117, 987–1104. doi:10.1021/acs.chemrev.6b00159
Li, Y., Chen, H., Xiao, S., Alibakhshi, M. A., Lo, C.-W., Lu, M.-C., et al. (2019). Ultrafast diameter-dependent water evaporation from nanopores. Acs Nano 13, 3363–3372. doi:10.1021/acsnano.8b09258
Lin, R., Wang, H., and Zhu, Y. (2021). Optimizing the structural design of cathode catalyst layer for pem fuel cells for improving mass-specific power density. Energy 221, 119909. doi:10.1016/j.energy.2021.119909
Liu, C. P., Saha, P., Huang, Y., Shimpalee, S., Satjaritanun, P., and Zenyuk, I. V. (2021). Measurement of contact angles at carbon fiber–water–air triple-phase boundaries inside gas diffusion layers using x-ray computed tomography. ACS Appl. Mat. Interfaces 13, 20002–20013. doi:10.1021/acsami.1c00849
Liu, J., García-Salaberri, P. A., and Zenyuk, I. V. (2019a). Bridging scales to model reactive diffusive transport in porous media. J. Electrochem. Soc. 167, 013524. doi:10.1149/2.0242001jes
Liu, J., García-Salaberri, P. A., and Zenyuk, I. V. (2019b). The impact of reaction on the effective properties of multiscale catalytic porous media: A case of polymer electrolyte fuel cells. Transp. Porous Media 128, 363–384. doi:10.1007/s11242-019-01252-8
Liu, J., Gazzarri, J., and Eikerling, M. (2013). Model-based ex situ diagnostics of water fluxes in catalyst layers of polymer electrolyte fuel cells. Fuel Cells 13, 134–142. doi:10.1002/fuce.201200072
Liu, J., and Zenyuk, I. V. (2018). Proton transport in ionomer-free regions of polymer electrolyte fuel cells and implications for oxygen reduction reaction. Curr. Opin. Electrochem. 12, 202–208. doi:10.1016/j.coelec.2018.11.015
Lu, Z., Wilke, K. L., Preston, D. J., Kinefuchi, I., Chang-Davidson, E., and Wang, E. N. (2017). An ultrathin nanoporous membrane evaporator. Nano Lett. 17, 6217–6220. doi:10.1021/acs.nanolett.7b02889
Lv, H., and Mu, S. (2014). Nano-ceramic support materials for low temperature fuel cell catalysts. Nanoscale 6, 5063–5074. doi:10.1039/c4nr00402g
Malik, F., Clement, R., Gethin, D., Kiernan, M., Goral, T., Griffiths, P., et al. (2016). Hierarchical structures of cactus spines that aid in the directional movement of dew droplets. Phil. Trans. R. Soc. A 374, 20160110. doi:10.1098/rsta.2016.0110
Mardle, P., and Du, S. (2022). Introduction to materials for pemfc electrodes. J. Encycl. Smart Mater., 242–255.
Martinez-Urrutia, A., de Arroiabe, P. F., Ramirez, M., Martinez-Agirre, M., and Bou-Ali, M. M. (2018). Contact angle measurement for libr aqueous solutions on different surface materials used in absorption systems. Int. J. Refrig. 95, 182–188. doi:10.1016/j.ijrefrig.2018.05.041
Mashio, T., Sato, K., and Ohma, A. (2014). Analysis of water adsorption and condensation in catalyst layers for polymer electrolyte fuel cells. Electrochimica Acta 140, 238–249. doi:10.1016/j.electacta.2014.07.058
Meng, Q. H., Hao, C., Yan, B., Yang, B., Liu, J., Shen, P. K., et al. (2022). High-performance proton exchange membrane fuel cell with ultra-low loading pt on vertically aligned carbon nanotubes as integrated catalyst layer. J. Energy Chem. 71, 497–506. doi:10.1016/j.jechem.2022.03.018
Middelman, E. (2002). Improved pem fuel cell electrodes by controlled self-assembly. Fuel Cells Bull. 9–12, 9–12. doi:10.1016/s1464-2859(02)11028-5
MoghadamEsfahani, R. A., Vankova, S. K., Easton, E. B., Ebralidze, I. I., and Specchia, S. (2020). A hybrid pt/nbo/cnts catalyst with high activity and durability for oxygen reduction reaction in pemfc. Renew. Energy 154, 913–924. doi:10.1016/j.renene.2020.03.029
Mu, Y.-T., He, P., Gu, Z.-L., Qu, Z.-G., and Tao, W.-Q. (2022). Modelling the reactive transport processes in different reconstructed agglomerates of a pefc catalyst layer. Electrochimica Acta 404, 139721. doi:10.1016/j.electacta.2021.139721
Murata, S., Imanishi, M., Hasegawa, S., and Namba, R. (2014). Vertically aligned carbon nanotube electrodes for high current density operating proton exchange membrane fuel cells. J. Power Sources 253, 104–113. doi:10.1016/j.jpowsour.2013.11.073
Muzaffar, T., Kadyk, T., and Eikerling, M. (2018). Tipping water balance and the pt loading effect in polymer electrolyte fuel cells: A model-based analysis. Sustain. Energy Fuels 2, 1189–1196. doi:10.1039/c8se00026c
Newman, J. (1966). Resistance for flow of current to a disk. J. Electrochem. Soc. 113, 501–502. doi:10.1149/1.2424003
Nguyen, H. L., Han, J., Nguyen, X. L., Yu, S., Goo, Y.-M., and Le, D. D. (2021). Review of the durability of polymer electrolyte membrane fuel cell in long-term operation: Main influencing parameters and testing protocols. Energies 14, 4048. doi:10.3390/en14134048
Orfanidi, A., Madkikar, P., El-Sayed, H. A., Harzer, G. S., Kratky, T., and Gasteiger, H. (2017). The key to high performance low pt loaded electrodes. J. Electrochem. Soc. 164, F418–F426. doi:10.1149/2.1621704jes
Ostroverkh, A., Johánek, V., Dubau, M., Kúš, P., Khalakhan, I., Šmíd, B., et al. (2019). Optimization of ionomer-free ultra-low loading pt catalyst for anode/cathode of pemfc via magnetron sputtering. Int. J. Hydrogen Energy 44, 19344–19356. doi:10.1016/j.ijhydene.2018.12.206
Owejan, J. P., Owejan, J. E., and Gu, W. (2013). Impact of platinum loading and catalyst layer structure on pemfc performance. J. Electrochem. Soc. 160, F824–F833. doi:10.1149/2.072308jes
Owejan, J. P., Trabold, T. A., and Mench, M. M. (2014). Oxygen transport resistance correlated to liquid water saturation in the gas diffusion layer of pem fuel cells. Int. J. Heat Mass Transf. 71, 585–592. doi:10.1016/j.ijheatmasstransfer.2013.12.059
Pan, C., Wu, H., Wang, C., Wang, B., Zhang, L., Cheng, Z., et al. (2008). Nanowire-based high-performance “micro fuel cells”: One nanowire, one fuel cell. Adv. Mat. 20, 1644–1648. doi:10.1002/adma.200700515
Park, J. E., Lim, J., Lim, M. S., Kim, S., Kim, O.-H., Lee, D. W., et al. (2019). Gas diffusion layer/flow-field unified membrane-electrode assembly in fuel cell using graphene foam. Electrochimica Acta 323, 134808. doi:10.1016/j.electacta.2019.134808
Park, J. H., and Aluru, N. (2009). Temperature-dependent wettability on a titanium dioxide surface. Mol. Simul. 35, 31–37. doi:10.1080/08927020802398884
Paul, D. K., McCreery, R., and Karan, K. (2014). Proton transport property in supported nafion nanothin films by electrochemical impedance spectroscopy. J. Electrochem. Soc. 161, F1395–F1402. doi:10.1149/2.0571414jes
Perrins, W., McKenzie, D. R., and McPhedran, R. (1979). Transport properties of regular arrays of cylinders. Proc. R. Soc. Lond. A. Math. Phys. Sci. 369, 207–225.
Perry, M. L., Newman, J., and Cairns, E. J. (1998). Mass transport in gas-diffusion electrodes: A diagnostic tool for fuel-cell cathodes. J. Electrochem. Soc. 145, 5–15. doi:10.1149/1.1838202
Pushkareva, I. V., Pushkarev, A. S., Kalinichenko, V. N., Chumakov, R. G., Soloviev, M. A., Liang, Y., et al. (2021). Reduced graphene oxide-supported pt-based catalysts for pem fuel cells with enhanced activity and stability. Catalysts 11, 256. doi:10.3390/catal11020256
Ramaswamy, N., Gu, W., Ziegelbauer, J. M., and Kumaraguru, S. (2020). Carbon support microstructure impact on high current density transport resistances in pemfc cathode. J. Electrochem. Soc. 167, 064515. doi:10.1149/1945-7111/ab819c
Sabarirajan, D. C., Liu, J., Qi, Y., Perego, A., Haug, A. T., and Zenyuk, I. V. (2020). Determining proton transport in pseudo catalyst layers using hydrogen pump dc and ac techniques. J. Electrochem. Soc. 167, 084521. doi:10.1149/1945-7111/ab927d
Sakai, K., Sato, K., Mashio, T., Ohma, A., Yamaguchi, K., and Shinohara, K. (2009). Analysis of reactant gas transport in catalyst layers; effect of pt-loadings. ECS Trans. 25, 1193–1201. doi:10.1149/1.3210674
Sánchez-Monreal, J., Vera, M., and García-Salaberri, P. A. (2018). Fundamentals of electrochemistry with application to direct alcohol fuel cell modeling ” in. Proton exchange membrane fuel cell. Rijeka: Intech, 121
Sánchez-Ramos, A., Gostick, J., and García-Salaberri, P. (2022). Modeling the effect of low pt loading cathode catalyst layer in polymer electrolyte fuel cells. part ii: Parametric analysis. J. Electrochem. Soc. 169, 074503. doi:10.1149/1945-7111/ac811d
Sánchez-Ramos, A., Gostick, J. T., and García-Salaberri, P. A. (2021). Modeling the effect of low pt loading cathode catalyst layer in polymer electrolyte fuel cells: Part i. model formulation and validation. J. Electrochem. Soc. 168, 124514. doi:10.1149/1945-7111/ac4456
Schuler, T., Chowdhury, A., Freiberg, A. T., Sneed, B., Spingler, F. B., Tucker, M. C., et al. (2019). Fuel-cell catalyst-layer resistance via hydrogen limiting-current measurements. J. Electrochem. Soc. 166, F3020–F3031. doi:10.1149/2.0031907jes
Sery, J., and Leduc, P. (2022). Fuel cell behavior and energy balance on board a hyundai nexo. Int. J. Engine Res. 23, 709–720. doi:10.1177/14680874211059046
Shen, S., Cheng, X., Wang, C., Yan, X., Ke, C., Yin, J., et al. (2017). Exploration of significant influences of the operating conditions on the local o 2 transport in proton exchange membrane fuel cells (pemfcs). Phys. Chem. Chem. Phys. 19, 26221–26229. doi:10.1039/c7cp04837h
Siroma, Z., Kakitsubo, R., Fujiwara, N., Ioroi, T., Yamazaki, S.-i., and Yasuda, K. (2009). Depression of proton conductivity in recast nafion® film measured on flat substrate. J. Power Sources 189, 994–998. doi:10.1016/j.jpowsour.2008.12.141
Spingler, F. B., Phillips, A., Schuler, T., Tucker, M. C., and Weber, A. Z. (2017). Investigating fuel-cell transport limitations using hydrogen limiting current. Int. J. Hydrogen Energy 42, 13960–13969. doi:10.1016/j.ijhydene.2017.01.036
Steinbach, A. J., Allen, J. S., Borup, R. L., Hussey, D. S., Jacobson, D. L., Komlev, A., et al. (2018). Anode-design strategies for improved performance of polymer-electrolyte fuel cells with ultra-thin electrodes. Joule 2, 1297–1312. doi:10.1016/j.joule.2018.03.022
Steinbach, A. J., Debe, M. K., Wong, J., Kurkowski, M. J., Haug, A. T., Peppin, D. M., et al. (2010). A new paradigm for pemfc ultra-thin electrode water management at low temperatures. ECS Trans. 33, 1179–1188. doi:10.1149/1.3484611
Stennett, A. K., Dempsey, G. L., and Gainer, J. L. (2006). trans-sodium crocetinate and diffusion enhancement. J. Phys. Chem. B 110, 18078–18080. doi:10.1021/jp064308+
Straubhaar, B., Pauchet, J., and Prat, M. (2015). Water transport in gas diffusion layer of a polymer electrolyte fuel cell in the presence of a temperature gradient. phase change effect. Int. J. hydrogen energy 40, 11668–11675. doi:10.1016/j.ijhydene.2015.04.027
Sun, X., Yu, H., Zhou, L., Gao, X., Zeng, Y., Yao, D., et al. (2020). Influence of platinum dispersity on oxygen transport resistance and performance in pemfc. Electrochimica Acta 332, 135474. doi:10.1016/j.electacta.2019.135474
Sun, Y., Cui, L., Gong, J., Zhang, J., Xiang, Y., and Lu, S. (2019). Design of a catalytic layer with hierarchical proton transport structure: The role of nafion nanofiber. ACS Sustain. Chem. Eng. 7, 2955–2963. doi:10.1021/acssuschemeng.8b03910
Taherian, F., Marcon, V., van der Vegt, N. F., and Leroy, F. (2013). What is the contact angle of water on graphene? Langmuir 29, 1457–1465. doi:10.1021/la304645w
Takeshita, T., Kamitaka, Y., Shinozaki, K., Kodama, K., and Morimoto, Y. (2020). Evaluation of ionomer coverage on pt catalysts in polymer electrolyte membrane fuel cells by co stripping voltammetry and its effect on oxygen reduction reaction activity. J. Electroanal. Chem. 871, 114250. doi:10.1016/j.jelechem.2020.114250
Talukdar, K., Delgado, S., Lagarteira, T., Gazdzicki, P., and Friedrich, K. A. (2019). Minimizing mass-transport loss in proton exchange membrane fuel cell by freeze-drying of cathode catalyst layers. J. Power Sources 427, 309–317. doi:10.1016/j.jpowsour.2019.04.094
Tellez-Cruz, M. M., Escorihuela, J., Solorza-Feria, O., and Compañ, V. (2021). Proton exchange membrane fuel cells (pemfcs): Advances and challenges. Polymers 13, 3064. doi:10.3390/polym13183064
Thomas, A., Maranzana, G., Didierjean, S., Dillet, J., and Lottin, O. (2014). Thermal and water transfer in pemfcs: Investigating the role of the microporous layer. Int. J. Hydrogen Energy 39, 2649–2658. doi:10.1016/j.ijhydene.2013.11.105
Tomadakis, M. M., and Sotirchos, S. V. (1993). Effective diffusivities and conductivities of random dispersions of nonoverlapping and partially overlapping unidirectional fibers. J. Chem. Phys. 99, 9820–9827. doi:10.1063/1.465464
Ureña, N., Pérez-Prior, M. T., Levenfeld, B., and García-Salaberri, P. A. (2021). On the conductivity of proton-exchange membranes based on multiblock copolymers of sulfonated polysulfone and polyphenylsulfone: An experimental and modeling study. Polymers 13, 363. doi:10.3390/polym13030363
Wang, M., Chen, M., Yang, Z., Liu, G., Lee, J. K., Yang, W., et al. (2019). High-performance and durable cathode catalyst layer with hydrophobic c@ ptfe particles for low-pt loading membrane assembly electrode of pemfc. Energy Convers. Manag. 191, 132–140. doi:10.1016/j.enconman.2019.04.014
Wang, Y., Diaz, D. F. R., Chen, K. S., Wang, Z., and Adroher, X. C. (2020a). Materials, technological status, and fundamentals of pem fuel cells–a review. Mater. today 32, 178–203. doi:10.1016/j.mattod.2019.06.005
Wang, Y., Qiu, B., Fan, S., Liu, J., Qin, Y., Jian, S., et al. (2020b). Membrane distillation of butanol from aqueous solution with polytetrafluoroethylene membrane. Chem. Eng. Technol. 43, 1160–1166. doi:10.1002/ceat.201900484
Weber, A. Z., and Kusoglu, A. (2014). Unexplained transport resistances for low-loaded fuel-cell catalyst layers. J. Mat. Chem. A 2, 17207–17211. doi:10.1039/c4ta02952f
Whiston, M. M., Azevedo, I. L., Litster, S., Whitefoot, K. S., Samaras, C., and Whitacre, J. F. (2019). Expert assessments of the cost and expected future performance of proton exchange membrane fuel cells for vehicles. Proc. Natl. Acad. Sci. U. S. A. 116, 4899–4904. doi:10.1073/pnas.1804221116
Wilson, M. S., and Gottesfeld, S. (1992). Thin-film catalyst layers for polymer electrolyte fuel cell electrodes. J. Appl. Electrochem. 22, 1–7. doi:10.1007/bf01093004
Xia, Z., Wang, S., Jiang, L., Sun, H., Liu, S., Fu, X., et al. (2015). Bio-inspired construction of advanced fuel cell cathode with pt anchored in ordered hybrid polymer matrix. Sci. Rep. 5, 16100–16111. doi:10.1038/srep16100
Xie, S., Choi, S.-I., Lu, N., Roling, L. T., Herron, J. A., Zhang, L., et al. (2014). Atomic layer-by-layer deposition of pt on pd nanocubes for catalysts with enhanced activity and durability toward oxygen reduction. Nano Lett. 14, 3570–3576. doi:10.1021/nl501205j
Yarlagadda, V., Carpenter, M. K., Moylan, T. E., Kukreja, R. S., Koestner, R., Gu, W., et al. (2018). Boosting fuel cell performance with accessible carbon mesopores. ACS Energy Lett. 3, 618–621. doi:10.1021/acsenergylett.8b00186
Ye, Q., and Van Nguyen, T. (2007). Three-dimensional simulation of liquid water distribution in a pemfc with experimentally measured capillary functions. J. Electrochem. Soc. 154, B1242. doi:10.1149/1.2783775
Yi, P., Peng, L., Lai, X., Li, M., and Ni, J. (2012). Investigation of sintered stainless steel fiber felt as gas diffusion layer in proton exchange membrane fuel cells. Int. J. hydrogen energy 37, 11334–11344. doi:10.1016/j.ijhydene.2012.04.161
Yoshida, T., and Kojima, K. (2015). Toyota mirai fuel cell vehicle and progress toward a future hydrogen society. Interface Mag. 24, 45–49. doi:10.1149/2.f03152if
Yoshino, S., Shinohara, A., Kodama, K., and Morimoto, Y. (2020). Fabrication of catalyst layer with ionomer nanofiber scaffolding for polymer electrolyte fuel cells. J. Power Sources 476, 228584. doi:10.1016/j.jpowsour.2020.228584
Yunzhe, J., Bowei, Z., Feifei, W., and Mengmeng, L. (2020). “Research on hydrogen energy and fuel cell vehicle roadmap in various countries.” in IOP Conference Series: Earth and Environmental Science, 512. IOP Publishing, 012136.
Zapardiel, D., and García-Salaberri, P. A. (2022). Modeling the interplay between water capillary transport and species diffusion in gas diffusion layers of proton exchange fuel cells using a hybrid computational fluid dynamics formulation. J. Power Sources 520, 230735. doi:10.1016/j.jpowsour.2021.230735
Zenyuk, I. V., Das, P. K., and Weber, A. Z. (2016a). Understanding impacts of catalyst-layer thickness on fuel-cell performance via mathematical modeling. J. Electrochem. Soc. 163, F691–F703. doi:10.1149/2.1161607jes
Zenyuk, I. V., Lamibrac, A., Eller, J., Parkinson, D. Y., Marone, F., Buchi, F. N., et al. (2016b). Investigating evaporation in gas diffusion layers for fuel cells with x-ray computed tomography. J. Phys. Chem. C 120, 28701–28711. doi:10.1021/acs.jpcc.6b10658
Zenyuk, I. V., and Litster, S. (2014). Modeling ion conduction and electrochemical reactions in water films on thin-film metal electrodes with application to low temperature fuel cells. Electrochimica Acta 146, 194–206. doi:10.1016/j.electacta.2014.08.070
Zhang, W., and Pintauro, P. N. (2011). High-performance nanofiber fuel cell electrodes. ChemSusChem 4, 1753–1757. doi:10.1002/cssc.201100245
Zhang, Y., Tao, Y., and Shao, J. (2021). Application of porous materials for the flow field in polymer electrolyte membrane fuel cells. J. Power Sources 492, 229664. doi:10.1016/j.jpowsour.2021.229664
Zhao, J., Shahgaldi, S., Alaefour, I., Xu, Q., and Li, X. (2018). Gas permeability of catalyzed electrodes in polymer electrolyte membrane fuel cells. Appl. Energy 209, 203–210. doi:10.1016/j.apenergy.2017.10.087
Zhao, J., Tu, Z., and Chan, S. H. (2021). Carbon corrosion mechanism and mitigation strategies in a proton exchange membrane fuel cell (pemfc): A review. J. Power Sources 488, 229434. doi:10.1016/j.jpowsour.2020.229434
Zhu, X., Zhang, H., Zhang, Y., Liang, Y., Wang, X., and Yi, B. (2006). An ultrathin self-humidifying membrane for pem fuel cell application: Fabrication, characterization, and experimental analysis. J. Phys. Chem. B 110, 14240–14248. doi:10.1021/jp061955s
Zientara, M., Jakubczyk, D., Litniewski, M., and Hołyst, R. (2013). Transport of mass at the nanoscale during evaporation of droplets: The hertz–knudsen equation at the nanoscale. J. Phys. Chem. C 117, 1146–1150. doi:10.1021/jp3091478
Nomenclature
APt Active Pt surface area/m2
Ageo ell geometric surface area/m2
ASR area-specific ohmic resistance/m2 S−1
a active specific surface area/m−1
alv liquid-vapor specific surface area/m−1
CO_{2} oxygen concentration/mol m−3
DO_{2} oxygen diffusivity in air/m2 s−1
Er reversible cell voltage/V
ECSA electrochemical surface area/m2 kg−1
F Faraday’s constant/C mol−1
f normalized diffusivity/–
g relative diffusivity/–
h specific enthalpy/J mol−1
I surface current density/A m−2
I/C ionomer-to-carbon weight ratio/–
io,c exchange current density of oxygen reduction reaction/
j volumetric current density/A m−3
K permeability/m2
k thermal conductivity/W m−1 K−1
kH dimensionless Henry’s constant/–
L pillar spacing/m
LPt Pt loading/kgPt m−2
lp nanopore spacing/m
Mi molecular mass of species i/kg mol−1
NO_{2} oxygen molar flux/mol m−2 s−1
Np number of nanopores per ionomer pillar/–
P (geometric) power density/W m−2
PPt Pt-specific power density/
p pressure/Pa
R radius/m
RO_{2} oxygen transport resistance/s m−1
RPt radius of Pt nanoparticle/m
R nanopore radius/m
Rv secondary pore radius/m
Ro universal gas constant/J mol−1 K−1
RH relative humidity/–
rf roughness factor/–
s water saturation/–
T temperature/K
t time/s
Vm molar volume/m3 mol−1
Vcell cell voltage/V
vc characteristic velocity/m s−1
x local coordinate through the nanoporous shell/m
y through-plane coordinate across the CL thickness/m
Greek letters
αc transfer coefficient of oxygen reduction reaction/–
β dimensionless net transport coefficient of water from anode to cathode/–
Γ dimensionless ratio of transport resistances/–
γ reaction order of oxygen reduction reaction/–
δ thickness/m
ɛ porosity or volume fraction/–
ηc cathode overpotential/V
θ contact angle/–
ν kinematic viscosity/m2 s−1
Π dimensionless factor related to the optimal design point/–
ρ density/kg m−3
σ conductivity/S m−1 or surface tension/N m−1
τ tortuosity factor/–
ϕ potential/V
Ω dimensionless ratio of characteristic times or penetration depths/–
Subscripts and superscripts
avg average
c cathode or capillary
ch channel
chcl channel-CL
cl catalyst layer
c + Pt electron-conductive material + Pt
d diffusion
des design
dry dry conditions
e electric
eff effective
flat flat surface
g gas
geo geometric
i ionomer
in inlet
knud Knudsen
l liquid
max maximum
min minimum
mol molecular
obs obstruction
ohm ohmic
opt optimum
p primary nanopore or proton
pc phase change
pem polymer electrolyte membrane
prim primary
sat saturation
sh shell
v viscous
w water
wet wet conditions
Keywords: catalyst layer, Pt loading, transport, optimization, performance, durability, proton exchange membrane fuel cell, fuel cell vehicle
Citation: García-Salaberri PA, Sánchez-Ramos A and Das PK (2022) On the optimal cathode catalyst layer for polymer electrolyte fuel cells: Bimodal pore size distributions with functionalized microstructures. Front. Energy Res. 10:1058913. doi: 10.3389/fenrg.2022.1058913
Received: 30 September 2022; Accepted: 26 October 2022;
Published: 06 December 2022.
Edited by:
Fabio Coral Fonseca, Instituto de Pesquisas Energéticas e Nucleares (IPEN), BrazilReviewed by:
Xiaohui Yan, Shanghai Jiao Tong University, ChinaYu-Tong Mu, Xi’an Jiaotong University, China
Copyright © 2022 García-Salaberri, Sánchez-Ramos and Das. This is an open-access article distributed under the terms of the Creative Commons Attribution License (CC BY). The use, distribution or reproduction in other forums is permitted, provided the original author(s) and the copyright owner(s) are credited and that the original publication in this journal is cited, in accordance with accepted academic practice. No use, distribution or reproduction is permitted which does not comply with these terms.
*Correspondence: Pablo A. García-Salaberri, cGFnc2FsYWJAaW5nLnVjM20uZXM=