 Buhua Chen
 Hanjiang Liu1
- 1Laboratory of Cloud-Network Integration, Research Institute of China Telecom, Guangzhou, China
- 2Laboratory of Cloud-Network Integration, Research Institute of China Telecom, Shanghai, China
- 3Laboratory of Cloud-Network Integration, Research Institute of China Telecom, Beijing, China
Growing server energy consumption is a significant environmental issue, and mitigating it is a key technological challenge. Application-level energy minimization strategies depend on accurate modeling of energy consumption during an application’s execution. This paper presents a theoretical and experimental study of the dpMMSPFA model in the field of server energy consumption identification. The dpMMSPFA for classification of hidden spaces uses latent variable support vector machines (LVSVM) to learn discriminative subspaces with maximal marginal constraints. The factor analysis (FA) model, the similarity preservation (SP) item, the Dirichlet process mixture (DPM) model, and the maximal marginal classifier are jointly learned beneath a unified Bayesian architecture to advance classification of predictive power. The parameters of the proposed model can be inferred by the simple and efficient Gibbs sampling in terms of the conditional conjugate property. Empirical results on various datasets demonstrate that 1) max-margin joint learning can significantly improve the prediction performance of the model implemented by feature extraction and classification separately and meanwhile retain the generative ability; 2) dpMMSPFA is superior to MMFA when employing SP item and Dirichlet process mixture as prior knowledge; 3) the classification of dpMMSPFA model can often achieve better results on benchmark and measured energy server consumption datasets; 4) and the recognition rate can reach as high as 95.79% at 10 components, far better than other models on measured energy server consumption datasets.
1 Introduction
The issue of energy consumption in data centers has increased significantly in recent years due to the rapid growth of ICT technology and infrastructure. Especially since the outbreak of COVID-19 in 2020, the demand for digital services for economic and social development has skyrocketed, more and more consumer and commercial activities have turned to online, and the digital and information technology sectors have experienced tremendous growth. Omdia’s relevant statistics shows that consumer data traffic from cellular networks and fixed broadband will increase between 2018 and 2024 at a compound annual growth rate of 29%, increasing from 1.3 million PB in 2018 to 5.8 million PB in 2024. The current ICT infrastructure, which includes data centers, data center Internet, and Internet access networks, is put to a great deal of pressure by this development rate (Moises, 2021).
To meet the new demand, operators, cloud manufacturers and Internet enterprises have upgraded and expanded their data centers. While processing business load requires a lot of electric energy, the data center also generates a large amount of indirect carbon emissions. Global data centers’ power consumption, including those in China, is expected to rise from 2% in 2020 to over 4% in 2025 (DC Cooling, 2021). The hassle of high energy consumption has a serious impact on social security, climate warming, air quality and reliability of power grid. With the gradual depletion of traditional power sources and the soaring price, the cost of maintaining operational data will exceed the cost of purchasing system hardware. Therefore, the optimization of server energy consumption of a cloud operating system or a data center has become a greater essential problem in the current technical environment.
The ordinary way of measuring energy is to directly measure the electrical parameters of the server through the electrical instrument to achieve the actual energy of the server (Konstantakos et al., 2008; Rotem et al., 2012). However, this physical measurement approach can solely obtain the actual power, and it is impossible to analyze from these statistics what causes the rise, drop or unexpected change of power. Since the alternate of server energy consumption is bound to be accompanied via the change of system resource usage, it is necessary to design an identification model for energy usage, which can accurately classify the server energy consumption level, reflect the relationship between system resource utilization and server energy consumption, analyze the influence of resource utilization on energy consumption.
In brief overview, this paper proposes research on the Dirichlet max-margin factor analysis similarity preservation model (dpMMSPFA) for feature identification of server energy consumption level. To ensure that energy consumption analysis can be determined through high classification accuracy, this research aims to provide a comprehensive energy consumption feature recognition method that can meet the needs of high accuracy. It also aims to provide theoretical support and assist designers to control energy consumption when constructing servers.
1.1 The main contributions of the paper are summarized as follows
1) A novel Dirichlet maximum marginal similarity preservation factor analysis model (dpMMSPFA) that considers the FA model, the SP item, the Dirichlet process mixture model, and the LVSVMs is designed in a united Bayesian framework.
2) Extensive experimental analysis is conducted to validate the proposed model using widely adopted UCI benchmarks to evaluate generalization performance of the proposed MMSPFA model.
3) To create and train the model in this study, 17 features relating to server energy consumption are chosen and only 7.5% of all collected server energy consumption data (small training size) is used in training. The proposed approach is adjusted by experiments on altering value of hyper-parameters to achieve the best energy consumption feature recognition performance.
4) The proposed model is compared with other five models (including two-stage model and joint model) in the recognition ability of server workload (including “CPU intensive tasks”, “I/O intensive tasks”, “Load intensive tasks” and “Non-Loaded tasks”) under different energy consumption characteristic dimensions.
1.2 The bright structure of the accomplished paper is organized as follows
1) Section 1: This section explains the essential research significance of server energy consumption classification.
2) Section 2: The existing linear model and nonlinear model (machine learning, deep learning and reinforce learning), research on server energy consumption models and their defects are introduced. The development status of nonparametric Bayesian model is stated in this section.
3) Section 3: Four vital models underneath Bayesian framework are described, along with factor analysis (FA) model, similarity preservation supervision item (SP) model, Dirichlet mixture process (DPM) and latent variable support vector machine (LVSVM).
4) Section 4: The mathematical construction of the algorithm of the model focuses on the Gibbs sampling inference method, which lays an important foundation on the nonparametric Bayesian classification model dpMMSPFA proposed in Section 4. A Dirichlet max-margin factor analysis similarity preservation model (dpMMSPFA classification model) is proposed.
5) Section 5: Through the conducted experiments of dpMMSPFA model on UCI benchmark data and measured server energy consumption data, it indicates that dpMMSPFA model has notable identification performance and generalization performance.
6) Section 6: This section summarizes the primary work of this paper and the future research work of nonparametric Bayesian model and energy consumption research in intelligent hardware is envisaged and prospected.
2 Related work
2.1 Current research on server energy consumption model
The general layout of the data center energy consumption modeling and forecasting framework is shown in Figure 1. The parts of the data center can generally be separated into three levels: hardware, software, and applications. The server energy consumption that will be studied in this research is not only influenced by its hardware configuration, but also affected by its operating system and various application types. There are two types of server energy consumption models, linear and nonlinear, which have been applied to the research of server energy consumption estimation.
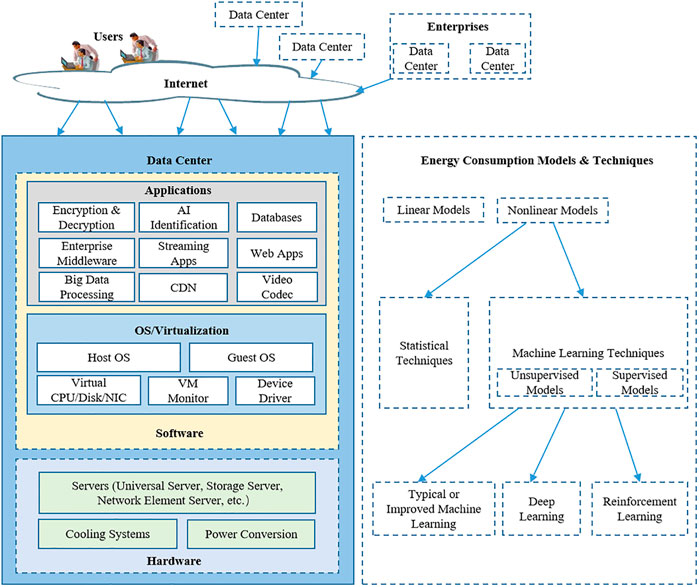
FIGURE 1. The general layout of the data center energy consumption modeling and forecasting framework.
Preliminary studies of prediction model for server energy consumption were based on the linear model (Pöss and Nambiar, 2010; Davis et al., 2012; Davis et al., 2014). Subramaniam and Feng, 2014 used the SPEC power benchmark to conduct tests on seven heterogeneous servers and evaluated the accuracy of the linear regression model based on CPU utilization (Kilper et al., 2011). The findings demonstrated that not all servers exhibit a linear relationship between power usage and server utilization characteristics. Therefore, researchers started to think about utilizing machine learning and deep learning nonlinear models to develop server energy consumption models to boost the precision of energy consumption forecasting and refine management of energy consumption control.
Real-world data frequently have a multimodal distribution, making it impossible for a straightforward classification/regression algorithm to provide an acceptable criterion. The dimensionality reduction techniques are categorized according to whether or not they incorporate supervised content, and can be essentially divided into two types, unsupervised and supervised dimensionality reduction. Unsupervised downscaling methods normally extract this characteristic information that maintains the statistics structure, while supervised downscaling techniques not solely extract low-dimensional information representations, but also carry certain a priori records (e.g., category information). In the discipline of unsupervised dimensionality reduction, FA (Chen et al., 2010; Shi et al., 2011; Du et al., 2012), PCA (Tharwat, 2016), and other techniques have a vital and far-reaching status, and for supervised dimensionality reduction methods, LDA strategies are widely valued and appreciated via researchers, experts and scholars. Zhou et al. (2018) incorporated PCA dimension reduction prior to applying the typical machine learning energy consumption model. While this somewhat alleviates the risk of instability and overfitting of prediction, it has certain restrictions on the processing of energy consumption data in general.
An energy consumption model FSDL based on feature selection and deep learning was proposed (Liang et al., 2020). In order to maximize the forecast accuracy of the energy consumption model, this model combines feature selection and deep learning techniques. This model is vulnerable to overfitting, though. Lin et al. (2020) developed three power consumption models based on BP neural networks, LSTM neural networks, and Elman neural networks, respectively. The prediction accuracy of the three power consumption models under various task loads is compared. When the cost of training and prediction accuracy are taken into account, ENN-PM outperforms TW_BP_PM and ML_STM-PM. As is common knowledge, humans are adept at recognizing a novel object from a relatively limited number of examples. In contrast, the deep learning technology requires a large amount of data to train a proper model. Especially when the number of neural network layers increases, the model becomes more complex. It will take more time and computing power to train the model to the convergence stage as the number of parameters to be optimized rises. The server energy consumption was forecasted via Q-learning, B-ANN, MLP and other reinforcement learning techniques (Shen et al., 2013; Li et al., 2010; Islam et al., 2012; Moreno and Xu, 2012; Caglar and Gokhale, 2014; et al., Tesauro et al., 2017). However, before the training effect may truly improve, reinforcement learning necessitates experience accumulation to a significant level. Additionally, it can be easier to fall into local optimization and not really achieve global optimization if the training object receives rewards from the environment in an untimely manner and the reward setting is unreasonable. This presents another challenge for reinforcement learning in the field of server energy consumption model.
2.2 The background for dpMMSPFA model
In light of the aforementioned restrictions and the fact that the characteristics of server energy consumption datasets have not been dealt with in depth, we made the decision to develop a novel machine learning model.
Data interrelationship evaluation, data dimensionality reduction, pattern classification, and characteristic description are all frequently carried out using the method of factor analysis (FA) (Chen et al., 2010; Shi et al., 2011; Du et al., 2012). In FA models, implicit factors serve as representations of low-dimensional observations of data in the hidden space. Even though FA is an unsupervised dimensionality reduction technique, it has the ability to not only reduce dimensions but also to represent how subspace and original space are reconfigured, with Bayesian inference used to implement the FA model. Since FA is an unsupervised model and without a priori data like label content, it can only characterize low-dimensional observations (Chen et al., 2010; Shi et al., 2011; Du et al., 2012). Many experts and academics have been interested in the topic of how to introduce supervised content of latent elements recently. Attempts have been made to include discriminative supervised content as properly part of the input elements (Lacoste-Julien et al., 2008; Jiang et al., 2011; Zhu et al., 2012; Zhu et al., 2013), and a supervised K-SVD approach of label consistency is proposed to train discriminative dictionaries for dispersed coding (Jiang et al., 2011). K-SVD assembly characterizes with each dictionary item to carry out the discriminative supervised approach for dispersed encoding during concordance learning (Jiang et al., 2011).
Thus, it seems that supervised content is very vital to boost the predictive ability for classification model. Against this background, our model determines to introduce label content material of the original input data, referred to as similarity preservation (SP) item. By introducing supervised content material into FA, the proposed model not only keeps the finest data description and characteristic extraction capabilities, but also maximizes the priori predictive potential of characterization content.
DP mixture (DPM) models have been introduced as nonparametric Bayesian clustering algorithms for ME models (Rasmussen and Ghahramani, 2001; Shahbaba and Neal, 2009; Zhang et al., 2014). As an illustration, Shahbaba and Neal, 2009 created the dpMNL, a multi-metric Logit (MNL) nonlinear model based on DP mixtures.
The foundation of recognition accuracy is the classification model. The most classical representatives are support vector machines and random forest (RF). Zoubin et al. (2015) transformed the random forest classification model into β- Bayesian posterior framework presents a new idea for creating classifiers in Bayesian framework. Although β- Bayesian posterior is not an actual Bayesian theoretical framework, there is still promising. Support vector machines (SVMs), as a traditional representative of classifiers (Upadhyay et al., 2021), are capable to maximize the margins between different classes of data. Data augmentation techniques characterize the latent variables of SVMs as LVSVMs (Polson and Scott, 2011), hence successfully inferring the further proposed Gibbs’ maximum marginal topic model (Zhu, et al., 2014) and fast maximum marginal matrix decomposition (Xu, et al., 2013).
In this study, we accordingly construct the Dirichlet maximum marginal similarity preservation factor analysis model (dpMMSPFA) with LVSVM, which mutually learns discriminative subspaces, supervised content, clustering and maximum marginal classifiers underneath a Bayesian architecture. Therefore, hidden representations are authentic and reasonable for supervised predictive recognition tasks. Gibbs MedLDA (Zhu et al., 2012; Zhu et al., 2013) was inferred via an efficient estimation algorithm, Gibbs sampling. Similarly, the ambit of dpMMSPFA can acquire desirable covariance underneath the motion of augmented variables. Thus, the model dpMMSPFA can be estimated with simple and effective Gibbs sampling for all parameters.
3 Preliminaries for dpMMSPFA model
3.1 Factor analysis (FA)
The precise inner structural links between high dimension observations and low dimension hidden variables can be represented by factor analysis models (FA). By projecting the high-dimensional observations into the low-dimensional space, the factor analysis model is able to determine the potential low-dimensional effective features of the data. Suppose there are N column vectors
FA is employed as an unsupervised archetypal model that does not make use of implicit features with label content to describe the initial observations of the data (Chen et al., 2010; Shi et al., 2011; Du et al., 2012). In context of this, we provide an approach for supervised data representation that, while simultaneously using FA to represent original observations, successfully increases the classifier’s predictive power by labeling content.
3.2 Similarity preservation (SP) item
The incorporation of supervised content to model learning can significantly enhance the classifier’s overall performance. We added the SP item to FA so that the extracted hidden variables could best characterize the original input data. This can maximize the a priori prediction ability of labelling content. Commonly, similarity is denoted by any symmetric positive definite matrix. Jiang et al. (2011) successfully improved the classifier’s recognition performance by relying it on label content. In a similar vein, the similarity preservation item (SP) in our suggested model yields label content illustration.
As shown in Eq. 2, we start from the cosine distance matrix.
where
The weight
An example of a sparse coding matrix
To find the best solution for the similarity preservation items, we employed singular vector decomposition (SVD) of the matrix
3.3 Dirichlet process mixture model (DPM)
A Dirichlet process
DP mixtures (DPM) can be used in cluster community problems where the kinds of clusters are uncertain (Rasmussen and Ghahramani, 2001; Shahbaba and Neal, 2009; Zhang et al., 2014). The DPM model can be expressed as Eq. 7, in which
To describe the distribution of the stochastic variable
DP, as a representative of the stick-breaking, has an apparently discrete stochastic variable
Based on the DP’s stick-breaking expression in Eq. 8, the DPM is then be given as
where
To make for use of the advantage of the nonparametric Bayesian method, as a supervised cluster model, dpMMSPFA is developed on the basis of the truncated stick-breaking DPM in this study.
3.4 Latent variable support vector machine (LVSVM)
SVM is a powerful machine learning tool that has been widely used in the field of pattern recognition, mainly due to its great generalization ability. Given a labelled training set with data vectors
where
In contrast to the conventional method, Polson and Scott, 2011 suggested a hidden variable method based on data augmentation technology to describe SVMs. With the assistance of the augmentation technology, new parameter information can be extracted from data samples and expanded into the original data samples. Any type of data can be expanded using data augmentation technologies to deepen the knowledge of the original information while also enhancing the data’s quality. By including auxiliary variables, the approach can be dealt with more easily. As a result of its widespread use in dealing with non-conjugate models, data augmentation has grown to be a highly powerful technique for resolving non-conjugate issues.
The pseudo-posterior distribution of an SVM can be expressed as a marginal distribution of a high-dimensional distribution with augmented variables. Thus, the complete pseudo-posterior distribution of the data can be written as
4 Methodology
4.1 dpMMSPFA model
As is mentioned above, for each column vector
and for each column vector
In dpMMSPFA, the hidden variable
where
On the basis of the DPM’s stick-breaking expression, FA model, SP term and LVSVM, our the hierarchical dpMMSPFA model is described as
We continue to add expressions and descriptions for proposed dpMMSPFA model:
where hyper-priors
Here the posterior computation is implemented by a Markov chain Monte Carlo (MCMC) algorithm based on Gibbs sampling, where the posterior distribution is approximated by a sufficient number of samples. Then, the conditional distributions used in Gibbs sampling are shown as follows.
For
where the posterior mean is
For
A Markov chain can be successfully created using the conditional distribution given above. Samples from the aforementioned conditional posterior distribution can be taken from each iteration in the expressions (19) and (20) depending on the initial conditions. The Markov chain is worked to run to finish the burn-in phase during the training phase. And with regard to Figure 2's architecture diagram for the integrated recognition system based on dpMMSPFA. The dpMMSPFA integrated recognition scheme comprises two stages: the MMSPFA model establishment phase, represented by the blue box in the diagram, and the usage phase of dpMMSPFA model, represented by the red box in the diagram. In the next section, we’ll go into more depth about these two phases.
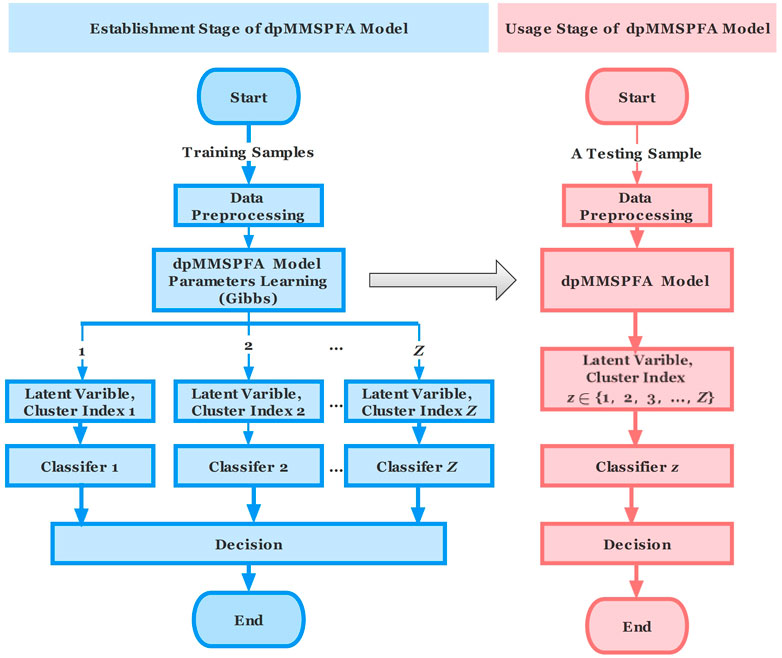
FIGURE 2. The classification system frame for dpMMSPFA.
4.2 Model learning
The dpMMSPFA model establishment is a supervised process, in which Gibbs sampling is used to infer model parameters summarized in Table 1. We run this Markov chain to finish the burn-in phase during the model establishment phase.
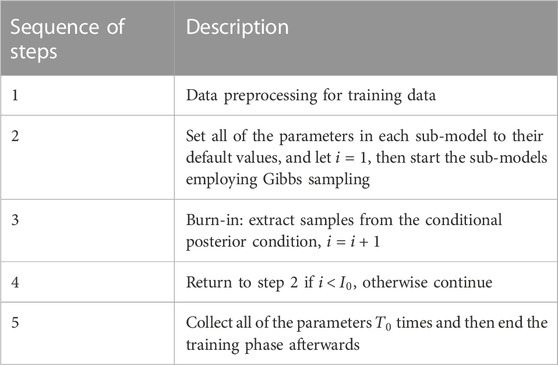
TABLE 1. The training stage of dpMMSPFA model.
4.3 Model prediction
While the dpMMSPFA model’s training phase is supervised, the model’s prediction process is unsupervised shown in Table 2. In the aforementioned procedures, it is essential to set the data sample so that all parameters are sampled
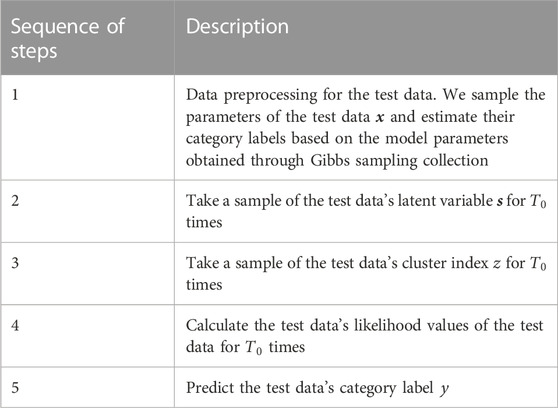
TABLE 2. The prediction stage of dpMMSPFA model.
The test data is pre-processed first, and the hidden variable
All the collected samples are averaged from Gibbs sampler to predict the label
where
5 Experiments
5.1 Classifiers and parameters setting
This section compares our proposed dpMMSPFA model to the following classification techniques and uses experimental data to demonstrate how effective and predictive it is on certain datasets. 1) PCA + SVM (Tharwat, 2016); 2) Kmeans + SVM (Wu and Peng, 2017); 3) LVSVM (SVM) (Polson, 2011), 4) dpMNL (Shahbaba and Neal, 2009), 5) MMFA, and 6) dpMMSPFA. In the experiments, the LVSVM classifier is used for PCA and Kmeans. The feature chosen and the classifier are different since models (1)–(2) are two-stage models. In joint approaches (5) and (6), LVSVM is employed, and the tuning parameter
5.2 UCI benchmark data
In this section, we perform experiments on Benchmark data sets of varying size and difficulty, and for each we average the accuracy over ten random splits. The benchmark data sets can be found at either the University of California at Irvine (UCI) or the Machine Learning Dataset Repository (Dua and Graff, 2022). Table 3 summarizes the data information.

TABLE 3. Characteristics of datasets used in experiments.
The average testing accuracy is displayed in Figure 3, with the best results throughout many components explicitly shown for each approach. The low-dimensional features that are extracted using unsupervised approach PCA may not be sufficient for the subsequent prediction task. Another two-stage model Kmeans, which build SVMs with an ensemble of clusters, performs well merely in some datasets. These two-stage models are unable to produce adequate outcomes as a result. The robustness of MNL’s classification performance is insufficient, making dpMNL less effective than the unsupervised joint model MMFA. In contrast to dpMNL and LVSVM, dpMMSPFA employs FA, which pulls out more beneficial features from cluster, label, and classification content using a unified Bayesian framework. MMFA is a particular instance of dpMMSPFA that does not entirely utilize the label content when there is just one cluster. As shown in Figure 3, the suggested model dpMMSPFA works well in the experiment and gets the maximum accuracy, especially when working with multimodal datasets like the German, Heart, and other similar cases. Figure 4 depicts the estimated posterior distributions of the number of clusters by dpMMSPFA. We can observe that, regarding the distribution of the data, the number of clusters detected by the dpMMSPFA is more logical.
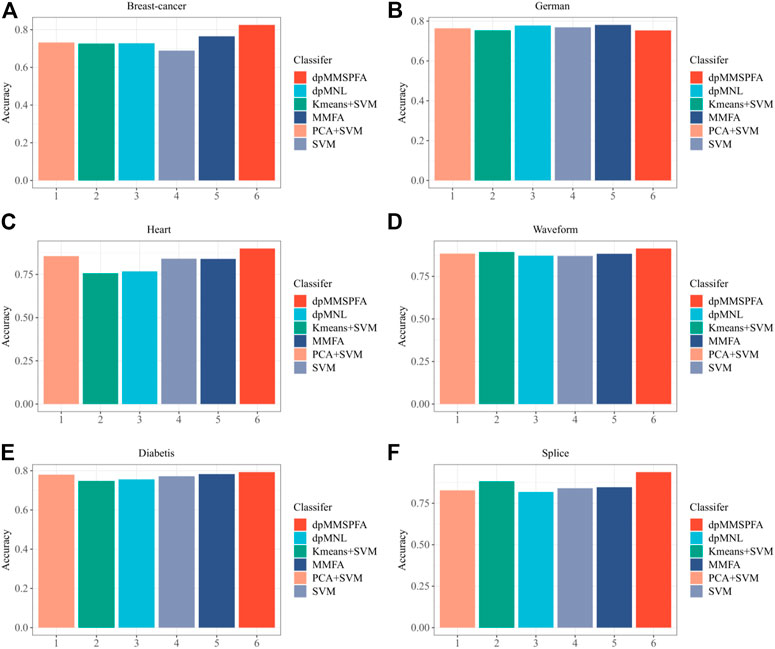
FIGURE 3. Test accuracies of different models (A) Breast-cancer; (B) German; (C) Heart; (D) Waveform; (E) Diabetis; (F) Splice.
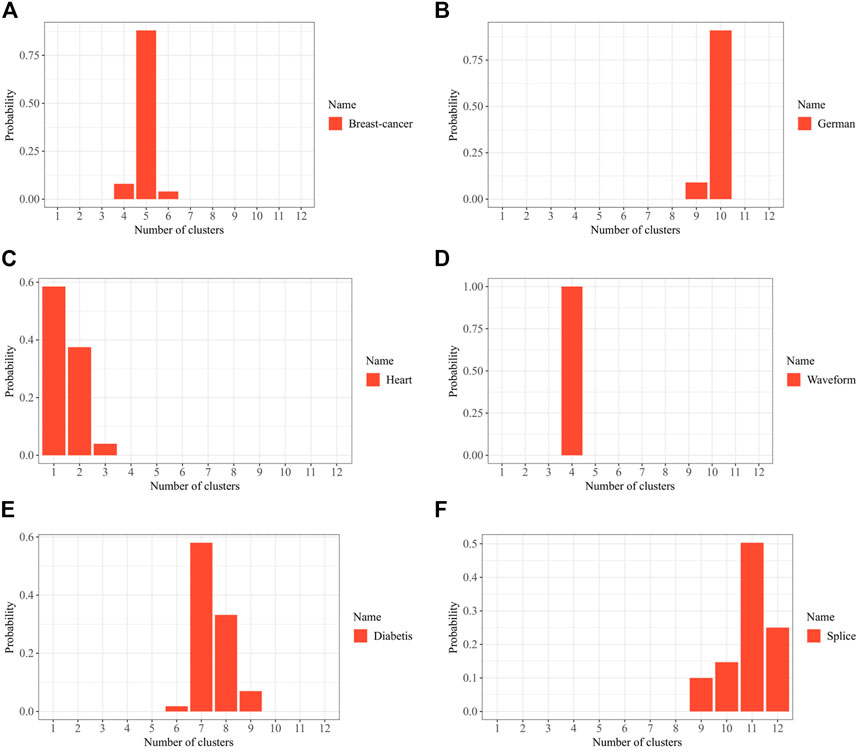
FIGURE 4. Approximate posterior distribution on the number of clusters by dpMMSPFA (A) Breast-cancer; (B) German; (C) Heart; (D) Waveform; (E) Diabetis; (F) Splice.
5.3 Server energy consumption data
The energy consumption grade is more valuable than the specific energy consumption data. It influences both the choice to purchase enterprise server assets and the decision to implement energy-saving measures at various levels of energy consumption. The 5 categories of energy consumption in this study, which range from low to high, are represented by the numbers [1, 2, 3, 4, 5] listed in Table 4.
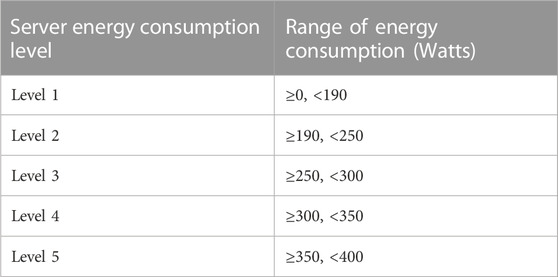
TABLE 4. Server energy consumption level and corresponding range.
In this section, we introduce dpMMSPFA to the server energy consumption level classification community. Results of the experiment are presented in this subsection chiefly based on measured Inspur NF5280M5 server. Table 5 displays the Inspur NF5280M5 server configuration used in this study. The power consumption is measured using an energy consumption tool through which “CPU intensive tasks”, “I/O intensive tasks”, “Load intensive tasks” and “Non-loaded tasks,” are produced, accordingly. Underneath Linux, there is a testing tool named “Stress”, a tool imposing a configurable amount of load on system, which is designed primarily for people who would like to test load systems and monitor on how these devices are operating (Ulianytskyi, 2022).
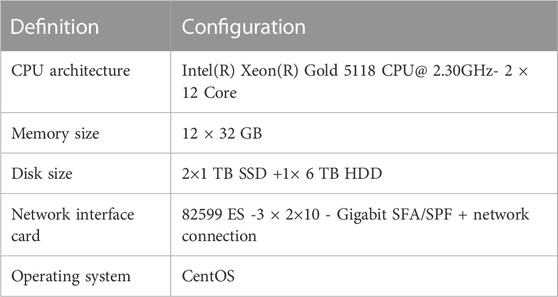
TABLE 5. Configuration of Inspur NF5280M5 server.
Load characteristic parameters of the Inspur NF5280M5 while it executes tasks under various loads are summarized in Table 6.
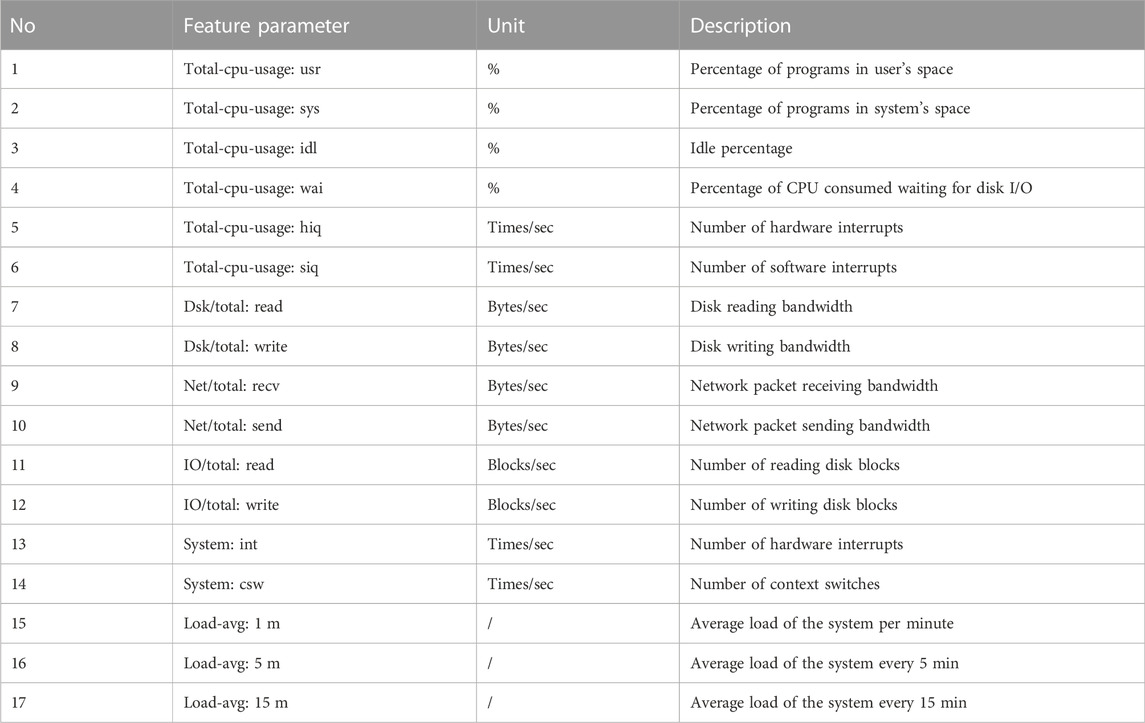
TABLE 6. Characteristic parameters.
Thermodynamic chart is a graphical representation of pattern similarity, with each component value in the matrix representing a different colour. The heatmap, the visualized
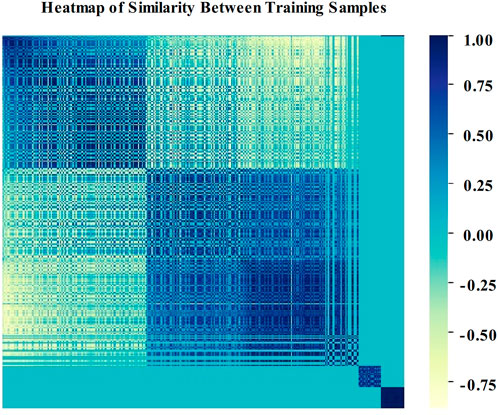
FIGURE 5. Similarity heatmap of sparse coding matrix represented by cosine function.
Since the Gamma hyper-parameters,
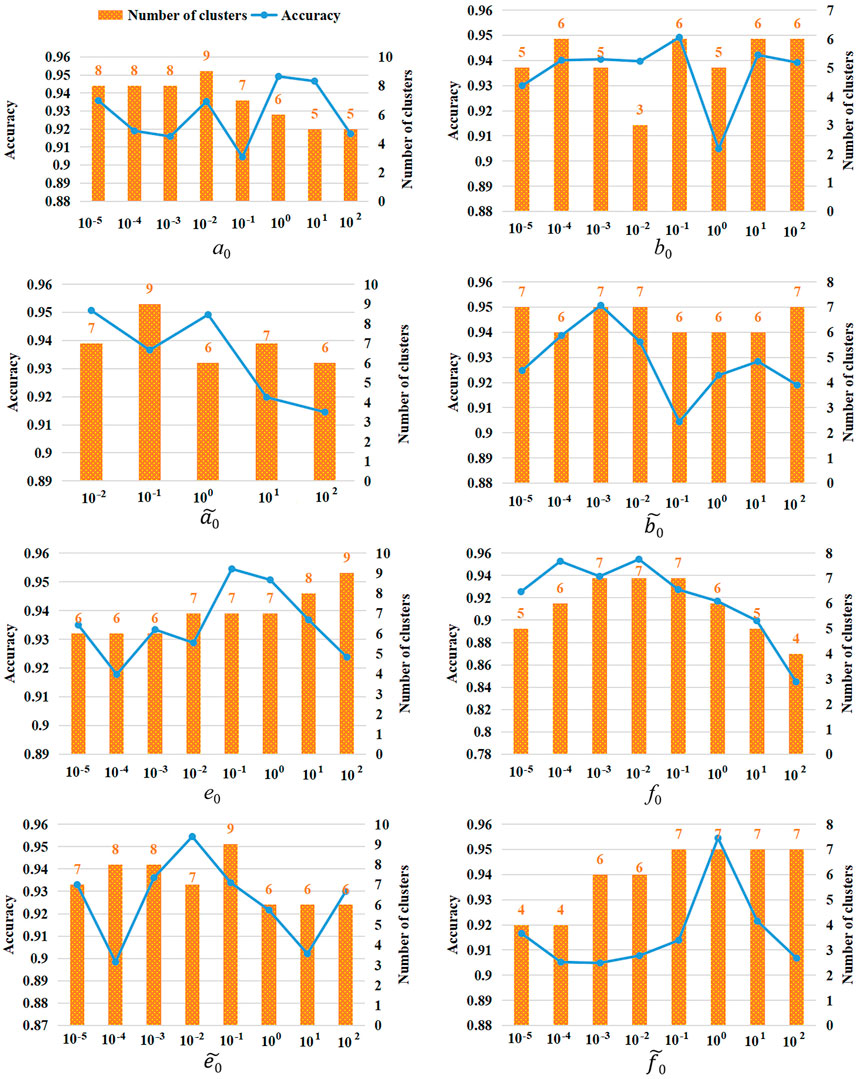
FIGURE 6. The recognition effects on the hyper-parameters.
Here, we provided the samples’ clustering results with a clustering number of 7 (samples have been processed by z-score). Figure 7 depicts that the sample proportion of each cluster is fairly uniform, and there are no instances whenever the proportion of a particular partition is too high or low, showing that the number of clusters that were automatically learned is appropriate and avoids the flaws with conventional clustering, such as overfitting. These results provide evidence to explain why 7 partitions can give remarkable energy consumption feature recognition performance aforementioned in the experiments in Figure 6.
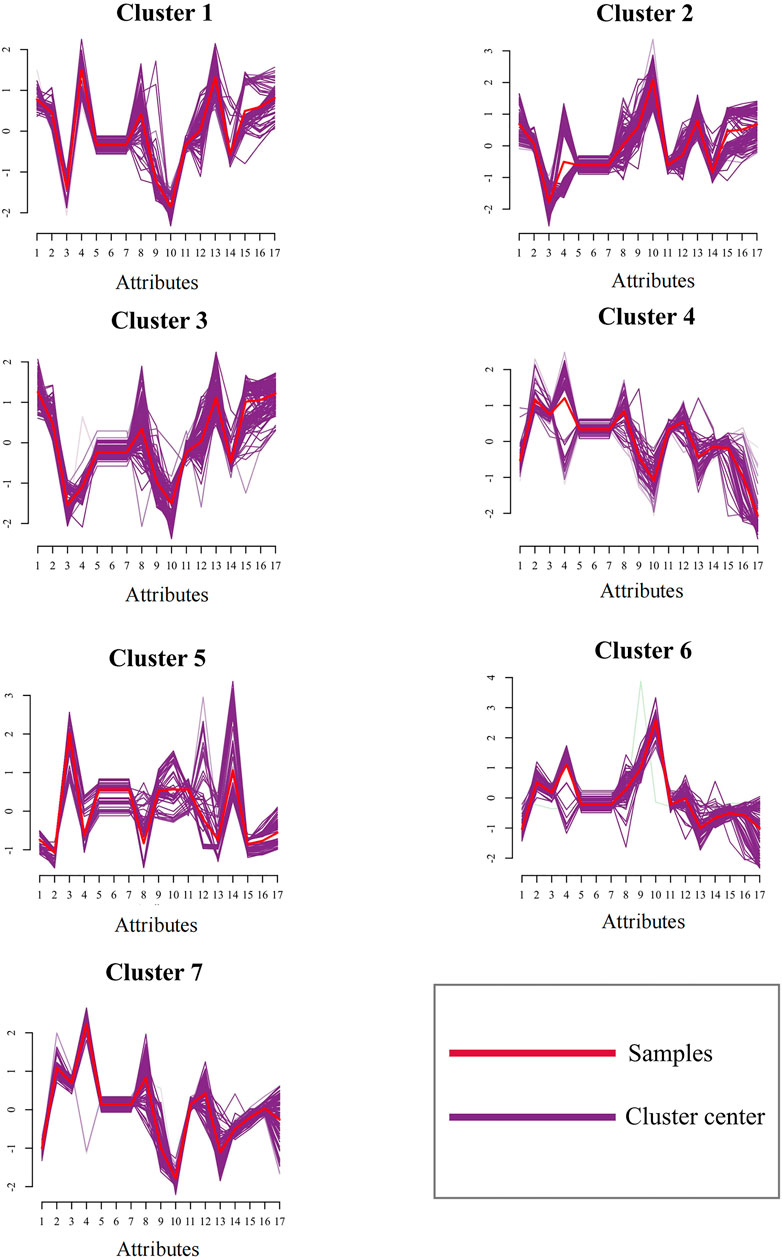
FIGURE 7. Clustering results by dpMMSPFA.
The commonly used CH (Calinski-Harabaz) and SC (Silhouette Coefficient) indexes (Zhang et al., 2021) were used to evaluate the clustering effectiveness and are compared with the clustering methods of Kmeans (Wu and Peng, 2017) and FCM (Bezdek et al.,1984) through experiments. This was done to further confirm the clustering effectiveness of dpMMSPFA after the DPM model is introduced in this paper. The clustering effect is often better the larger the CH and SC. When the automatic clustering results are 6 and 7, we continued to run the dpMMSPFA clustering effectiveness experiment in accordance with the experiment in Figure 6. We set the number of clusters from 2–10 at an interval of 1, conducted cluster effectiveness evaluation statistics, and ensured that the number of clusters is appropriate for Kmeans and FCM. According to the experimental findings in Figure 8, the value of dpMMSPFA is closer to 1 than that of Kmeans and FCM, which means the effect is better and the volatility is lower than that of FCM when using CH to assess the efficacy of clustering. The effectiveness of clustering is assessed for SC. Overall, the dpMMSPFA clustering results have a larger ratio of inter group to intra group dispersion, and the effect is superior to that of Kmeans and FCM. Despite the fact that under the SC index, the volatility of dpMMSPFA is higher than that of FCM, most SC indexes of dpMMSPFA exhibit superior clustering outcomes than FCM. The clustering evaluation experiment also proves that the excellent recognition performance of 6 and 7 clusters in the experiment in Figure 6 is inseparable from the effectiveness of the dpMMSPFA automatically clustering.
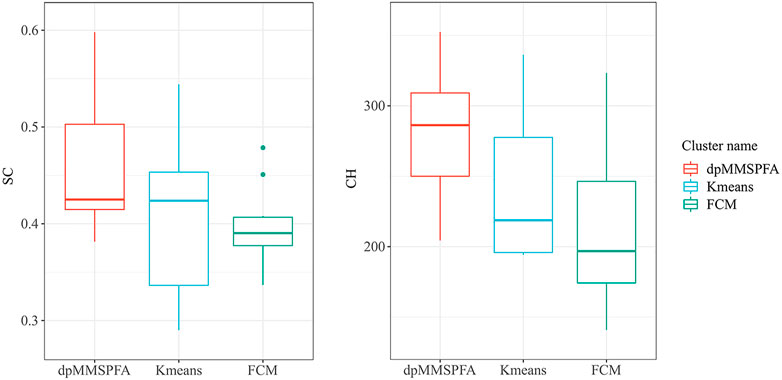
FIGURE 8. Boxplot of clustering effectiveness comparison.
Figure 9 depicts the relationship between classification performance and the number of features in the aforementioned models. The experimental findings confirm the continued effectiveness of our suggested dpMMSPFA. The highest accuracy of 95.79% is achieved by dpMMSPFA when 10 extracted components are used. Due to the modest advantage of dimensionality reduction, PCA + LVSVM outperforms all LVSVM model in classification, but as dimensionality increases, it falls short of dpMMSPFA’s classification performance. On the other hand, while LVSVM, Kmeans + LVSVM and dpMNL employ the original data as input features and the server-consumed data contains some redundant material, they both perform less effectively in terms of classification than dpMMSPFA. Additionally, dpMMSPFA performs better than two-stage separation models and has a relatively robust ability for energy consumption classification. According to Figure 9, MMFA has a greater classification prediction performance than other classifiers but a poorer prediction performance than dpMMSPFA most of the time. Joint learning used in a joint architecture can therefore significantly enhance categorization performance. Furthermore, it is crucial to include SP elements and clustering in the joint architecture. The outcomes also demonstrate that using additional characteristics enhances classification performance which is consistent with the theoretical dpMMSPFA framework. The introduction of more and more redundant feature content, however, led to a decline in classification performance, which is why accuracy did not always rise as the number of features increased.
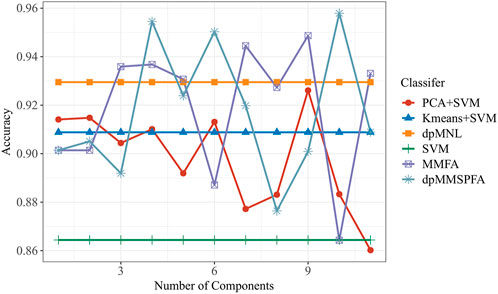
FIGURE 9. Test accuracy on energy consumption classification under different components.
6 Conclusion and future work
For the classification of energy consumption, we develop the Dirichlet maximum marginal similarity preservation factor analysis (dpMMSPFA) model. The Bayesian statistical method and the maximal marginal criterion for classifiers are merged into a single framework by the data augmentation community. In the hidden space that FA extracts, dpMMSPFA concurrently learns the underlying structure of observation data, similarity preservation items, clusters, and classifiers. In summing up it can be stated that the usefulness and efficiency of our suggested dpMMSPFA model have been verified by experiments on datasets of measured server energy.
The Beta process is a crucial model in the nonparametric Bayesian field in addition to the Dirichlet model. When the classifier is given the original samples, it can nevertheless produce stunning recognition results for highly complex, multimodal, and dimensional data without the application of any dimension reduction techniques. Imagine that in the future research on energy consumption modeling, we unify the factor analysis (FA), Beta process and hidden variable support vector machine (LVSVM) beneath the framework of Bayesian theory. The hope is that it will be remarkable potential to achieve to produce enormously excellent recognition performance. For the classifier underneath the nonparametric Bayesian framework, except for the hidden variable support vector machine (LVSVM), there is no nonparametric Bayesian classifier with robust generalization ability. In fact, in the classification model, the overall performance of random forest (RF) is almost equal to that of SVM classifier, and it can even produce higher classification performance for low dimensional data. It deserves to be further studied the transformation of the random forest classification model into an actual random forest model underneath the nonparametric Bayesian framework, which will be a huge leap for nonparametric Bayesian models.
Additionally, as hardware has improved, a popular research topic is the energy consumption model for offloading server power to smart network interface cards (smart NIC), distributed processing units (DPU), graphics processing units (GPU), field programmable gate arrays (FPGA), and other hardware resources. In the future, we shall find out more about and explore the creation of an energy consumption model for intelligent hardware units.
Data availability statement
The raw data supporting the conclusions of this article will be made available by the authors, without undue reservation.
Author contributions
BC: Project design, Methodology, Software, Simulation, Writing-Original draft preparation, Content revision. HL: Data collection, Experiments discussion, Content revision. CS: Project discussion. BS: Discussion on experimental environment. KL: Supervision.
Funding
This work received the funding from the Science and Technology Project of Research Institute of China Telecom.
Conflict of interest
The authors declare that the research was conducted in the absence of any commercial or financial relationships that could be construed as a potential conflict of interest.
Publisher’s note
All claims expressed in this article are solely those of the authors and do not necessarily represent those of their affiliated organizations, or those of the publisher, the editors and the reviewers. Any product that may be evaluated in this article, or claim that may be made by its manufacturer, is not guaranteed or endorsed by the publisher.
References
Antoniak, C. E. (1974). Mixtures of dirichlet processes with applications to bayesian nonparametric problems. Ann. Stat. 2, 1152–1174. doi:10.1214/AOS/1176342871
Bezdek, J. C., Ehrlich, R., and Full, W. E. (1984). Fcm: The fuzzy c-means clustering algorithm. Comput. Geosciences 10, 191–203. doi:10.1016/0098-3004(84)90020-7
Caglar, F., and Gokhale, A. S. (2014), iOverbook: Intelligent resource-overbooking to support soft real-time applications in the cloud. 2014 IEEE 7th International Conference on Cloud Computing. Anchorage, AK, USA.
Chen, M., Silva, J. G., Paisley, J. W., Wang, C., Dunson, D. B., and Carin, L. (2010). Compressive sensing on manifolds using a nonparametric mixture of factor analyzers: Algorithm and performance bounds. IEEE Trans. Signal Process. 58, 6140–6155. doi:10.1109/TSP.2010.2070796
Data Center Cooling Working Group of China Refrigeration Society (Dc Cooling), (2021). Annual development research report on cooling technology of China data center. Beijing, China: China Architecture Press.
Davis, J. D., Rivoire, S., Goldszmidt, M., and Ardestani, E. K. (2012), Chaos: Composable highly accurate OS-based power models. 2012 IEEE International Symposium on Workload Characterization (IISWC). La Jolla, CA, USA.
Davis, J. D., Rivoire, S., and Goldszmidt, M. (2014). “Star-Cap: Cluster power management using software-only models,” 2014 43rd International Conference on Parallel Processing Workshops Minneapolis, MN, USA.
Du, L., Liu, H., Wang, P., Feng, B., Pan, M., and Bao, Z. (2012). Noise robust radar HRRP target recognition based on multitask factor analysis with small training data size. IEEE Trans. Signal Process. 60, 3546–3559. doi:10.1109/TSP.2012.2191965
Dua, D., and Graff, C. (2022). UCI machine learning repository. Available: https://archive.ics.uci.edu/ml/index.php (Accessed 0623, 2022).
Ferguson, T. S. (1973). A bayesian analysis of some nonparametric problems. Ann. Stat. 1, 209–230. doi:10.1214/AOS/1176342360
Islam, S., Keung, J. W., Lee, K., and Liu, A. (2012). Empirical prediction models for adaptive resource provisioning in the cloud. Future Gener. Comput. Syst. 28, 155–162. doi:10.1016/j.future.2011.05.027
Jiang, Z., Lin, Z. L., and Davis, L. S. (2011). “Learning a discriminative dictionary for sparse coding via label consistent K-SVD,” IEEE Conference on Computer Vision and Pattern Recognition (CVPR) Springs (Colorado, CO, USA).
Kilper, D. C., Atkinson, G., Korotky, S. K., Goyal, S., Vetter, P., Suvakovic, D., et al. (2011). Power trends in communication networks. IEEE J. Sel. Top. Quantum Electron. 17, 275–284. doi:10.1109/JSTQE.2010.2074187
Konstantakos, V., Chatzigeorgiou, A., Nikolaidis, S., and Laopoulos, T. (2008). Energy consumption estimation in embedded systems. IEEE Trans. Instrum. Meas. 57, 797–804. doi:10.1109/TIM.2007.913724
Lacoste-Julien, S., Sha, F., and Jordan, M. I. (2008). “DiscLDA: Discriminative learning for dimensionality reduction and classification,” 22th Annual Conference on Neural Information Processing Systems (NIPS) (Vancouver: British Columbia, Canada).
Levy, Moises (2021). Data centers: Energy consumption is all about workloads. https://omdia.tech.informa.com/OM018224/Data-centers-Energy-consumption-is-all-about-workloads (Accessed June 11, 2021).
Li, Q., Guo, B., Shen, Y., Wang, J., Wu, Y., and Liu, Y. (2010). An embedded software power model based on algorithm complexity using back-propagation neural networks, 2010 IEEE/ACM Int'l Conference on Green Computing and Communications & Int'l Conference on Cyber, Physical and Social Computing. Hangzhou, China.
Liang, Y., Hu, Z., and Li, K. (2020). Power consumption model based on feature selection and deep learning in cloud computing scenarios. IET Commun. 14, 1610–1618. doi:10.1049/iet-com.2019.0717
Lin, W., Wu, G., Wang, X., and Li, K. (2020). An artificial neural network approach to power consumption model construction for servers in cloud data centers. IEEE Trans. Sustain. Comput. 5, 329–340. doi:10.1109/TSUSC.2019.2910129
Moreno, I. S., and Xu, J. (2012), Neural network-based overallocation for improved energy-efficiency in real-time cloud environments. 2012 IEEE 15th International Symposium on Object/Component/Service-Oriented Real-Time Distributed Computing. Shenzhen, China.
Polson, N. G., and Scott, S. L. (2011). Data augmentation for support vector machines. Bayesian Anal. 6, 1–23. doi:10.1214/11-BA601
Pöss, M., and Nambiar, R. O. (2010). “A power consumption analysis of decision support systems,” 2010 1st joint WOSP/SIPEW international conference on performance engineering (San Jose, California, USA).
Quadrianto, N., and Ghahramani, Z. (2015). A very simple safe-bayesian random forest. IEEE Trans. Pattern Anal. Mach. Intell. 37, 1297–1303. doi:10.1109/TPAMI.2014.2362751
Rasmussen, C. E., and Ghahramani, Z. (2001). “Infinite mixtures of Gaussian process experts,” in 21th Annual Conference on Neural Information Processing Systems (NIPS) (Vancouver: British Columbia, Canada).
Rotem, E., Naveh, A., Ananthakrishnan, A., Weissmann, E., and Rajwan, D. (2012). Power-management architecture of the intel microarchitecture code-named sandy bridge. IEEE Micro 32, 20–27. doi:10.1109/MM.2012.12
Shahbaba, B., and Neal, R. M. (2009). Nonlinear models using dirichlet process mixtures. J. Mach. Learn. Res. 10, 1829–1850. doi:10.5555/1577069.1755846
Shen, H., Tan, Y., Lu, J., Wu, Q., and Qiu, Q. (2013). Achieving autonomous power management using reinforcement learning. ACM Trans. Des. Autom. Electron. Syst. 18 (24), 1–2432. doi:10.1145/2442087.2442095
Shi, L., Wang, P., Liu, H., Xu, L., and Bao, Z. (2011). Radar HRRP statistical recognition with local factor analysis by automatic bayesian ying-yang harmony learning. IEEE Trans. Signal Process. 6, 610–617. doi:10.1109/TSP.2010.2088391
Subramaniam, B., and Feng, W. (2014). “Enabling efficient power provisioning for enterprise applications,” 2014 14th IEEE/ACM International Symposium on Cluster, Cloud and Grid Computing (Chicago, IL, USA).
Tesauro, G., Das, R., Chan, H. Y., Kephart, J., Levine, D. W., Rawson, F. L., et al. (2007). “Managing power consumption and performance of computing systems using reinforcement learning,” in 21th Annual Conference on Neural Information Processing Systems (NIPS) (Vancouver: British Columbia, Canada).
Tharwat, A. (2016). Principal component analysis - a tutorial. Int. J. Appl. Pattern Recognit. 3, 197–240. doi:10.1504/IJAPR.2016.10000630
Ulianytskyi, M. (2022). Packages for linux and unix. Available: https://https://pkgs.org/download/stress (Accessed 0623, 2022).
Upadhyay, P. C., Karanam, L., Lory, J. A., and DeSouza, G. N. (2021). “Classifying cover crop residue from rgb images: A simple SVM versus a SVM ensemble,” 2021 IEEE Symposium Series on Computational Intelligence (Orlando, FL, USA: SSCI).
Wu, W., and Peng, M. (2017). A data mining approach combining $K$ -means clustering with bagging neural network for short-term wind power forecasting. IEEE Internet Things J. 4, 979–986. doi:10.1109/JIOT.2017.2677578
Xu, M., Zhu, J., and Zhang, B. (2013). “Fast max-margin matrix factorization with data augmentation,” 30th International Conference on Machine Learning (Atlanta, USA: ICML-13).
Zhang, A., Zhu, J., and Zhang, B. (2014). “Max-margin infinite hidden Markov models,” 31th International Conference on Machine Learning (ICML-14) (Beijing, China).
Zhang, K., Hei, X., Fei, R., Guo, Y., and Jiao, R. (2021). “Cross-domain text classification based on BERT model,” 2021 International Conference on Database Systems for Advanced Applications (Taipei, Taiwan).
Zhou, Z., Abawajy, J. H., Li, F., Hu, Z., Chowdhury, M. U., Alelaiwi, A., et al. (2018). Fine-grained energy consumption model of servers based on task characteristics in cloud data center. IEEE Access 6, 27080–27090. doi:10.1109/ACCESS.2017.2732458
Zhu, J., Ahmed, A., and Xing, E. P. (2012). MedLDA: Maximum margin supervised topic models. J. Mach. Learn. Res. 13, 2237–2278. doi:10.5555/2503308.2503315
Zhu, J., Chen, N., Perkins, H., and Zhang, B. (2014). Gibbs max-margin topic models with data augmentation. J. Mach. Learn. Res. 15, 1073–1110. doi:10.5555/2627435.2638570
Keywords: server energy consumption, dpMMSPFA model, factor analysis, similarity preserving item, Dirichlet process mixture, latent variable support vector machine, classification performance
Citation: Chen B, Liu H, Shen C, Shen B and Li K (2023) Research on identification of server energy consumption characteristics via dirichlet max-margin factor analysis similarity preservation model. Front. Energy Res. 10:1064464. doi: 10.3389/fenrg.2022.1064464
Received: 08 October 2022; Accepted: 28 November 2022;
Published: 10 January 2023.
Edited by:
Youcai Liang, South China University of Technology, ChinaCopyright © 2023 Chen, Liu, Shen, Shen and Li. This is an open-access article distributed under the terms of the Creative Commons Attribution License (CC BY). The use, distribution or reproduction in other forums is permitted, provided the original author(s) and the copyright owner(s) are credited and that the original publication in this journal is cited, in accordance with accepted academic practice. No use, distribution or reproduction is permitted which does not comply with these terms.
*Correspondence: Buhua Chen, Y2hlbmJ1aEBjaGluYXRlbGVjb20uY24=