 Yi Yu1
 Yang Zeng
- 1Economics and Technology Research Institute, State Grid Hubei Electric Power Co, Ltd., Wuhan, China
- 2College of Electrical and Information Engineering, Hunan University, Changsha, China
With the fast growth of renewable energy, the modern power systems are transitioning to the renewable energy dominated energy systems. However, the intrinsic intermittence and volatility of renewable energy also impose considerable challenges on the power system operation. Hence, it is of great significance to accurately evaluate the renewable energy accommodation capacity (REAC) in power system so as to effectively instruct the sustainable development of renewable energy and to alleviate the ongoing operational burdens. This paper proposes a novel evaluation method of REAC in power system comprehensively considering peak and frequency regulation. First, the mechanism and cost of deep peak regulation of thermal power units are deeply analyzed, and then the frequency dynamics response is modeled explicitly and simplified effectively. Next, a synthetic interaction model of “source-network-storage” is developed with diversified generation units, network and energy storage constraints. Furthermore, a multi-objective optimization model is established considering both economic and technical issues, and a REAC evaluation method is developed by integrating an incremental capacity augment approach with the proposed multi-objective model. Finally, the proposed REAC evaluation method is tested on the modified IEEE 39-bus system, and the numerical results verify the effectiveness of the proposed method.
1 Introduction
Driven by the promotion of the clean and sustainable development of energy system, there has been a proliferation of various renewable energy units, e.g. wind turbines (WT) and photovoltaic (PV) panels, in the power systems over the past years, leading to the transition of the power system structure and operating features to be increasingly complex (Khalkho et al., 2022; Majeed et al., 2022). Due to the significant inconsistency between the generation pattern of renewable energy and the consumption pattern of load demand, the increasing integration of renewable energy exacerbates the difficulty for the peak shaving and valley filling of load, posing a substantial challenge to the peak regulation of the net load (You et al., 2022). Moreover, the replacement of conventional synchronous generation by the electronic-interfaced renewable energy generation will inevitably result in the continuous decline of power system inertia (Alves et al., 2021), which in turn weakens the frequency response ability to the emergencies and poses a serious threat to the power system stability. It has been reported that the present scale of renewable energy installation in some places of China has exceeded the accommodation capacity of its local power system, resulting in the substantial curtailment of wind power and photovoltaic power (Guo et al., 2020). Therefore, it is necessary to develop an effective evaluation method for accurate estimation of renewable energy accommodation capacity in order to provide a clear guidance for the progressive development and utilization of renewable energy.
Some efforts have been devoted to the investigation of renewable energy accommodation capacity (REAC) evaluation. To name it, the authors in (Lin et al., 2020) proposes a REAC evaluation method by simply considering the transmission line capacities in a power system simulation tool. In (He et al., 2018), peak load regulation and power equipment capacity limits have been identified as the key influencing factors of the REAC and based on this finding, an evaluation method is developed. In (Wang et al., 2016), an evaluation algorithm is proposed for the REAC based on sequential Monte Carlo simulation. Ref. (Zhang et al., 2019) uses the maximum flow model of network to study the REAC of power grid. Ref. (Chen et al., 2014) develops an assessment method for the renewable energy carrying capacity based on a stochastic long-term security constrained unit commitment model. However, the aforementioned research works oversimplify the various operating constraints of different devices, and also fail to account for the impact of deep peak regulation and frequency response on the evaluation outcome.
The interaction among power sources, network operator, load demand and energy storage exerts considerable influence on the REAC. Previously, most researchers merely focus on one simple aspect of the source-network-storage interaction. For instance, ref. (Xie et al., 2016) studies wind power accommodation capability from the perspective of network security. Ref. (Li et al., 2021) focuses on the correlation between wind power volatility and consumption capacity to evaluate the wind power consumption capacity. Ref. (Wang et al., 2018) investigates the power output model of WT and PV based on Copula theory to construct the REAC evaluation method. In (Xu et al., 2014), a probabilistic method is developed to determine the wind power accommodation capacity considering wind power and load scenarios. These works mainly focus on analyzing the influencing factors of renewable energy, and fail to account for the interaction among source, network, load and storage as a whole. Therefore, to overcome this drawback, the interaction of “source-network-storage” is accurately modeled in detail and is seamlessly integrated in the REAC evaluation method.
In a word, most existing studies fail to account for the impact of peak regulation and frequency response requirements on the REAC, and also do not fully consider the interaction among “source-network-storage.” To fill this research gap, this paper proposes an evaluation method of REAC considering peak regulation and frequency response requirements. First, the mechanism and cost of deep peak regulation of thermal power units is analyzed and then the frequency response dynamics is modeled explicitly and further simplified effectively. Subsequently, a comprehensive interaction model of “source-network-storage” is established with various generation, network and energy storage constraints. Finally, a novel REAC evaluation method is developed based on a proposed multi-objective optimization model considering both economic and technical issues. The contributions of this paper are three-fold as follows.
1) The peak regulation and frequency response requirements of power system are comprehensively incorporated in the proposed REAC evaluation method and explicitly modeled. Furthermore, to reduce computational complexity, the original complex peak regulation mechanism and frequency response dynamic are converted equivalently into several mathematically tractable mixed integer linear equations.
2) A multi-objective optimization model is established considering both the economic and technical issues in accommodating renewable energy, where the interaction among “source-network-storage” is fully considered to account for the realistic situation.
3) A novel REAC evaluation method is developed by integrating the above multi-objective optimization model with an incremental capacity augment approach. Consequently, the actual REAC which yields the lowest overall cost can be obtained efficiently and accurately.
The rest of this paper is arranged as follows. Section 2 analyzes the peak regulation mechanism and frequency response requirement of the power system. Section 3 constructs and analyzes a power system model considering “source-network-storage” interaction. Section 4 presents a multi-objective optimization model of power system and a method to evaluate the accommodation capacity of renewable energy. In Section 5, the simulation is carried out and the numerical results are discussed. Section 6 concludes the paper.
2 Peak and frequency regulation requirements
As is widely recognized, the high penetration of renewable energy in power system will aggravate the variation of net-load and thus increasing burden on peak load regulation. Furthermore, the replacement of conventional thermal generation by the electronic-interfaced renewable energy generation causes the significant decline of power system inertia, which places considerable stress on the frequency regulation. Therefore, it is necessary to deeply analyze the peak and frequency regulation requirements when evaluating the REAC.
2.1 Deep peak regulation mechanism
As conventional power generation units, e.g., thermal power units (TPU) and hydro units, are relatively more flexible in terms of regulation capacity compared with the renewable energy generation, they are the fundamental sources of peak regulation (Gao et al., 2020; Guan et al., 2022). The power output of the hydro units can be dropped to zero rapidly, while the thermal power units are subject to the lower limits of the power output in order to maintain the on-state operation. When the thermal power units are invoked for the deep peak regulation, their minimum level of power outputs can be further lowered to achieve higher regulation capacity. However, the deep peak regulation by the thermal power units will cause additional cost and highly complex. In the following, we will thoroughly analyze the deep peak regulation mechanism and its cost composition.
2.1.1 Deep peak regulation mechanism of thermal power unit
The peak regulation process of TPU consists of three states, namely the regular peak regulation (RPR), the deep peak regulation without oil (DPR), and the deep peak regulation with oil (DPRO), as shown in Figure 1A, where Pmax is the upper limit of the unit power output; Pmin is the minimum technical power output of the RPR state; Pa is the minimum stable power output of the DPR state; Pb is the minimum power output of the DPRO state. The operation costs of the thermal power unit during the deep peak regulation is composed of the coal consumption cost, tear-and-wear cost, oil input cost, and environmental pollution cost. The curve overall operation cost of thermal power unit considering deep peak regulation is shown in Figure 1B.
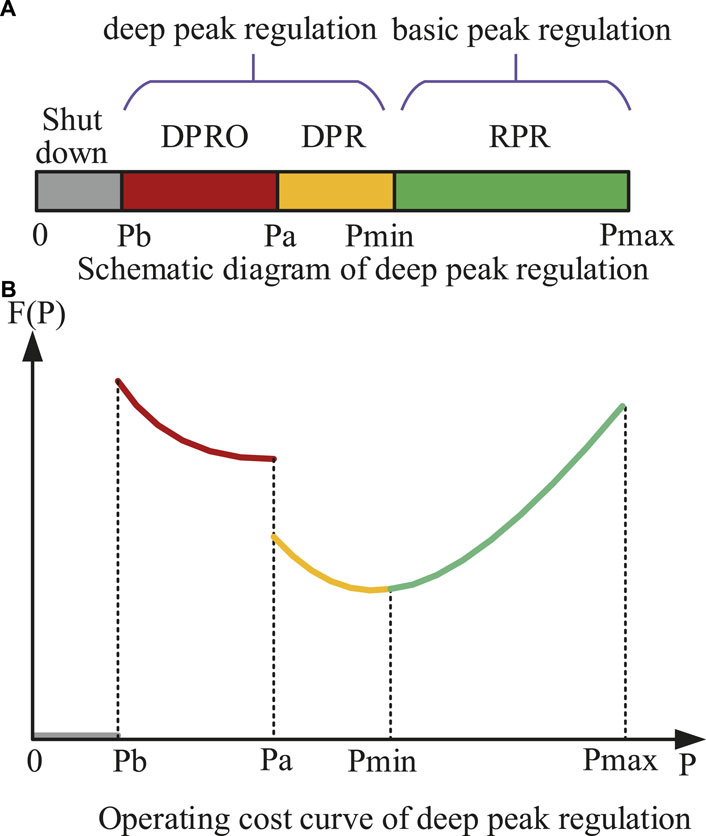
FIGURE 1. Deep peak regulation of thermal power unit. (A) Three states of peak regulation. (B) Overall operation cost curve in the deep peak regulation stage.
2.1.2 Deep peak regulation cost of thermal power unit
As can be seen from Figure 1, the operation cost of thermal power units is highly related to the deep peak regulation states. If the TPU is in the RPR state, its operation cost only consists of coal consumption cost. When the TPU is in the DPR and DPRO states, its power output deviates from the normal range leading to the accelerated aging of mechanical parts and shortening of its life cycle. Thus, in addition to the coal consumption cost, the TPU operation cost in the DPR and DPRO states also includes the tear-and-wear cost. When a TPU is operated in DRRO state, additional oil input is required to maintain the steady operation of the units, which will further cause environmental pollution. Hence, the costs of oil fuel and environment pollution should be taken into account. Therefore, the TPU operation cost in deep peak regulation state consists of coal consumption cost
Eq. 1a is the quadratic coal consumption cost of TPU i at the time t, where
Based on the discussed above, the overall operation cost of TPU in deep peak regulation can be expressed as Eq. 2.
where
2.1.3 The linearization of deep peak regulation cost
It can be seen from (1) and (2) the coal consumption cost
Both
where a is the input single variable of the function F(a) and its range is divided into K segments; ak and ak+1 are the two endpoints of the kth segment; δk is a continuous variable that represents the portion of the kth segment; σk−1 is an auxiliary binary variable that indicates whether a lies on the right-side of the kth segment.
The overall operation cost
where
The first two terms of Eq. 4a are nonlinear, which can be linearized using big M method. Eq. 4a can be reformulated as mixed integer linear equation as follows,
where
2.2 Frequency response requirements
The frequency response dynamic reflects the instantaneous power balance. When a large power disturbance occurs, the frequency may fall too fast or deviate too far from the nominal value if the frequency response requirement is not appropriated considered, which will further trigger the action of under frequency load shedding (UFLS) relay resulting in serious power accidents. In order to make the system have sufficient inertia support and maintain the frequency dynamic stability, the frequency dynamic response should be taken into account during REAC evaluation (Kushwaha et al., 2018).
2.2.1 Primary frequency response constraints
The frequency response process includes inertial response, primary frequency response (PFR), secondary and tertiary responses (Teng and Strbac, 2016). Since three key performance indices of frequency response, including rate of change of frequency RoCoF, frequency level at nadir fnadir, and frequency deviation level at quasi-steady state Δfss, are only related to the inertial response and PFR as shown in Figure 2, secondary and tertiary responses are not considered in this paper. Specifically, RoCoF reflects the rate of change in the frequency, fnadir reflects the largest frequency deviation during frequency response dynamic, and Δfss reflects the regulation effect of PFR at the stead state.
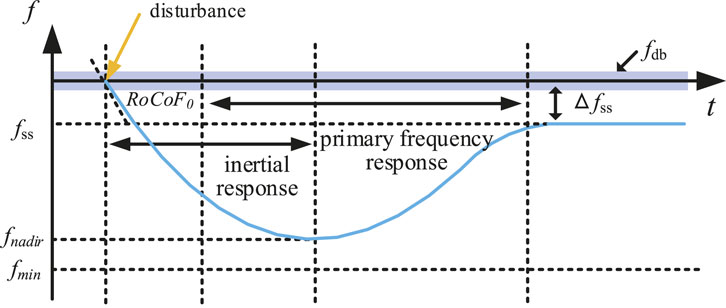
FIGURE 2. Schematic diagram of primary frequency dynamic response in power system.
The frequency response dynamic is affected by multiple factors, including system inertia, load variation, generator governor response, which results in a highly complex process. In order to reduce the computational complexity, the load damping rate is ignored. The frequency dynamics of the simplified system can be expressed by Eq. 6.
where Δf is the frequency deviation; f0 is the rated frequency, Sb is the system capacity base;
2.2.1.1 RoCoF limits
When an disturbance occurs, the power imbalance - ΔPL will arise which is equal to the difference between the change of system mechanical power output and electrical power output ΔPm - ΔPe. The RoCoF reaches the maximum at the occurrence of the interference according to (6), which is related to the system inertia and power imbalance (Wen et al., 2016). In order to prevent the triggering of UFLS relay caused by the too fast change of frequency, RoCoF should be maintained below a certain level RoCoFmax, as illustrated by the following equations.
Since
where
2.2.1.2 Frequency nadir limits
The frequency level at nadir fnadir is related to factors such as system inertia, governor response, and governor dead zone. In order to ensure the frequency does not fall below the minimum frequency requirement fmin or exceed the maximum frequency requirement fmax specified by the UFLS relay, the generator units involved in PFR should reserve sufficient frequency regulation capacity (Chávez et al., 2014). Meanwhile, the reserves of each unit participating in PFR should be delivered at or before the frequency level at nadir fnadir. Therefore, the reserve of each unit should not exceed an upper limit, so that the governor of each unit can respond rapidly and counteract the frequency deviation before the frequency exceeds the limit of the UFLS relay (Zhang et al., 2018). The constraints of the downward and upward reserves (RUi,t and RUi,t) of each unit after reformulation are demonstrated as follows,
where fdb is the frequency response dead-band of the governor, and
2.2.1.3 Frequency level limits at quasi steady state
After the generation units deliver the reserves, the system frequency will gradually recover, and then enter the quasi-steady state, so that the primary frequency response stage ends. The quasi-stable state frequency Δfss of the power system is related to the system droop coefficient Ks and interference power ΔPL.
where
3 Interaction modeling of “source-network-storage”
As previously discussed, in order to improve the REAC, it is necessary to take into account the interaction among various power sources, network and energy storage. To this end, detailed models of multiple types of power generation including TPU, hydro-power plant (HPP), wind farm and PV farm, energy storage systems including battery energy storage station (BES) and pumped storage power station (PSP) as well as transmission network are established in the following. Figure 3 demonstrates a graphical representation of modern power system with various power sources and energy storage systems, where the interaction of “source-network-storage” is achieved through power system scheduling.
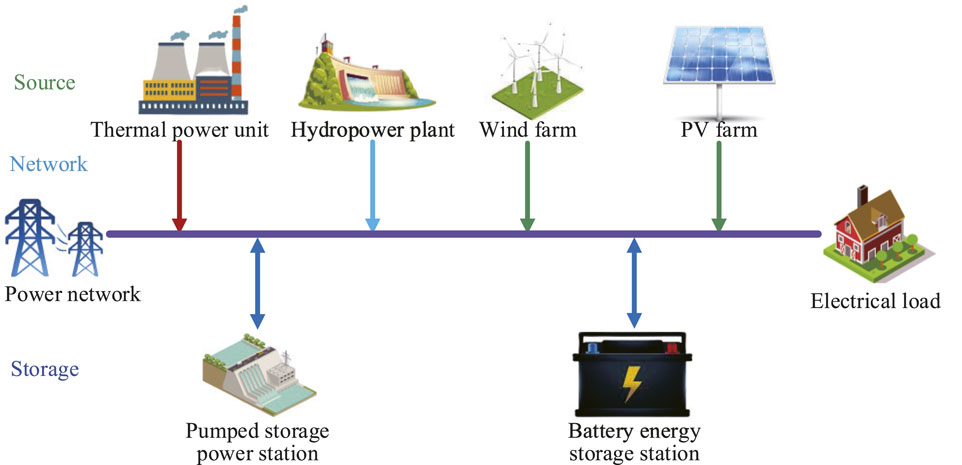
FIGURE 3. A modern power system with various power sources and energy storage systems.
3.1 Modeling of various power sources
3.1.1 Thermal power unit
With the increasing penetration of renewable energy, the role of TPU is changing from conventional energy supplier to the flexibility provider in order to accommodate renewable energy in power systems. The operational constraints of TPU are formulated as follows,
Constraint (11a) imposes the power output limits on TPU considering the deep peak regulation. Constraints (11b) and (11c) enforce the minimum on time limits and minimum off time limits, where MinUpi and MinDwi are the minimum on time limit and minimum off time limit, respectively; T denotes the operation horizon, which is divided into T time intervals with the duration of each time interval being 1 h. Constraints (11d) and (11e) describe the ramp rate limit of TPU, where
3.1.2 Hydro-power plant
As one of major power sources, HPP can be flexibly dispatched to meet the peak and frequency regulation requirements. The HPP mainly includes the following operational constraints.
Constraints (12a) and (12b) impose the limits of reservoir capacity, where Vh,t is the reservoir storage capacity at time t;
Since constraint (Eq. 12f) is nonlinear, in order to reduce computational complexity, the linearization method in (Babayev, 1997; Wu et al., 2008) is adopted. For HPP, constraint (Eq. 12g) is incorporated into constraint (Eq. 12f) to obtain the hydraulic conversion formula as
3.1.3 Renewable energy generation
The renewable energy is less flexible in power output adjustment. When it is required by the system operator, the renewable energy like PV and WT can be curtailed to maintain the power balance. The operational constraints of WT and PV mainly include:
constraints (14a) and (14b) illustrate the curtailment of wind power and PV power should not exceed their predicted output, where
3.2 Modeling of energy storage systems
The rapid development energy storage technology especially the battery energy storage provides a promising solution for the renewable energy accommodation problem. In this subsection, the operational models of both battery energy storage systems and pumped storage power station are established.
3.2.1 Battery energy storage
The flexible and rapid adjustment capability of BES can be deployed to provide peak regulation and frequency regulation support (Tan and Zhang, 2017; Carrión et al., 2018). The operational model of BES mainly includes the following constraints.
Constraints (15d) and (15b) describe the charge and discharge power limits of BES, where
3.2.2 Pumped storage power station
The PSP can be operated in either generating mode or pumping mode (Xia et al., 2019; Liu et al., 2021). Different operation modes can be switched smoothly. Thus, it is effective device for the peak shaving and valley filling of power system. The operational model of PSP consists of the following constraints. For brevity, we will define the subscriptions, superscriptions and several commonly used notations first and no longer illustrate those afterwards. Specifically, subscriptions p and g denote the indices of the pumped storage power station and pumped generation units with a PSP, respectively; Superscriptions pg and ph denote the generating mode and pumping mode, respectively; u denotes the operation state of the PSP or the unit; Y and Z represent the startup and shutdown indicators of the PSP unit, respectively.
Constraint (16a) ensures the simultaneous pumping and generating states of PSP is avoided. Constraint (16b) illustrates the operation states of internal units of PSP are consistent with operation state of the station. Constraints (16c) and (16d) impose the power generation limits and pumping power limits on individual PSP units, respectively, where
3.3 Modeling of power network
The DC power flow model is used to represent the power flow in transmission network (Li, 2014). The related constraints are formulated as follows.
Constraint (17a) describes the nodal active power balance of the network, where Pi,t and
4 Multi-objective optimization-based renewable energy accommodation capacity evaluation method
Accommodating renewable energy not only needs to resolve the technical issues as previously illustrated but also needs to tackle the economic issues since it does not necessary mean the higher penetration of the renewable brings about the lower overall operational cost of the entire power system. The relationship between overall operational cost and the penetration of renewable energy is illustrated in Figure 4. Intuitively, when the penetration of renewable energy is relatively low, increasing renewable energy installation will contribute to the reduction of overall operational cost as the costly thermal power is replaced by the free renewable energy generation. However, there exists a turning point where further improving renewable energy penetration no longer leads to the decline of the overall operational cost when the increment accommodation cost surpasses the extra energy cost saving. Thus, at this turning point the overall operational cost is lowest and mathematically it can be interpreted as the renewable energy accommodation capacity of the power system. To find the REAC accurately, it is necessary to establish a multi-objective optimization model considering both economic and technical issues.

FIGURE 4. The relationship between the overall cost and penetration of renewable energy.
4.1 Multi-objective optimization model
Multiple objectives need to be considered when optimizing the power system operation, including renewable energy curtailment penalty f1, renewable energy units daily maintenance cost f2, thermal power unit operation cost f3, battery energy system degradation cost f4, hydro-power plant startup/shutdown cost f5, pumped storage power station startup/shutdown cost f6, and the upward and downward reserve acquirement cost f7, which are formulated as follows.
where
Three categories of system security and operation constraints are considered as follows,
1) Constraints derived from the deep peak regulation requirement (4b), (5).
2) Constraints derive from the primary frequency response requirement (8), (9), (10).
3) Interaction model of “source-network-storage”, including consraints (11), (12), (14), (15), (16), (17).
4.2 Incremental capacity augmentation-based renewable energy accommodation capacity evaluation
Based on the established multi-objective optimization model, we develop an novel evaluation method of REAC in power system based on an incremental capacity augmentation approach. The flowchart of the proposed REAC method is demonstrated in Figure 5.
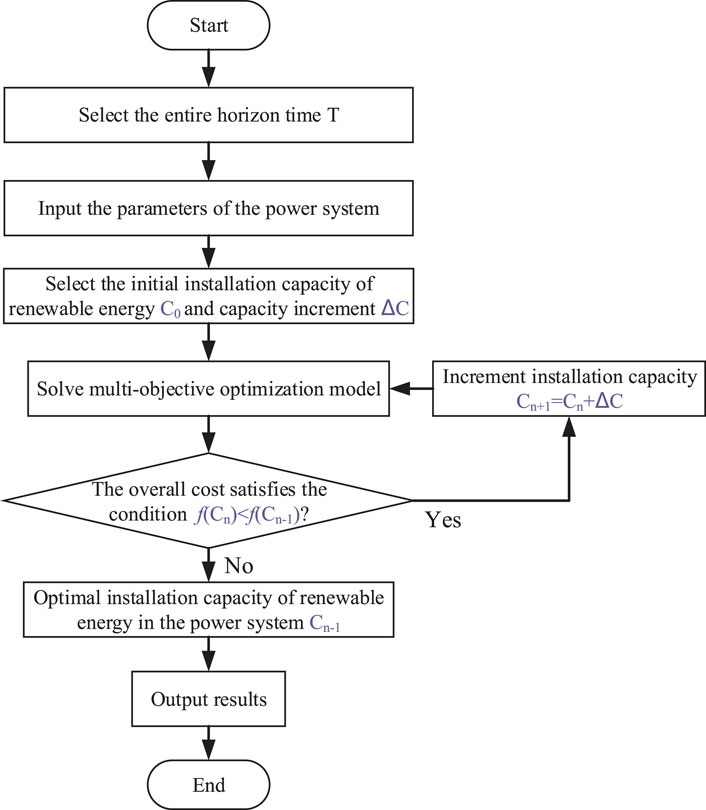
FIGURE 5. Flowchart of the proposed REAC evaluation method.
The proposed evaluation method of the REAC in power system consists of seven steps illustrated as follows,
Step (B1) Select the entire horizon time T;
Step (B2) Input the relevant parameters of the power system;
Step (B3) Select the initial installation capacity of renewable energy C0 and installation capacity increment ΔC;
Step (B4) Solve the established multi-objective optimization model by integrating the interaction of “source-network-storage” and the requirements of peak and frequency regulation.
Step (B5) Compare the solved optimal operational cost f (Cn) of this iteration with that f (Cn−1) of the last iteration. If the operation cost still declines, i.e., f (Cn) < f (Cn−1), increment the installation capacity of renewable energy by ΔC and return to Step (B4); otherwise, the installation capacity of renewable energy Cn−1 is recognized as the REAC of the power system.
Step (B6) Output the REAC result.
5 Numerical results
The proposed REAC evaluation method is tested on the modified IEEE 39-bus system to verify its effectiveness. All case studies are carried out on MATLAB platform using CPLEX as the MILP solver. The modified IEEE 39-bus system includes 8 TPUs, 2 HPPs, 2 wind farms, 2 PV farms, a BES and a PSP, as shown in Figure 6. The installation capacity of WT is set equal with that of PV, and the parameters of 2 HPPs are identical.
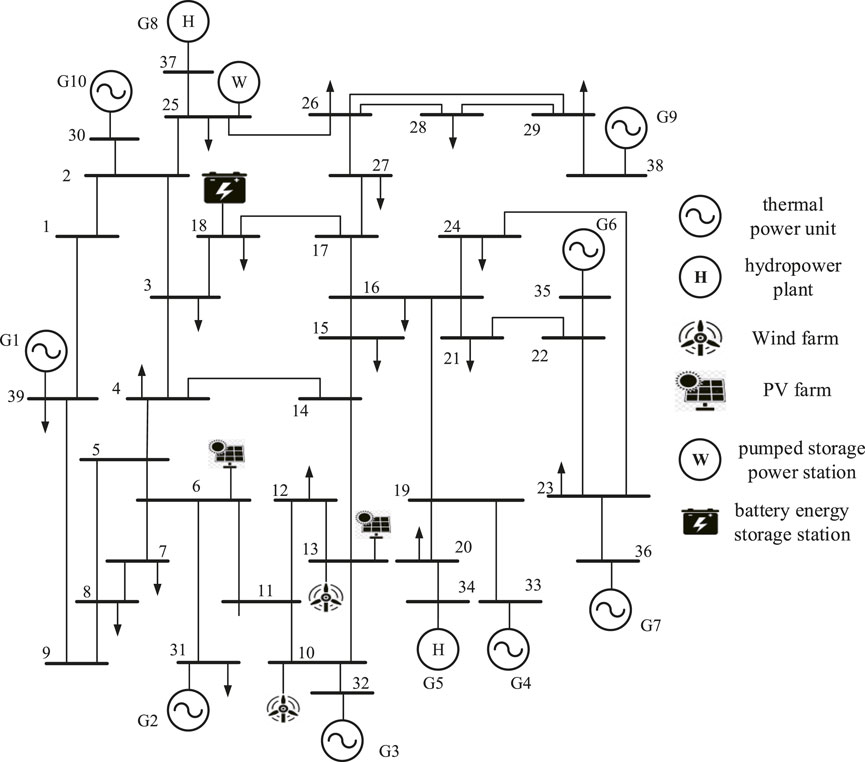
FIGURE 6. The network topology of the modified IEEE 39-bus transmission system.
In the test cases, all TPUs, HPPs and PSP are enabled to provide primary frequency regulation, and all TPUs are able to provide deep peak regulation. The maximum power outputs of TPUs are their rated capacities
The rated frequency of the test system is 50 Hz, and the upper limit of RoCoF is chosen as 1 Hz/s. The maximum allowable frequency deviation of UFLS relay is set as ± 0.8 Hz. The quasi-steady frequency deviation limit is set as ± 0.2 Hz. Other parameters of TPUs are listed in Table 1, and the parameters of HPPs, battery energy storage power station and PSP are listed in Table 2. The typical daily load profile, wind and PV power output profiles are depicted in Figure 7.
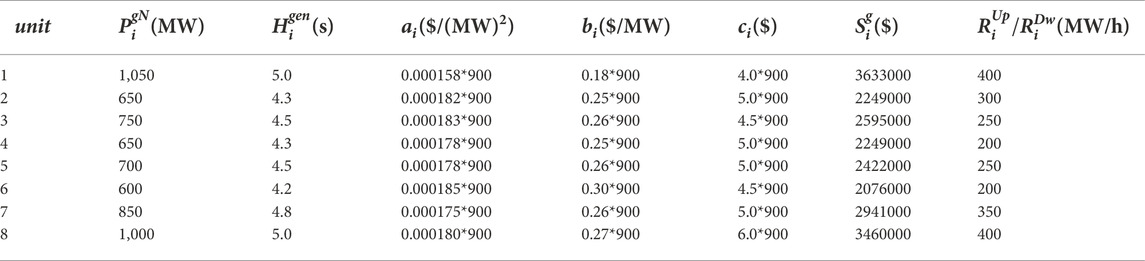
TABLE 1. The parameters of thermal power units.
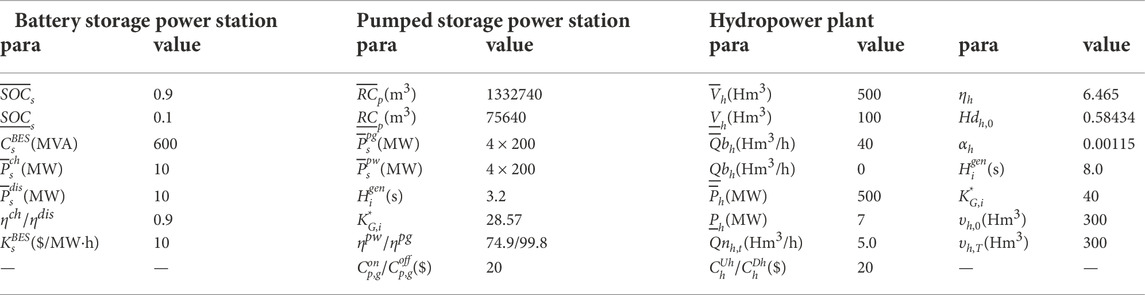
TABLE 2. Parameters of hydropower plants, battery energy storage station and pumped storage power station.
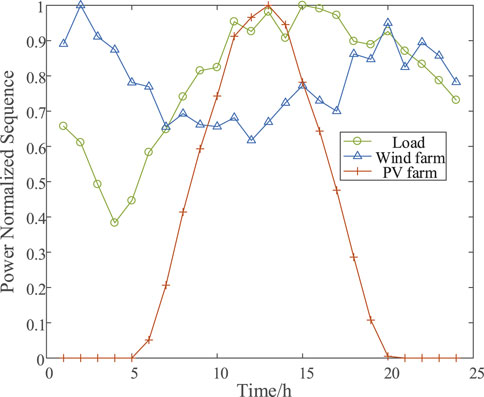
FIGURE 7. The data of load, wind farm and PV farm.
It is known that both the tripping of the conventional generator and the realization of the forecast error of renewable energy can lead to the great power disturbance. Hence, in this paper we chose the disturbance as the larger one between the loss of the largest generation unit and the conservative estimation of the total renewable energy forecast error which is set as ± 30% of the total predicated renewable energy output.
5.1 Effectiveness of the proposed evaluation method
In this subsection, the effectiveness of the proposed REAC evaluation method is verified on the modified IEEE 39-bus test system. Here, the initial installation capacity of renewable energy C0 is equal to 1600 MW and installation capacity increment ΔC is equal to 80 MW. Figure 8 depicts the relationship between the overall operational cost of the system and the total renewable energy installation capacity as well as the relationship between the renewable energy accommodation rates of the system and the total renewable energy installation capacity. Figure 9 demonstrates the accommodated wind/PV energy and generated energy of TPUs under different total renewable energy installation capacities.
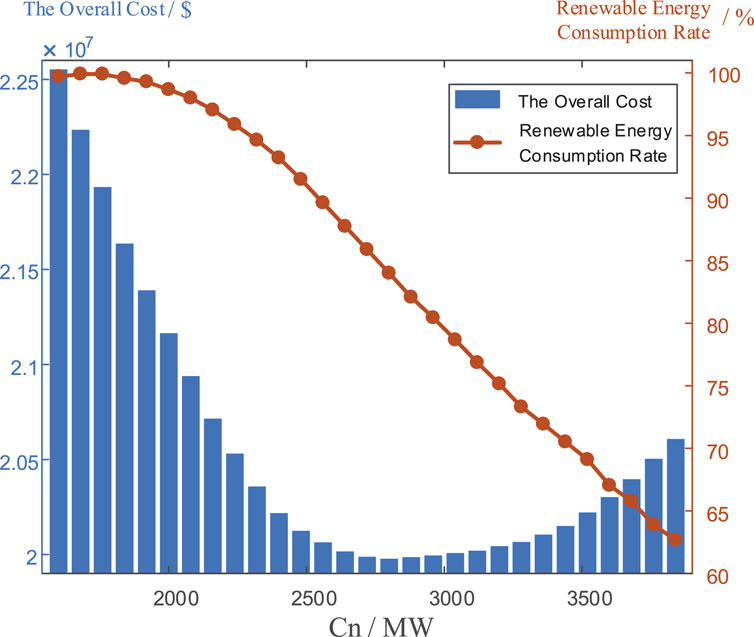
FIGURE 8. The overall operational cost and renewable energy consumption rate with different total renewable energy installation capacities.
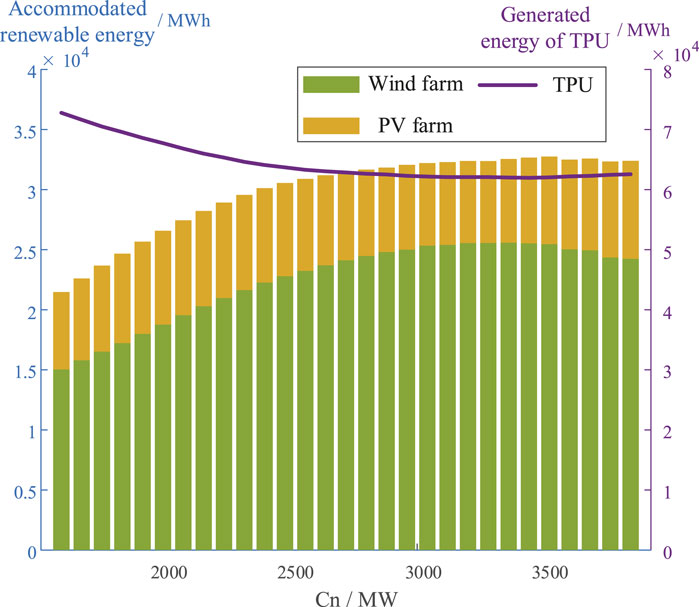
FIGURE 9. The accommodated PV/Wind energy and generated energy of TPU with different total renewable energy installation capacities.
It can be observed from Figure 8, with the growth of total renewable energy installation capacity, the overall operational cost declines first as a portion of TPU power output is replaced by the renewable energy output as demonstrated in Figure 9. The overall operational cost reaches the lowest value given Cn = 2800 MW and then starts to augment with further growth of the total renewable energy installation capacity as the REAC become saturated. The reason is that the system requires sufficient conventional generators to provide frequency response regulation support and thus the further expanding the total renewable energy capacity only results in the increased curtailment rather than the replacement of TPU as show in Figures 8, 9. Therefore, Cn = 2800 MW is considered as the renewable energy accommodation capacity of the test system since at this point the overall operational cost is lowest, which verifies the effectiveness of the proposed method.
5.2 Performance comparison
In this subsection, the superiority of the proposed REAC evaluation method considering both peak and frequency regulation, is validated through the comparison with three benchmark schemes. The first benchmark scheme considers neither peak regulation nor frequency regulation, denoted as S1. The second benchmark scheme only considers peak regulation, denoted as S2, and the last benchmark scheme only considers frequency regulation, denoted as S3. The installation capacity of each wind farm and PV farm is set as 900 MW in all schemes.
Table 3 summarizes the comparison of the operation cost and renewable energy accommodation rate of different schemes. As shown in the table, the overall cost of scheme S3 is largest, which is followed by the proposed scheme and S1, and S2 yields the lowest overall cost. The ranking order of the renewable energy accommodation rate of the four schemes is exactly reversed, which means the higher accommodation rate gives rise to the lower overall cost. Figure 10 shows the renewable energy curtailment profiles using different schemes. It is shown that the curtailment is highest during the period of the renewable energy peak generation. Moreover, S3 has the highest curtailment and S2 yields the lowest curtailment, which is consistent with the results in Table 3. Hence, we can conclude from the above results the considering deep peak regulation is beneficial for the renewable energy accommodation and incorporating the frequency regulation inhibits the renewable energy accommodation. The reason is that when deep peak regulation is considered, the minimum power output of TPUs can be further lowered leading the improvement of the power system flexibility and hence promoting the renewable energy accommodation. When the frequency response requirement is taken into account, the system requires sufficient generators online to maintain the required inertia level and to provide sufficient reserve to handle power disturbance, which squeezes the renewable energy hosting capacity of the power system and thus causing higher wind and PV power curtailment. Therefore, it is necessary to consider both the peak regulation and frequency regulation in order to obtain the accurate outcome of the REAC evaluation since both regulations are the fundamental part of the power system operation and have considerable impact on the renewable energy accommodation.

TABLE 3. The operation cost and renewable energy accommodation rate using different schemes.
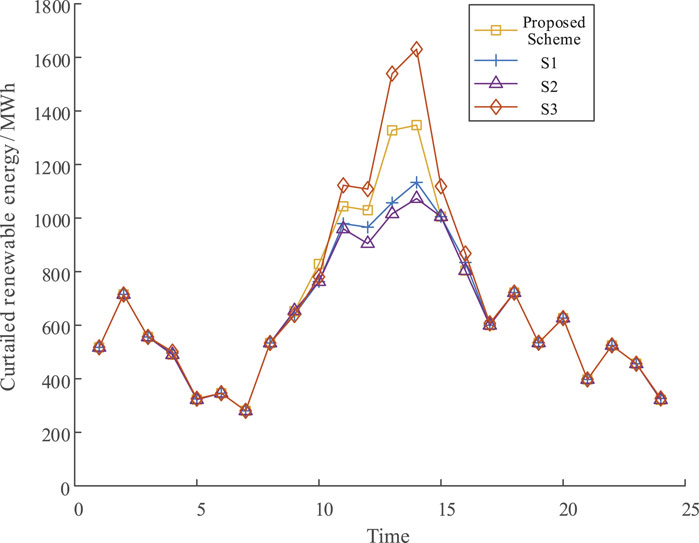
FIGURE 10. The curtailment of renewable energy with different schemes.
6 Conclusion
In this paper, a novel REAC evaluation method is developed for power systems considering peak and frequency regulation as well as the “source-network-storage” interaction. First, the peak and frequency regulation response model is established and simplified to reduce the computational complexity. Then, according to the interaction of “source-network-storage”, a daily power system operational model is constructed. Furthermore, a multi-objective optimization model is proposed considering both economic and technical issues, and an novel evaluation REAC method is developed based on the incremental capacity augmentation technique. Finally, the numerical tests on the modified IEEE 39-bus system verify the effectiveness of the proposed method.
Data availability statement
The data analyzed in this study is subject to the following licenses/restrictions: The dataset involve commercial privacy. Requests to access these datasets should be directed to enljeUBobnUuZWR1LmNu.
Author contributions
YY conceptualized the study, contributed to the study methodology, and wrote the original draft. HZ contributed to the writing-review and editing, data curation and investigation. YZ contributed to study methodology, data analysis, wrote the original draft and writing-review. DY contributed to software and data analysis. BW contributed to investigation and writing-original draft. QX contributed to supervision and writing-review and editing. BL contributed to software and paper revision. All authors have read and agreed to the published version of the manuscript.
Funding
This work was supported by science and technology project of State Grid Hubei Electric Power Company Limited under Grant 521538220006.
Conflict of interest
Authors YY, HZ, FC, DY, BW, and QX were employed by State Grid Hubei Electric Power Co., Ltd.
The remaining authors declare that the research was conducted in the absence of any commercial or financial relationships that could be construed as a potential conflict of interest.
The authors declare that this study received funding from science and technology project of State Grid Hubei Electric Power Company Limited. The funder had the following involvement in the study: data curation, investigation, the study methodology, software and data analysis, writing the original draft and the writing-review & editing.
Publisher’s note
All claims expressed in this article are solely those of the authors and do not necessarily represent those of their affiliated organizations, or those of the publisher, the editors and the reviewers. Any product that may be evaluated in this article, or claim that may be made by its manufacturer, is not guaranteed or endorsed by the publisher.
References
Alves, E. F., Mota, D. d. S., and Tedeschi, E. (2021). Sizing of hybrid energy storage systems for inertial and primary frequency control. Front. Energy Res. 206, 649200. doi:10.3389/fenrg.2021.649200
Babayev, D. A. (1997). Piece-wise linear approximation of functions of two variables. J. Heuristics 2, 313–320. doi:10.1007/bf00132502
Carrión, M., and Arroyo, J. M. (2006). A computationally efficient mixed-integer linear formulation for the thermal unit commitment problem. IEEE Trans. Power Syst. 21, 1371–1378. doi:10.1109/tpwrs.2006.876672
Carrión, M., Dvorkin, Y., and Pandžić, H. (2018). Primary frequency response in capacity expansion with energy storage. IEEE Trans. Power Syst. 33, 1824–1835. doi:10.1109/TPWRS.2017.2735807
Chávez, H., Baldick, R., and Sharma, S. (2014). Governor rate-constrained opf for primary frequency control adequacy. IEEE Trans. Power Syst. 29, 1473–1480. doi:10.1109/tpwrs.2014.2298838
Chen, Z., Wu, L., and Shahidehpour, M. (2014). Effective load carrying capability evaluation of renewable energy via stochastic long-term hourly based scuc. IEEE Trans. Sustain. Energy 6, 188–197. doi:10.1109/tste.2014.2362291
Gao, Y., Zeng, D., Zhang, L., Hu, Y., and Xie, Z. (2020). Research on modeling and deep peak regulation control of a combined heat and power unit. IEEE Access 8, 91546–91557. doi:10.1109/ACCESS.2020.2993279
Guan, H., Feng, Y., Yang, X., Du, Y., Feng, D., and Zhou, Y. (2022). Optimization strategy of combined thermal-storage-photovoltaic economic operation considering deep peak load regulation demand. Energy Rep. 8, 112–120. doi:10.1016/j.egyr.2022.03.050
Guo, Z., Zhang, X., Feng, S., and Zhang, H. (2020). The impacts of reducing renewable energy subsidies on China’s energy transition by using a hybrid dynamic computable general equilibrium model. Front. Energy Res. 8, 25. doi:10.3389/fenrg.2020.00025
He, W., Gao, Q., and Chen, Y. (2018). “Evaluation on renewable energy accommodation ability based on peak load regulation and capacity constraint,” in 2018 International Conference on Power System Technology (POWERCON), Guangzhou, China, November 6–8, 2018, (IEEE), 905–910.
Khalkho, A. M., Rapada, B., Majumder, G., Cherukuri, M., and Mohanta, D. K. (2022). Impact assessment of solar power generation uncertainty on smart grid reliability and carbon neutrality. Front. Energy Res. 10, 220. doi:10.3389/fenrg.2022.851449
Kushwaha, P., Prakash, V., Bhakar, R., Yaragatti, U. R., Jain, A., and Sumanth, Y. (2018). Assessment of energy storage potential for primary frequency response adequacy in future grids,” in 2018 8th IEEE India International Conference on Power Electronics (IICPE), Jaipur, India, December 13–15, 2018, (IEEE), 1–6.
Li, H., Wang, Y., Zhang, X., and Fu, G. (2021). Evaluation method of wind power consumption capacity based on multi-fractal theory. Front. Energy Res. 9, 634551. doi:10.3389/fenrg.2021.634551
Li, W. (2014). Risk assessment of power systems: Models, methods, and applications. Vancouver, Canada: John Wiley & Sons.
Lin, K., Lu, X., Wu, F., and Shi, L. (2020). “Evaluation of the renewable energy accommodation capacity in the regional power grid,” in 2020 12th IEEE PES Asia-Pacific Power and Energy Engineering Conference (APPEEC), Nanjing, China, September 20–23, 2020 (IEEE), 1–4.
Liu, Y., Wu, L., Yang, Y., Chen, Y., Baldick, R., and Bo, R. (2021). Secured reserve scheduling of pumped-storage hydropower plants in iso day-ahead market. IEEE Trans. Power Syst. 36, 5722–5733. doi:10.1109/tpwrs.2021.3077588
Majeed, A., Ahmad, M., Rasheed, M. F., Khan, M. K., Popp, J., and Oláh, J. (2022). The dynamic impact of financial globalization, environmental innovations and energy productivity on renewable energy consumption: Evidence from advanced panel techniques. Front. Environ. Sci. 447, 894857. doi:10.3389/fenvs.2022.894857
Tan, J., and Zhang, Y. (2017). Coordinated control strategy of a battery energy storage system to support a wind power plant providing multi-timescale frequency ancillary services. IEEE Trans. Sustain. Energy 8, 1140–1153. doi:10.1109/tste.2017.2663334
Teng, F., and Strbac, G. (2016). Assessment of the role and value of frequency response support from wind plants. IEEE Trans. Sustain. Energy 7, 586–595. doi:10.1109/tste.2015.2505085
Wang, C., Bie, Z., Yan, C., Li, Z., Liu, F., Ding, K., et al. (2016). Evaluation of power grids’ renewable energy accommodation capacity considering wind power and photovoltaic power. IEEE PES Asia-Pacific Power Energy Eng. Conf., 1518–1522. doi:10.1109/APPEEC.2016.7779744
Wang, C., Liu, S., Bie, Z., and Wang, J. (2018). Renewable energy accommodation capability evaluation of power system with wind power and photovoltaic integration. IFAC-PapersOnLine 51, 55–60. doi:10.1016/j.ifacol.2018.11.677
Wen, Y., Li, W., Huang, G., and Liu, X. (2016). Frequency dynamics constrained unit commitment with battery energy storage. IEEE Trans. Power Syst. 31, 5115–5125. doi:10.1109/tpwrs.2016.2521882
Wu, L., Shahidehpour, M., and Li, Z. (2008). Genco’s risk-constrained hydrothermal scheduling. IEEE Trans. Power Syst. 23, 1847–1858. doi:10.1109/tpwrs.2008.2004748
Xia, P., Deng, C., Chen, Y., and Yao, W. (2019). Milp based robust short-term scheduling for wind–thermal–hydro power system with pumped hydro energy storage. IEEE Access 7, 30261–30275. doi:10.1109/access.2019.2895090
Xie, J., Wang, K., Feng, D., Zeng, D., Li, Y., and Yue, D. (2016). A security-constrained flexible demand scheduling strategy for wind power accommodation. Int. Trans. Electr. Energy Syst. 26, 1171–1183. doi:10.1002/etep.2123
Xu, Q., Kang, C., Zhang, N., Ding, Y., Xia, Q., Sun, R., et al. (2014). A probabilistic method for determining grid-accommodable wind power capacity based on multiscenario system operation simulation. IEEE Trans. Smart Grid 7, 400–409. doi:10.1109/tsg.2014.2381271
You, F., Si, X., Dong, R., Lin, D., Xu, Y., and Xu, Y. (2022). A state-of-charge-based flexible synthetic inertial control strategy of battery energy storage systems. Front. Energy Res. 603, 908361. doi:10.3389/fenrg.2022.908361
Zhang, G., Ela, E., and Wang, Q. (2018). Market scheduling and pricing for primary and secondary frequency reserve. IEEE Trans. Power Syst. 34, 2914–2924. doi:10.1109/tpwrs.2018.2889067
Keywords: renewable energy accommodation capacity, deep peak regulation, frequency dynamics response, “source-network-storage” interaction, multi-objective optimization model
Citation: Yu Y, Zhao H, Zeng Y, Chen F, Yang D, Wang B, Xu Q and Li B (2023) Accommodation capacity evaluation of renewable energy in power systems considering peak and frequency regulation. Front. Energy Res. 10:1067884. doi: 10.3389/fenrg.2022.1067884
Received: 12 October 2022; Accepted: 31 October 2022;
Published: 16 January 2023.
Edited by:
Xue Lyu, University of Wisconsin-Madison, United StatesReviewed by:
Yi He, Hong Kong Polytechnic University, Hong Kong SAR, ChinaMinghao Wang, Hong Kong Polytechnic University, Hong Kong SAR, China
Copyright © 2023 Yu, Zhao, Zeng, Chen, Yang, Wang, Xu and Li. This is an open-access article distributed under the terms of the Creative Commons Attribution License (CC BY). The use, distribution or reproduction in other forums is permitted, provided the original author(s) and the copyright owner(s) are credited and that the original publication in this journal is cited, in accordance with accepted academic practice. No use, distribution or reproduction is permitted which does not comply with these terms.
*Correspondence: Yang Zeng, enljeUBobnUuZWR1LmNu