 Kai Liu
 Xuyu Liu1,2
- 1Cooperative Innovation Center of Unconventional Oil and Gas, Yangtze University (Ministry of Education and Hubei Province), Wuhan, Hubei, China
- 2Key Laboratory of Drilling and Production Engineering for Oil and Gas, Hubei Province, Wuhan, China
- 3School of Electric Power, Civil Engineering and Architecture, Shanxi University, Taiyuan, Shanxi, China
The rotary energy recovery device (RERD) is an essential component in seawater desalination for decreasing the energy consumption of reverse osmosis plants. To research the complex flow fields and mixing motion in ducts of a rotary energy recovery device, a 3D numerical simulation was studied in this work. Three-dimensional vortex structures were visualized and identified based on the Q criterion. The effects of the operating condition and the structure parameter on the flow fields and the mixing motion had been discussed. Simulation results indicated that the interaction between vortices in the mixing zone and vortices in the duct entrance led to a high level of turbulence intensity and mixing degree. The mixing process could be controlled by the operating condition and the structure parameter. This paper provides a new approach to researching structural and operating factors on the mixing process of the rotary energy recovery device.
Introduction
Water resource scarcity is a rapidly growing concern around the world due to the high-speed development of society. Desalination is a major technology that is widely employed worldwide to produce fresh water from saltwater to meet the freshwater demand for human consumption. Reverse Osmosis (RO) membrane technology is the leading water purification technology to filter out salts, microorganisms and minerals from saltwater (Chen et al., 2016; Sousa et al., 2014). Although the RO technology requires considerably less energy to operate than the distillation technology, the energy consumption of it can represent 50–70% of total operating costs (Busch and Mickols, 2004; Elimelech and Phillip, 2011) to overcome the natural osmosis process, making the desalinated water too costly for the average consumer. Therefore, the energy recovery device (ERD), the core equipment of the RO system, is proposed to reduce electricity consumption. The rotary-type ERDs (RERDs) and the piston-type ERDs are the two main types of isobaric ERDs, which working principles were based on positive displacement (Andrews and Laker, 2001). The seawater with low pressure and the brine with high pressure would come into direct contact in the duct of an isobaric ERD, and then the isobaric ERD recovers the hydraulic energy from the brine directly into the feed seawater. Due to the highest recovery efficiency, isobaric ERDs have replaced centrifugal-type ERDs such as Francis Turbine in most RO plants nowadays (Wang et al., 2022). Figure 1 shows the schematic representation of RERDs. The RERD works by using a rotor with a series of ducts. With the rotor rotates, the high pressure brine stream travels through the duct and transfers its pressure energy to the low pressure seawater stream. In the meantime, the seawater stream with high pressure will be pushed out. The energy transfer process will be repeated as the rotor continues to rotate, and the RERD performed the energy recovery process with high efficiency. It should be pointed out that there is no physical piston in the ducts of RERDs, leading the two streams would contact directly in ducts, as shown in Figure 1. Therefore, compared with that of piston-type ERDs, RERDs could complete the energy recovery process at a low level of vibration and noise (Stover, 2007). But, the absence of the physical piston would cause the salinity from the brine to transfer back to the seawater in the energy recovery process, finally degrading the ERD performance (Bross and Kochanowski, 2007).
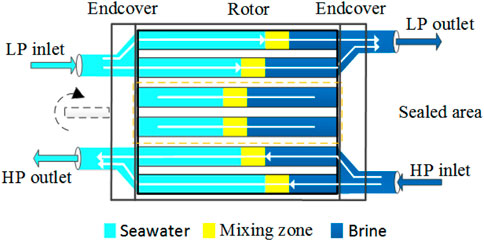
FIGURE 1. Schematic representation of RERD.
To reduce the mixing degree of the RERD, the “over-flush” operation is suggested (Schneider, 2005; Stover et al., 2009). Under this operation, the flow rate of the low-pressure seawater stream is controlled to be larger than that of the high-pressure brine stream. Hence, the mixing zone, the flow zone with high-salinity fluids around the interface of the two streams, would be pushed out of the duct. But, the seawater stream needs a pretreatment, the chemical cleaning process, which will increase the operational costs. So that, the “over-flush” operation is not the best method to reduce the mixing degree of the RERD (Goto et al., 2017).
Adjusting these parameters, such as the duct length, the rotation speed and the inlet flow rate, is a good way to control the mixing degree of the RERD at a lower level. The effects of these parameters on the flow fields and mixing motion have been the focus of a great deal of research in recent years. Zhou, Ding, Ju and Chang (Zhou et al., 2009) performed computational work to research the mixing formation and motion in RERDs. Their results showed that the pressure difference had an unobvious effect mixing degree of a RERD, but the duct length, the rotation speed and the inlet flow rate had a significant effect on it. Xu, Wang, Wu, Xu, Wang and Wang (Xu et al., 2014) defined a parameter of inflow length to characterize the mixing degree of a RERD. Their simulation results showed that the inflow length was proportional to the inlet flow rate, but it was inversely proportional to the rotation speed. Liu, Zhou and Bi (Liu et al., 2012) conducted numerical simulations to research the liquid piston (mixing zone), which can successfully prevent these two streams from overmixing. They also found that the formation and movement of the liquid piston can be controlled by the inlet flow rate and the rotation speed. Wu, Jin, Wang and Tandon (Wu et al., 2017) examined the effect of the inlet flow rate on the RERD efficiency with theoretical analysis and experiments. They found that there was an optimal value of the inflow rate for the RERD achieving maximum efficiency under given operating conditions in an established RO system.
However, few studies have been done on the mixing transfer process in ducts of RERDs. In our previous study, we performed visualization experiments (Liu et al., 2018) and simulations to research the flow distributions in ducts. The experimental results presented that a high turbulence intensity caused by the vortex formation and generation would be observed in ducts. From the numerical results, the vortex formation and generation would also influence the mixing transfer process (Liu et al., 2019). The swirling flow and the vortex were observed in the mixing zone, causing a high turbulence intensity in the ducts. An extensive investigation is required to determine how the mixing process and flow pattern are impacted by the operating state and the structure parameter. In this study, flow characteristics and the mixing motion in RERDs were investigated by numerical methods. These findings are expected to provide a valuable guideline for the design and operation of an efficient RERD.
Numerical methods
Figure 2 presents the geometry model for CFD simulation. The RERD consisted of two endcovers and twelve ducts. In the working process, the two endcovers were stationary, but one is for the brine stream, and the other is for the seawater stream. The ducts were rotary for energy transfer and recovery process, and the inner diameter of the duct was 30 mm × 30 mm in width. The reference parameters of the duct length, the inflow rate and the rotational speed were L0 = 265 mm, Q0 = 3.6 m3 h−1 and n0 = 120 r∙min−1, respectively. Those parameters were identical to our experimental apparatus (Liu et al., 2018).
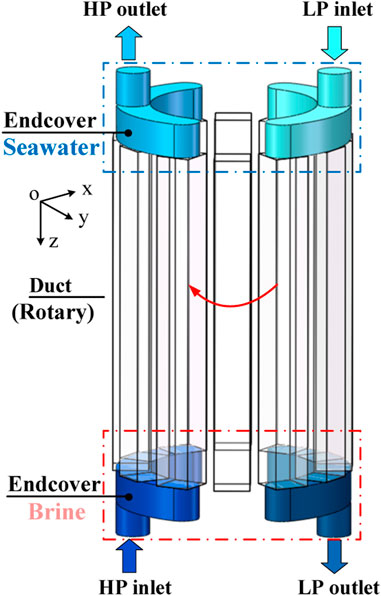
FIGURE 2. Geometric model.
The species transport equation is given to calculate the mixing process in turbulent flows:
where
where
Numerical grids were generated using the ICEM CFD v16.0. A Uniform structured hexahedral mesh was employed to reduce the grid number and improve the computation accuracy and convergence. The grid independence test had been performed and a total cell count of 4.1×10⁶ was chosen for this simulation (Liu and Zheng, 2020).
The commercial software Ansys Fluent 16.0 was chosen in this work for the unsteady and incompressible calculation. Meanwhile, the heat transfer was ignored because of the slight discrepancy in temperature between the two streams. In order to capture the strong unsteadiness to reveal the mechanism of the mixing motion and flow fields in ducts during the working process of RERDs, the Realizable k-ε (RKE) turbulence was used in this study, which had been confirmed by PIV experiments that it could give a more accurate result compared with standard k-ε and RNG k-ε turbulence models (Liu et al., 2019). The pressure-based solver and the second-order upwind scheme were selected for the calculation method. The simulation time step was 1 × 10⁻³ s and the convergence criteria was 1 × 10–4.1×105 total number of time steps was chosen in this simulation, corresponding to 20 revolutions of ducts.
Boundary conditions of the models are important for numerical computation. The velocity inlet boundary condition was employed for the endcover inlet and the pressure-out boundary condition was employed for the endcover outlet. The HP outlet boundary pressure was set at 6.0 MPa and the LP outlet boundary pressure was set at 0.2 MPa. Other walls of ducts and endcovers were set as non-zero velocity boundary conditions. The 3.5 wt% NaCl and 1.8 wt% NaCl was used to simulate the brine stream and the seawater stream in calculations. The sliding mesh method of Fluent was used to simulate the duct rotation. The duct was set as the rotational part with a given rotational speed and direction. The contact surfaces between the rotational duct and the stationary endcover were set as an interface condition for calculation data transmission.
Results and discussion
Results of structure parameters effect
The most important structural factor affecting RERD performance was the duct length (Zhou et al., 2009; Xu et al., 2014). To research the influence of duct length, L, on the fluid mixing process and the evolution process of the vortex, four cases of duct length were designed in this study, which were 0.9L0, 1.0L0, 1.1L0 and 1.2L0 as listed in Table 1.
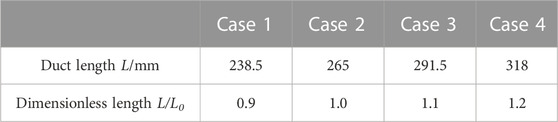
TABLE 1. The lengths of ducts in the simulations.
The volumetric mixing rate Mx was introduced in this study to characterize the mixing degree between the brine and seawater, which was computed by Mx = (CHP-out–CLP-in)/(CHP-in–CLP-in), where CHP-out, CLP-in, and CHP-in were the salinity concentration in the HP outlet, LP inlet, and the HP inlet, respectively. The effect of the dimensionless duct length L/L0 on the volumetric mixing rate Mx is shown in Figure 3. It can be seen that the volume mixing degree of the RERD shows a monotonic decreasing trend with the increase of the duct length. It should be pointed out that, the volume mixing degree decreased obviously as the duct length increased from 0.9L0–1.1L0. With the duct length further increased to 1.2L0, the volume mixing degree was still decreased, but the decreasing trend became slower. In order to make a profound study of the duct length effect on the mixing process, it was necessary to conduct a detailed study of the flow field in the duct.
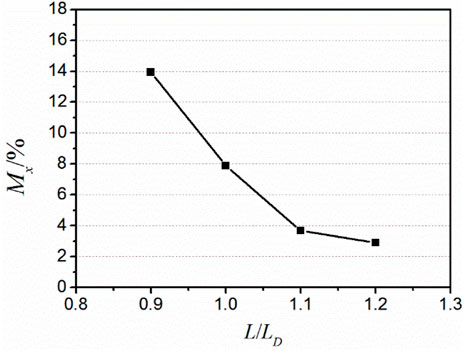
FIGURE 3. Variation of volumetric mixing rate with dimensionless duct length.
In order to research the mixing motion and flow fields in ducts at different work stages in one working cycle, 12 phases of one duct at twelve specific positions were chosen as shown in Figure 4. As the pipes rotate, each duct would experience the seawater supercharging stage (phases 2# to 6#), the sealed stage (phases 1# and 7#) and the brine discharging stage (phase 8# to 12#). To reveal complex flow structures in the duct, the Q criterion (Alfonsi and Primavera, 2008; Zhang et al., 2018) was introduced to describe the flow field and identified the vortex structures.

FIGURE 4. Twelve specific duct positions in an energy recovery process.
Figure 5 shows the vortex structure distribution in flow fields revealed by the Q criterion (Q = 0.03) at four specific duct positions. To research the mixing motion, vortex structures were colored by salinity magnitude. In all cases, the entire vortex evolution process could be observed in ducts as shown in Figure 5. At the duct entrance (left), the vortex formation, expansion and detachment could be found in phase 3#, phase 5# and phase 7#, respectively. Meanwhile, the vortex diminishment could be found at the duct exit (right). According to the findings of our earlier research, the relative rotation of the endcover and the duct lead to vortex generation (Liu et al., 2018). Meanwhile, all cases had similar vortex structures in the duct. But in the case of L = 0.9L0, the vortex in the left side duct contacted with the vortex in the right side duct in phase 3# and phase 7#, which would lead to a significant increase in the turbulence intensity of the fluid in this region, where was the interface between the seawater and brine streams, finally increasing the mixing degree. As the duct length increases, this contact between those vortices weakened gradually. From the aforementioned findings, increasing the duct length had little effect on the vortex structure, but it could weaken the interaction between vortices and effectively reduce the mixing effect. To better discuss the mixing degree in the duct, the mean salinity distribution was provided in.
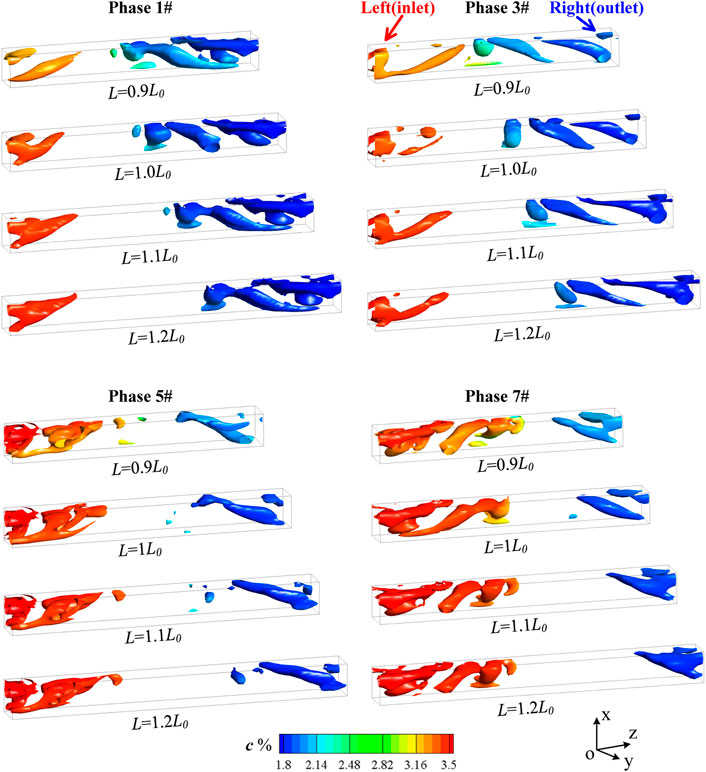
FIGURE 5. Q criterion iso-surface (Q = 0.03) colored by salinity magnitude at different values of duct length.
Figure 6 In the cases of 0.9L0, an obvious salinity increase in the mixing zone and the seawater zone could be found in this figure, showing the salinity transferred from the brine stream caused by the vortex evolution and the high-level turbulence intensity. From the above results, increasing the duct length was an effective method to reduce the mixing degree and improve the RERD performance.
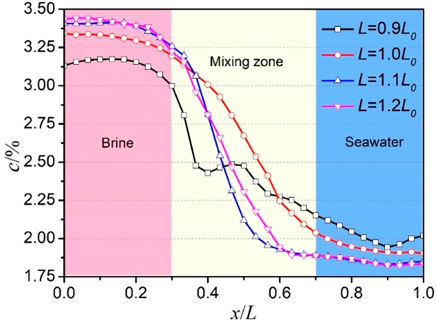
FIGURE 6. Mean salinity distribution at different values of duct length.
Results of operating factors effect
The inflow rate and the rotation speed were two important operating factors affecting RERD performance (Yin et al., 2018; Xu et al., 2020; Lou et al., 2022). To research the influence of the inflow rate, Qin, on the fluid mixing process and the evolution process of the vortex, five cases of inflow rate were designed in this study listed in Table 2. Parameter of the duct length and the rotational speed was fixed at L0 = 265 mm and n0 = 120 r min−1 in those cases.

TABLE 2. Five cases of the inflow rate in the simulations.
Figure 7 presents the effect of the inflow rate Qin on the volumetric mixing rate Mx. As shown in Figure 7, the volumetric mixing rate decreased as the inflow rate increased initially and increased afterward. This result showed that the inflow rate value of 3.6 m3 h−1 was the critical value of RERD performance in this simulation. However, in other works (Liu et al., 2012; Xu et al., 2014), researchers found that the volumetric mixing rate had just increased with the inflow rate. Thus, the flow structures and mixing process in ducts should be researched to explain the discrepancy.
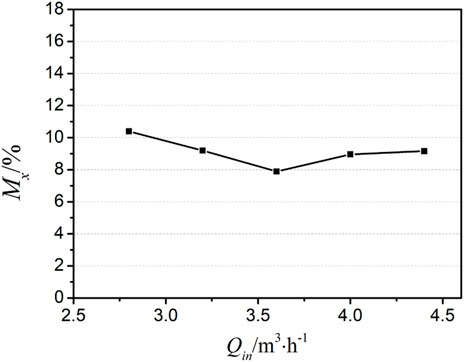
FIGURE 7. Variation of volumetric mixing rate with inflow rate.
Figure 8 shows the vortex structure distribution in flow fields revealed by the Q criterion and colored by salinity magnitude at four specific duct positions. In phase 1# (sealed stage), with the increase of inflow rate, the vortex structure at the left side duct diminished gradually, and the location of the vortex in the mixing zone was pushed forward by the inflow stream in the brine supercharging stage. In phase 3# (seawater supercharging stage), the vortex structure at the left side duct was pushed forward by the inflow stream, getting close to the vortex in the mixing zone, finally causing high turbulence intensity and mass transfer in this region. In phase 5#, all cases had similar vortex structures at the left side duct showing the inflow rate had little effect on the vortex formation in this region. In phase 7#, the vortex in the mixing zone formed and its location was pushed forward by the inflow stream, having a similar flow structure to that in phase 1#. Mean salinity distribution in ducts at different inflow rates can be found in Figure 9, showing a slight increase in duct entrance and exit with the inflow rate increasing. From the above results, it can be inferred that the inflow rate had little effect on the vortex formation in the duct entrance (the left side duct in the seawater supercharging stage) and in the mixing zone, but had a significant impact on the vortex location in the mixing zone and the vortex diminishment in the duct exit (the right side duct in seawater supercharging stage). Damping the interaction between the vortex in the duct entrance and the vortex in the mixing zone may be an effective method to reduce the mixing degree in ducts.
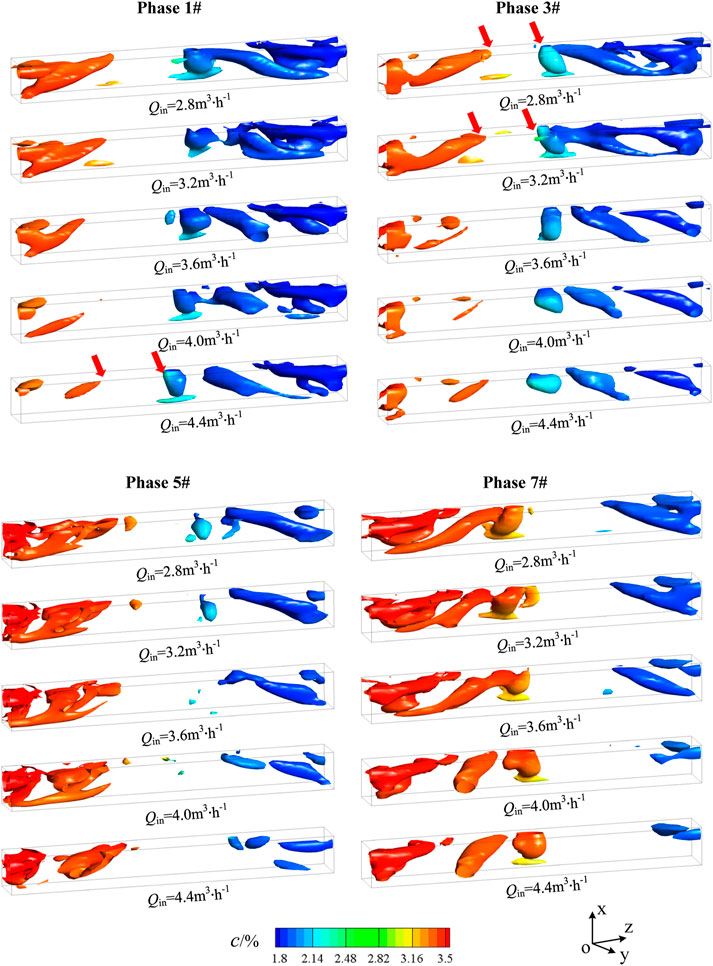
FIGURE 8. Q criterion iso-surface (Q = 0.03) colored by salinity magnitude at different values of inflow rate.
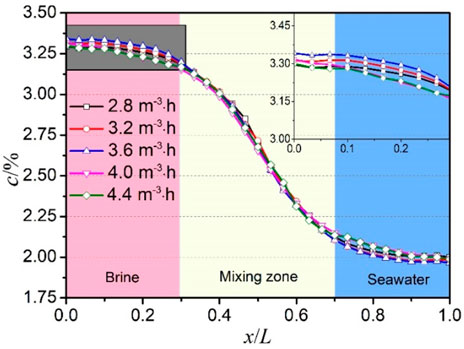
FIGURE 9. Mean salinity distribution at different values of inflow rate.
To research the influence of the rotation speed, nr, on the fluid mixing process and the evolution process of the vortex, five cases of rotation speed were designed in this study listed in Table 3.

TABLE 3. Five cases of the rotation speed in the simulations.
Figure 10 the relationship between the volumetric mixing rate Mx and the rotation speed nr. As depicted in Figure 10, the mixing degree increased with the rotational speed of the ducts. When the rotational speed increased from 60 r min−1 to 120 r min−1, the volumetric mixing rate had just increased by 0.17%. However, the mixing degree substantially increased when the rotational speed increased from 120 r∙min−1 to 180 r∙min−1. But in the cases of 180, 240 and 300 r min−1, the growth trend of the volumetric mixing rate was gradually slowing down with the rotational speed increase.
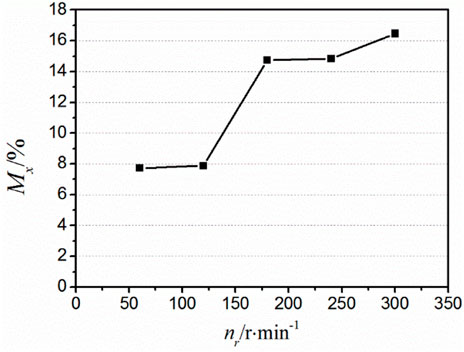
FIGURE 10. The relationship between the volumetric mixing rate and the rotation speed.
Figure 11 shows the vortex structure distribution in flow fields revealed by the Q criterion and colored by salinity magnitude at four specific duct positions. In the case of nr = 60 r ∙min−1, a small-scale vortex structure with low turbulence intensity can be found in all phases. With the increase of rotation speed, vortices enlarged causing high turbulence intensity and mass transfer in ducts. Compared to the flow fields in Figure 8, the rotation speed as an operating factor could also affect the vortex formation in the duct entrance. In phases 1# and 3#, the vortex structure at the left side duct enlarged gradually with the increase of rotation speed. However, in phases 5# and 7#, flow fields in cases of 180, 240 and 300 r min−1 showed similar flow structures, which were large-scale vortex structures both in the duct entrance and mixing zone. In those cases, vortices in the mixing zone interacted with that in the duct entrance and exit, finally causing a high mixing degree in Figure 10. Figure 12 shows mean salinity distribution in ducts at a different rotation speed. With the increase in rotation speed, an obvious salinity increase in the seawater zone could be found in this figure. From the above results, lowering the rotational speed was an effective method to reduce the mixing degree and improve the RERD performance.
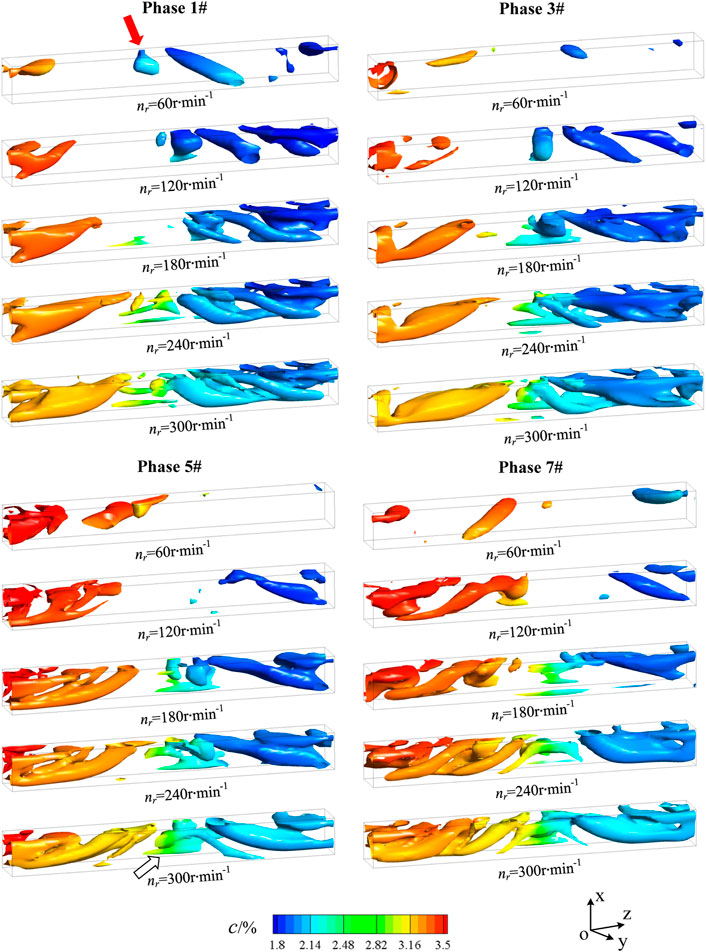
FIGURE 11. Q criterion iso-surface (Q = 0.03) colored by salinity magnitude at different values of rotation speed.
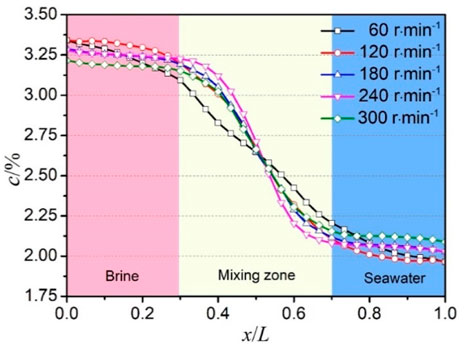
FIGURE 12. Mean salinity distribution at different values of rotation speeds.
Conclusion
In this study, the rotation speed, the inflow rate and the duct length were chosen to research how operating conditions and structure parameters affect the mixing motion and flow fields in ducts of RERDs by simulations. Simulation results presented that the rotation speed and the inflow rate as core operating conditions had a significant effect on the flow pattern and mixing motion in ducts. As the rotor speed increases, the mixing degree increased obviously. The mixing degree was not proportional to the inflow rate. There was an optimal parameter of inflow rate to achieve the lowest mixing degree when all other parameters stayed unchanged. The duct length as structure parameters was inversely proportional to the mixing degree. Decreasing the rotation speed or increasing the duct length was an effective method to reduce the mixing degree and improve the RERD performance. These findings may provide a valuable guideline for the operation of an efficient RERD.
Data availability statement
The original contributions presented in the study are included in the article/supplementary material, further inquiries can be directed to the corresponding author.
Author contributions
KL, conceptualization, methodology, investigation, formal analysis, writing—original Draft; XL, data curation, writing—original draft; XZ, visualization, investigation; BS, software, validation LW, visualization, writing—review and editing LZ, resources, supervision; funding acquisition.
Funding
This work has been supported by the National Natural Science Foundation of China (Grant No. 51974033, Grant No. 51806132) and the Open Foundation of Cooperative Innovation Center of Unconventional Oil and Gas, Yangtze University (Ministry of Education and Hubei Province), No. UOG 2022–04.
Conflict of interest
The authors declare that the research was conducted in the absence of any commercial or financial relationships that could be construed as a potential conflict of interest.
Publisher’s note
All claims expressed in this article are solely those of the authors and do not necessarily represent those of their affiliated organizations, or those of the publisher, the editors and the reviewers. Any product that may be evaluated in this article, or claim that may be made by its manufacturer, is not guaranteed or endorsed by the publisher.
Abbreviations
RO, Reverse Osmosis; ERD, Energy recovery device; RERDs, Rotary-type ERDs; V-RERD, Visualization apparatus of RERD; HP, High-pressure; LP, Low-pressure; C, Salinity concentration, %; L, Duct length, mm; nr, Rotational speed, r∙min−1; Mx, Volumetric mixing rate, %; Q, Q criterion; Qin, Inflow rate, m3∙h−1; ω, Mean vorticity, 1/s.
References
Alfonsi, G., and Primavera, L. (2008). On identification of vortical structures in turbulent shear flow. J. Flow Vis. Image Process. 15 (3), 201–216. doi:10.1615/jflowvisimageproc.v15.i3.20
Andrews, W. T., and Laker, D. S. (2001). A twelve-year history of large scale application of work-exchanger energy recovery technology. Desalination 138 (1), 201–206. doi:10.1016/s0011-9164(01)00265-x
Bross, S., and Kochanowski, W. (2007). SWRO core hydraulic system: Extension of the SalTec DT to higher flows and lower energy consumption. Desalination 203 (1-3), 160–167. doi:10.1016/j.desal.2006.03.527
Busch, M., and Mickols, W. E. (2004). Reducing energy consumption in seawater desalination. Desalination 165, 299–312. doi:10.1016/j.desal.2004.06.035
Chen, X., Zhang, Z., Liu, L., Cheng, R., Shi, L., and Zheng, X. (2016). RO applications in China: History, current status, and driving forces. Desalination 397, 185–193. doi:10.1016/j.desal.2016.07.001
Elimelech, M., and Phillip, W. A. (2011). The future of seawater desalination: Energy, technology, and the environment. Science 333 (6043), 712–717. doi:10.1126/science.1200488
Goto, A., Shinoda, M., and Takemura, T. (2017). “Mixing control in an isobaric energy recovery device of seawater reverse osmosis desalination system,” in ASME 2017 Fluids Engineering Division Summer Meeting, 12 July 2017 (New York, United States: American Society of Mechanical Engineers (ASME)), V01BT08A003.
Liu, K., Deng, J. Q., and Ye, F. H. (2018). Visualization of flow structures in a rotary type energy recovery device by PIV experiments. Desalination 433, 33–40. doi:10.1016/j.desal.2018.01.022
Liu, K., Deng, J., and Ye, F. (2019). Numerical simulation of flow structures in a rotary type energy recovery device. Desalination 449, 101–110. doi:10.1016/j.desal.2018.10.016
Liu, K., and Zheng, L. (2020). Simulation investigation on the flow and mixing in ducts of the rotary energy recovery device. Geofluids 2020, 1–12. doi:10.1155/2020/8822493
Liu, Y., Zhou, Y.-H., and Bi, M.-S. (2012). 3D numerical simulation on mixing process in ducts of rotary pressure exchanger. Desalin Water Treat. 42 (1-3), 269–273. doi:10.5004/dwt.2012.3009
Lou, F., Nie, S., Yin, F., Lu, W., Ji, H., Ma, Z., et al. (2022). Numerical and experimental research on the integrated energy recovery and pressure boost device for seawater reverse osmosis desalination system. Desalination 523, 115408. doi:10.1016/j.desal.2021.115408
Schneider, B. (2005). Selection, operation and control of a work exchanger energy recovery system based on the Singapore project. Desalination 184 (1), 197–210. doi:10.1016/j.desal.2005.04.031
Sousa, P., Soares, A., Monteiro, E., and Rouboa, A. (2014). A CFD study of the hydrodynamics in a desalination membrane filled with spacers. Desalination 349, 22–30. doi:10.1016/j.desal.2014.06.019
Stover, R., Fernandez, A. O., and Galtes, J. (2009). “Permeate recovery rate optimization at the alicante Spain SWRO plant,” in Proceedings of the International Desalination Association World Congress, 21 December 2009 (Dubai: UAE).
Stover, R. L. (2007). Seawater reverse osmosis with isobaric energy recovery devices. Desalination 203 (1-3), 168–175. doi:10.1016/j.desal.2006.03.528
Wang, C., Meng, P., Wang, S., Song, D., Xiao, Y., Zhang, Y., et al. (2022). Comparison of two types of energy recovery devices: Pressure exchanger and turbine in an island desalination project case. Desalination 533, 115752. doi:10.1016/j.desal.2022.115752
Wu, J., Jin, Q., Wang, Y., and Tandon, P. (2017). Theoretical analysis and auxiliary experiment of the optimization of energy recovery efficiency of a rotary energy recovery device. Desalination 415, 1–7. doi:10.1016/j.desal.2017.03.038
Xu, E. L., Jianga, X., Miaoa, Z., and Wangc, F. (2020). Comparing brine-seawater mixing between two-port and four-port rotary energy recovery device. Desalin. Water Treat. 173, 207–212. doi:10.5004/dwt.2020.24823
Xu, E. L., Wang, Y., Wu, L. M., Xu, S. C., Wang, Y. X., and Wang, S. C. (2014). Computational fluid dynamics simulation of brine-seawater mixing in a rotary energy recovery device. Ind. Eng. Chem. Res. 53 (47), 18304–18310. doi:10.1021/ie503270w
Yin, F. L., Nie, S. L., Ji, H., and Lou, F. L. (2018). Numerical study of structure parameters on energy transfer and flow characteristics of integrated energy recovery and pressure boost device. Desalin. Water Treat. 131, 141–154. doi:10.5004/dwt.2018.23018
Zhang, Y., Liu, K., Xian, H., and Du, X. (2018). A review of methods for vortex identification in hydroturbines. Renew. Sustain. Energy Rev. 81, 1269–1285. doi:10.1016/j.rser.2017.05.058
Keywords: ro, ERD, computational fluid dynamic, mixing, vortex
Citation: Liu K, Liu X, Zhang X, Shi B, Wu L and Zheng L (2023) Influence of structural and operating factors on mixing transfer of rotary energy recovery device through CFD simulation. Front. Energy Res. 10:1111138. doi: 10.3389/fenrg.2022.1111138
Received: 29 November 2022; Accepted: 27 December 2022;
Published: 10 January 2023.
Edited by:
Jun Wang, University of Wisconsin-Madison, United StatesReviewed by:
Fangyang Yuan, Jiangnan University, ChinaYandong Hou, Northeast Electric Power University, China
Copyright © 2023 Liu, Liu, Zhang, Shi, Wu and Zheng. This is an open-access article distributed under the terms of the Creative Commons Attribution License (CC BY). The use, distribution or reproduction in other forums is permitted, provided the original author(s) and the copyright owner(s) are credited and that the original publication in this journal is cited, in accordance with accepted academic practice. No use, distribution or reproduction is permitted which does not comply with these terms.
*Correspondence: Lixing Zheng, bHh6aGVuZ0BzeHUuZWR1LmNu