 Binyuan Zhang
 Jinge Yao
 Hyuck-Jin Lee*
- Department of Economics, Sejong University, Seoul, South Korea
The mining industry (MI) has played a key role in ensuring a stable supply of minerals for industrial production and human survival. The Chinese government is implementing various policies to promote the MI and needs quantitative information on the economic role and effects of the MI. Thus, this article uses comprehensive and multi-period input-output (IO) analysis to investigate the roles of four mining sectors, including the entire mining sector in the Chinese national economy, from the period 2007–2017. To this end, three models are employed. First, the production-inducing effects, value-added creation effects, and wage-inducing effects of 1 dollar of production in the MI sector are analyzed using a demand-driven model. One dollar of production or investment in the sector causes 0.862–1.171 dollars of production, 0.271–0.333 dollar of value-added, and 0.106–0.125 dollar of wage, respectively. Second, by applying a supply-driven model, it is found that one dollar of supply shortage in the MI causes 4.383–5.949 dollars of production failure throughout the national economy. Third, by utilizing a price-side model, it is discovered that a 10% increase in the price of output of the MI raises the overall price level by 0.108%–0.171%. The results of this article were critical to enlighten policy-makers to forward ever-improvement on the MI and combine the MI within national economic system reform and planning, by offering a clear vision of how MI will affect the various sectors and the economic system as a whole.
1 Introduction
The mining industry (MI) plays an essential role in accelerating industrialization and urbanization, as it provides raw materials to meet the growing demand for resources. In addition, it contributes to increased foreign capital investment, exports, and employment, key factors in socio-economic development (Chen et al., 2020; Jiskani et al., 2020). In other words, the MI’s primary purpose is to offer energy resources, metallic materials, and non-metallic minerals for the development of other industries, and extensive and multi-level direct and indirect links with other industries in the economy (Lei et al., 2013; Kim et al., 2020).
China has discovered 173 minerals and has proven reserves in 163 minerals, ranking third globally after the United States and Russia. These resources include 13 energy, 59 metal, 95 non-metal, and 6 water and gas minerals, with some resources’ reserves being relatively abundant (The Report of China Mineral Resources, 2020). Furthermore, from 2003 to 2014, the annual growth rate of mining investment in China consistently exceeded 10% (Fan et al., 2017), and with the implementation of the “Made in China 2025” strategy, the enormous potential and growth space of China’s economy transitioning to a high-quality development stage will continue to boost demand for mineral resources (Feng et al., 2019; The Stats Council of the People’s Republic of China, 2020), with China expected to become the world’s largest coal market by 2035 (Wang et al., 2019). However, the traditional extensive development model is unsustainable, and pressures on resource security, economic security and ecological security are growing. Therefore, the development of the mining industry must accelerate structural optimization and adjustment, improve the efficiency of development and utilization, promote the transformation and upgrading of the mining industry and green development, realize the modernization of governance capabilities, so as to comprehensively promote the high-quality development of the mining industry (Al Asbahi et al., 2019; Yang et al., 2021). In addition, green and efficient mining of advantageous minerals through new digitalization and new technologies, such as tantalum, niobium, lithium, rare earth, scandium, germanium, gallium, indium, rhenium, tellurium, and arsenic has become a global concern as these minerals are in short supply in the United States, Europe and other Western countries. Thus, China’s MI is a major stimulant for both the local and global economies.
The input-output (IO) analysis suggested by Leontief (1936) is thought to be an effective top-down approach to underpin embodiment accounting. The inverse matrix is used to solve the inter-industry transaction table’s mathematical relationship in IO analysis based on the general framework of the IO table. Additionally, the IO model is significant in various areas, notably energy issues, regional economies, environmental issues, and employment (Beylot and Villeneuve, 2015; Ju et al., 2016; Means et al., 1939; Wang and Wang, 2019). Furthermore, IO analysis has broad applicability to mining and mining-related businesses in regional and national economies. For example, between 1971 and 1993, Stilwell et al. (2000) used the IO table to analyze the impact of gold, coal, and other mining activities on the South African economy. Based on this model, San Cristóbal and Biezma (2006) employed IO analysis to identify three significant subsectors: the German coal mining industry, the Swedish iron ore mining business, and the Austrian mining and quarrying industry. In empirical studies, Ivanova (2014) used input-output modeling to analyze the economic diversity of Australia’s Queensland region to identify key sectoral, backward, and forward linkages. In addition, Kim et al. (2020) used IO tables published by the Bank of Korea in 2015 to conduct an input-output analysis identifying Korean mining industry characteristics, such as production-induced effects and supply shortage impacts.
Many scholars have proven the link between energy resources and economic development, such as the fact that recycling and using natural resources increases economic growth potential (Upadhyay et al., 2021), and the mining industry adds to the economy’s demand for materials for productive activities (Suh, 2021). Also, in the process of economic transformation, sustainable economic growth can be stimulated through the transformation of natural resources (Sun et al., 2020). Agyekum et al. (2021) examined the environment in the renewable energy sector through a mix of PESTLE-AHP methodologies and found economic factors as key challenges. Several scholars have focused on the MI of China. For instance, Lei et al. (2013) conducted a quantitative analysis of sub-sectors in China’s MI using data from the China Statistical Yearbook 2004–2010 and China’s 2007 IO tables to identify input-output, industry linkage, and income distribution effects. Further research evaluated the contribution of mining-related industries. Xu (2011) used an IO model to analyze the Chinese petroleum industry’s direct and indirect economic impact coefficients and inducing effects. Wu and Zhang (2016) examined the rising demand in China’s coal sector from 1997 to 2012 using an IO structural decomposition analysis (IO SDA) model, concluding that industrial upgrading could successfully restrict coal demand growth with a contribution of 108.6%. Song et al. (2019) used the same model to analyze the drivers of metal consumption in China at the national, industry, and sub-industry levels. Furthermore, Wang and Ge (2020) used a multi-regional IO model to calculate external demand for coal consumption in mainland China, deconstructed critical elements using structural decomposition analysis, and then calculated the impact of external demand on direct and indirect coal consumption in mainland China.
Most previous studies of China’s MI focused on a single mining sub-sector, such as coal, metal ores, or petroleum. In addition, few studies conducted a comprehensive assessment of the economic impact of China’s entire mining sector. Therefore, this study analyzed the economic and social effects of the Chinese MI through an IO analysis, using China’s recent official data from 2007, 2012, and 2017 IO tables (National Bureau of Statistics of China, 2012; National Bureau of Statistics of China, 2017; National Bureau of Statistics of China, 2019). An additional four MI sub-sectors were recovered, and their outputs were extracted to create a set of MI sector models. The results were estimated as the production-inducing, wage-inducing, and value-added creation effects of MI investment (demand-driven model), the effect of MI loss in supply shortage (supply-driven model), the effects of a 10% increase in the price of MI products (price-side model), and the inter-industry linkage effect. The major goal of these studies was to show how the MI interacts with the primary, secondary, and tertiary industries, as well as other sectors within the mining industry. In this way, the industrial association and industrial spread effect of the mining industry are revealed, and the contribution of the mining industry to China’s national economy is quantified. In addition, another purpose of studying the mining industry is to provide data support for decision-makers who are developing mining development policies. The findings of this paper can be used to better understand the status and role of the mining industry and its internal departments in the development of the national economy, as well as to guide the formulation of China’s mineral product price adjustment policies and how to use industrial policies to promote the development of the mining industry.
This study is structured as follows: Section 1 shows the introduction; Section 2 describes the current status of China’s mining industry; Section 3 introduces the data and methodology for examining the MI’s contribution to the national economy from four aspects: the demand-driven model, the supply shortage model, the price-side model, and the inter-industry linkage model; Section 4 analyzes the results; and, finally, Section 5 draws the conclusions and critical policy implications.
2 Current Status of the Mining Industry in China
According to the industry classification in the National Bureau of Statistics of the People’s Republic of China (NBSC), the MI consists of five main sub-sectors: non-ferrous metal ore mining and processing (NFMOMP), coal mining and washing (CMW), ferrous metal ore mining and processing (FMOMP), petroleum and natural gas extraction (PNGE), and non-metal ore mining and processing (NOMP) (Wang and Feng, 2017). As shown in Table 1, the MI is divided into four sections in the Chinese IO table: coal, crude petroleum and natural gas, metal ores, and non-metallic mineral mining, with FMOMP and NFMOMP counted as metal ores.
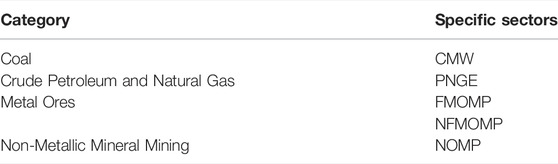
TABLE 1. The categories of the four major mining sectors.
The MI is an essential sector in the national economy since it provides raw materials for manufacturing (Shen et al., 2015; Wang and Sun, 2017). However, the global mining industry is currently in flux due to economic restructuring and price drops in most mineral products. Between 2003 and 2011, China’s mining economy was in a high-speed development phase, with the output value increasing from 0.74 trillion yuan to 5.86 trillion yuan and an average annual growth rate of 29.6%, but since 2012, China’s MI has been in a “transition period” (Chen et al., 2015), with an average annual growth rate of 3.5% between 2012 and 2014. As shown in Figure 1, the fixed-asset investment growth rate in China’s MI has declined, even in 2016 and 2017, with successive negative growth, and has since only maintained an average annual growth rate of around 2%. In 2020, among the mining sector’s fixed-asset investments, those in the coal and non-metallic sectors grew slightly, by 2.2 and 4.9%, respectively. Meanwhile, due to the plunge in crude oil prices, fixed-asset investments in crude petroleum and natural gas fell sharply by 21.8%. In addition, fixed-asset investments in FMOMP and NFMOMP narrowed, down 9.9 and 6.1% year-on-year, up 8.9% points and 21.5% points from last year, respectively. It has been said that China’s mining economy is in a new phase dubbed “new normal,” characterized by medium-speed growth, economic restructuring, and upgrading (Cheng et al., 2015; Tung, 2016).
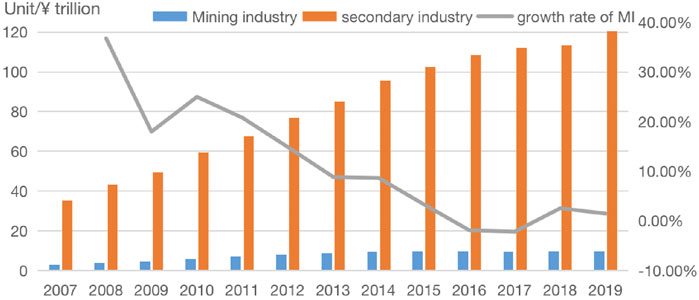
FIGURE 1. China’s fixed-assest investment in mining and secondary industry from 2007 to 2019.
This year (2021) is the opening year of China’s 14th Five-Year Plan when China officially starts a new journey to build a comprehensive socialist modern state. Moreover, with its expected population peak in 2030, China will remain the primary driver of global economic growth in the next decade, and the demand for mineral resources will continue to grow (Guo et al., 2021). In particular, bulk minerals such as iron ore and copper, closely related to new infrastructure, are in solid demand, driven by investment. In 2019, the total number of people employed in China’s MI and MI-related sectors reached 3.677 million, accounting for 2.14% of national employment (National Bureau of Statistics of China, 2020). In the background, implementing China’s “One Belt, One Road” strategy will bring development opportunities for China’s MI, and the rational development and utilization of mineral resources will effectively promote economic recycling and protect the ecological environment (Zhou et al., 2020).
3 Materials and Methods
3.1 Data Sources
We used China’s IO tables for 2007, 2012, and 2017 compiled every 5 years by the NBSC (National Bureau of Statistics of China, 2019), to analyze the roles of China’s MI. Furthermore, the essential data, such as value contributed, total output value, and employee remuneration, were from the China Mineral Resources report and the National Plan for Mineral Resources 2016-2020(Ministry of Natural Resources), issued by the Ministry of Natural Resources (Ministry of Natural Resources PRC).
The entire mining sector was not available in China’s IO tables. Therefore, based on the sectoral analysis, the main issue was summing up the sub-sectors of the mining industry in the IO table to obtain data for the entire mining industry. The steps were as follows: first, the Chinese mining industry’s four major sub-sectors were identified (Table 1) based on the industry classification standard and main mining activities. Next, based on statistics, such as total output value and value-added for the four mining sub-sectors, we aggregated the entire mining industry, the sum of all sub-sectors. They are the basis for further evaluation on economic effects of MI on the national economy of China.
IO analysis is the analysis method to quantitatively grasp the interrelation among the industries produced through production activity by using the input-output table covering the whole of national economy. It is possible for this analysis to analyze the interrelation among the industries which does not deal with macro-analysis. It is useful to analyze a concrete economic structure (Ghosh, 1958; Wu and Chen, 1990). Exogenous specification can examine the influence which one variable has on the endogenous economy sector by treating the variable exogenously. By using the exogenous specification, we can know the influence which the output of a specific sector has and the effect that the output causes other industries.
3.2 General Framework of the IO Model
The first researcher to employ an IO matrix depiction of a national or regional economy was Leontief (1966), who employed an inverse matrix to solve the mathematical relationship of inter-industry transaction tables based on the IO table’s general framework. In an IO table, the columns indicate the input values for each sector, while the rows represent the output values. For example, if the IO table is divided into N sectors: sector i’s total input is denoted by
3.3 Demand-Driven Model
The inducement effects on production, value-added, and wage-inducing can be evaluated in the demand-driven model. These effects mean that how much the production, value-added, and wages of other industries, excepting for the target industry increase, when the production of the target industry which is the industry related to the China’s MI increases with $1. The following equations to evaluate the inducement effects of the production, value-added, and wage-inducing by treating the industry regarding with the China’s MI (hereinafter referred to as “H sector”) as exogenous. The process to induce each equation can refer to a large number of papers on IO analysis (Yoo and Yang, 1999; Oosterhaven, 2019).
3.3.1 Production-Inducing Effects
3.3.2 Value-Added Creation Effects
3.3.3 Wage-Inducing Effects
3.4 Inter-Industry Linkage Model
The industry linkage model is proposed to measure the backward and forward relationship between one industry and other sectors in order to examine the strengths of the industry linkage within the national economy account. That is, the backward linkage represents the importance of the MI as demanders, whereas the forward linkage represents the importance of the MI as suppliers (Hirschman, 1958).
In terms of dispersion power, the backward linkage reflects a column vector analysis of the Leontief inverse matrix. This model examines the effects on all sectors of production when the MI’s ultimate demand increases by one unit. All sectors have a societal average level of 1. When the MI’s backward linkage is more than one, it implies that the sector’s influence on the national economy surpasses the societal average level of all sectors. The backward linkage effect can be expressed as follows:
Where
In terms of dispersion sensitivity, the forward linkage examines the change in one mining sector when the ultimate usage in the remaining sectors increases by one unit. A row vector analysis of the Leontief inverse matrix is reflected in the forward linkage. The following is an expression for the forward linkage effect:
Where
3.5 Supply-Driven Model
Equation 2 in the IO table can also be expressed as
Where
3.6 Price-Side Model
The price-side model or Leontief price model can be used to assess the impact of price changes in one sector on the price levels of other sectors (Hirschman, 1958). The IO price-side model does not take into account the impact of changes in net wages or production taxes and operating earnings on prices (Yoo and Yoo, 2009). The price-side effect can be modified as follows:
where
4 Results and Discussion
4.1 Data
The MI is divided into four sub-sectors in the basic scale IO table: coal, crude petroleum and natural gas, metal ores, and non-metallic mineral mining. The sector categorization utilized in this study is shown in Table 2, comprising 38 large-scale sectors and four MI sub-sectors. Consequently, five analysis findings are presented: one for the whole MI and one for each of the four sub-sectors. In addition, all findings are based on research identifying the MI sector as exogenous rather than endogenous.
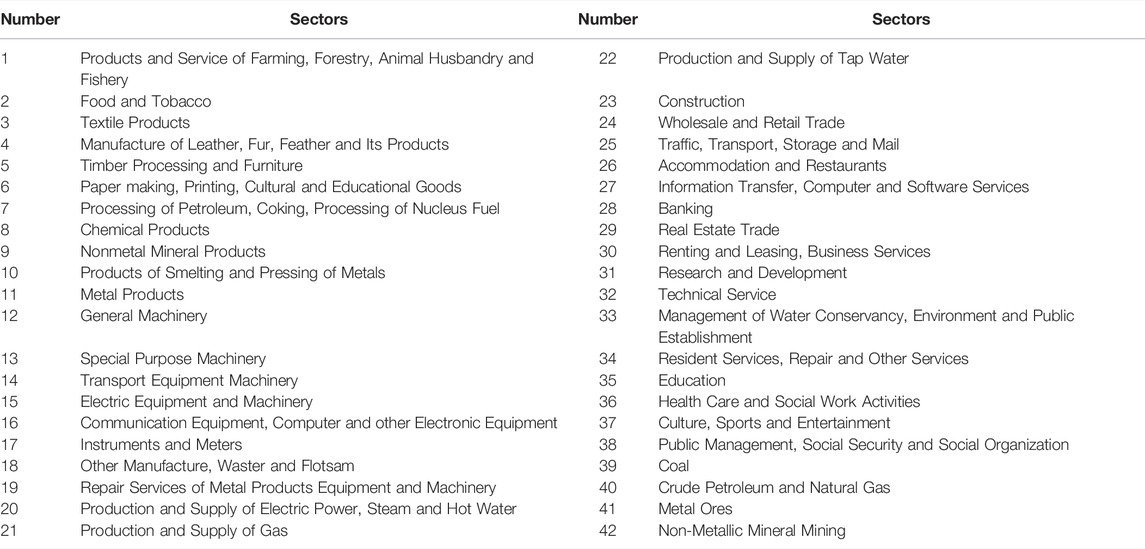
TABLE 2. Sector classification adopted in this study.
4.2 Results of the Demand-Driven Model
The sectoral impacts of mining investment are summarized in Tables 3–5. Table 3 shows the results of the demand-driven model in analyzing the MI’s production-inducing impact. The sum of $1 of production or investment in the other sectors is $0.896–$1.360 (coal), $0.880–$1.214 (crude petroleum and natural gas), $1.185–$1.711 (metal ores), and $1.522–$1.716 (non-metallic mineral mining), respectively. Thus, the overall production-inducing effect of $1 of mining production or investment on other sectors is $0.862–$1.171.
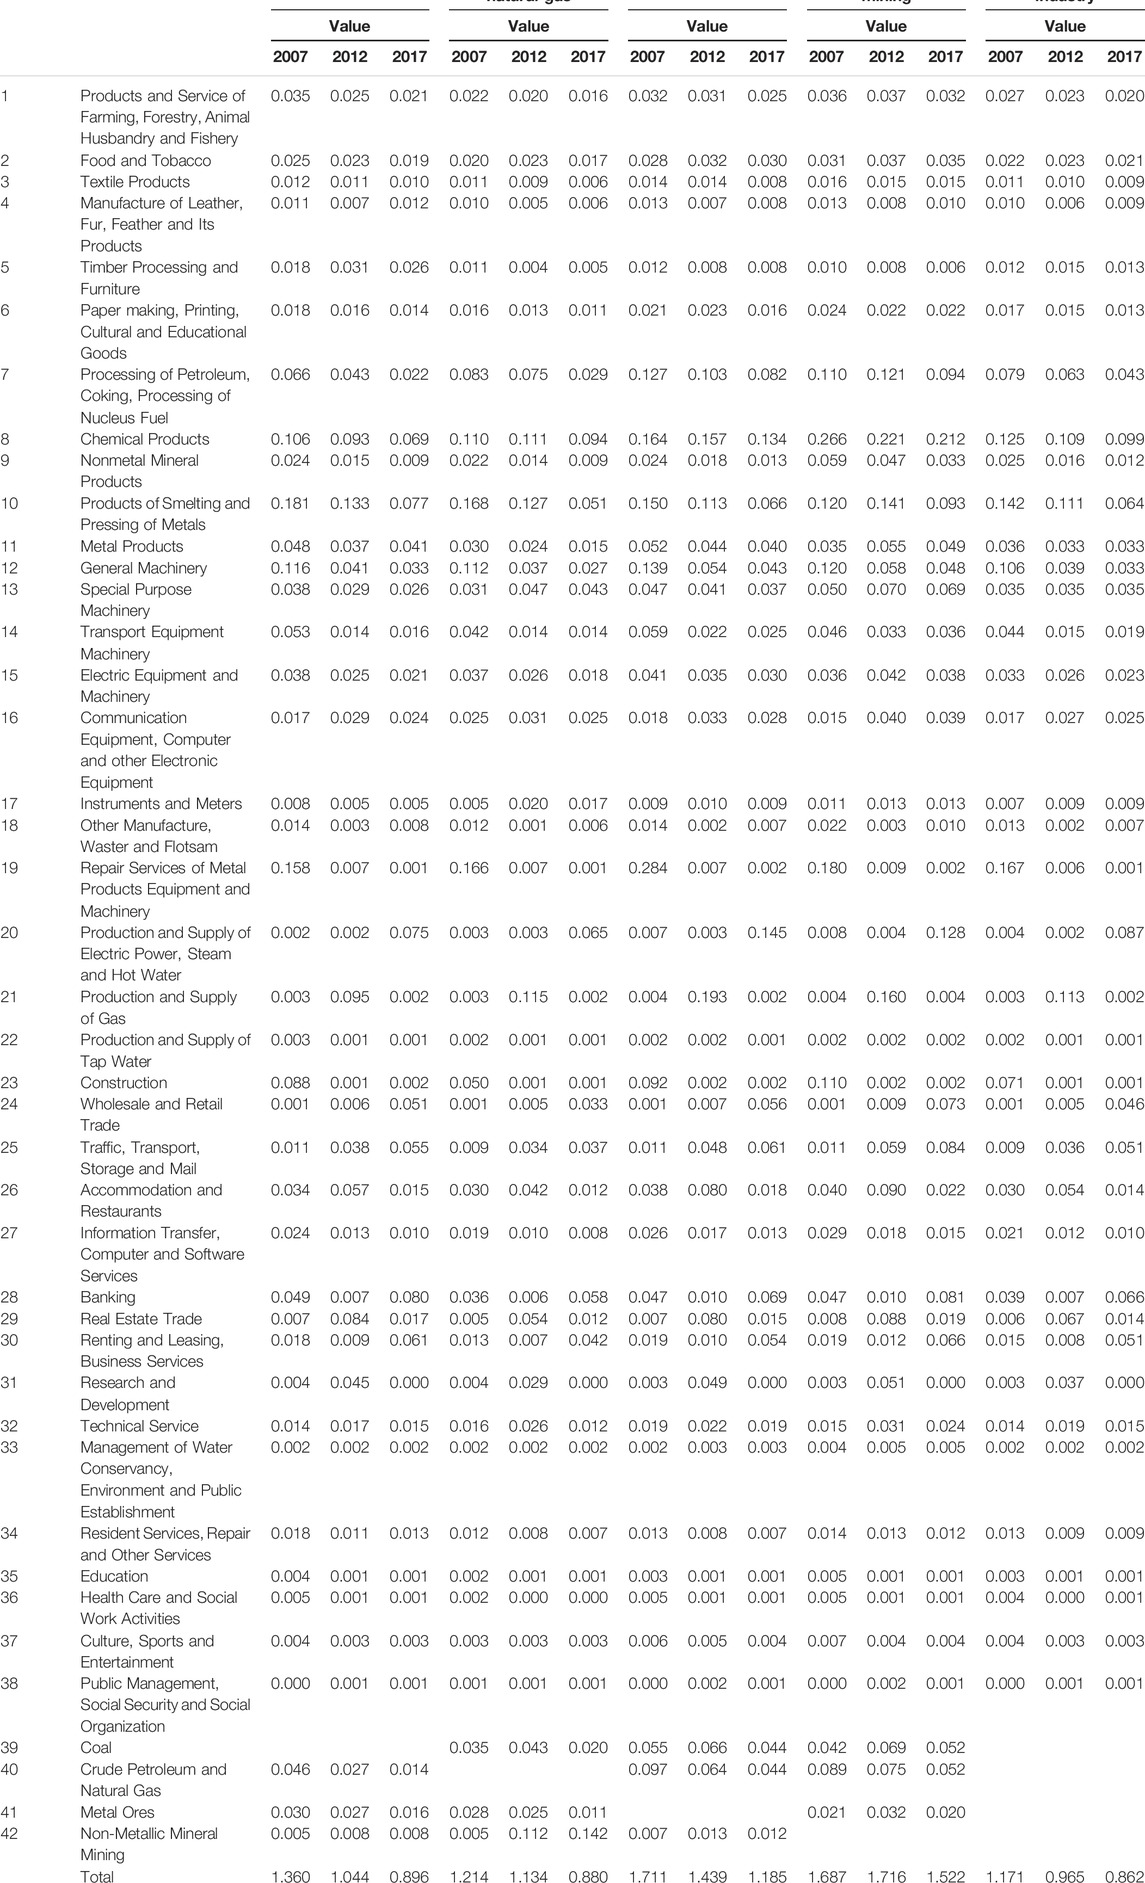
TABLE 3. Production-inducing effects of mining industry.
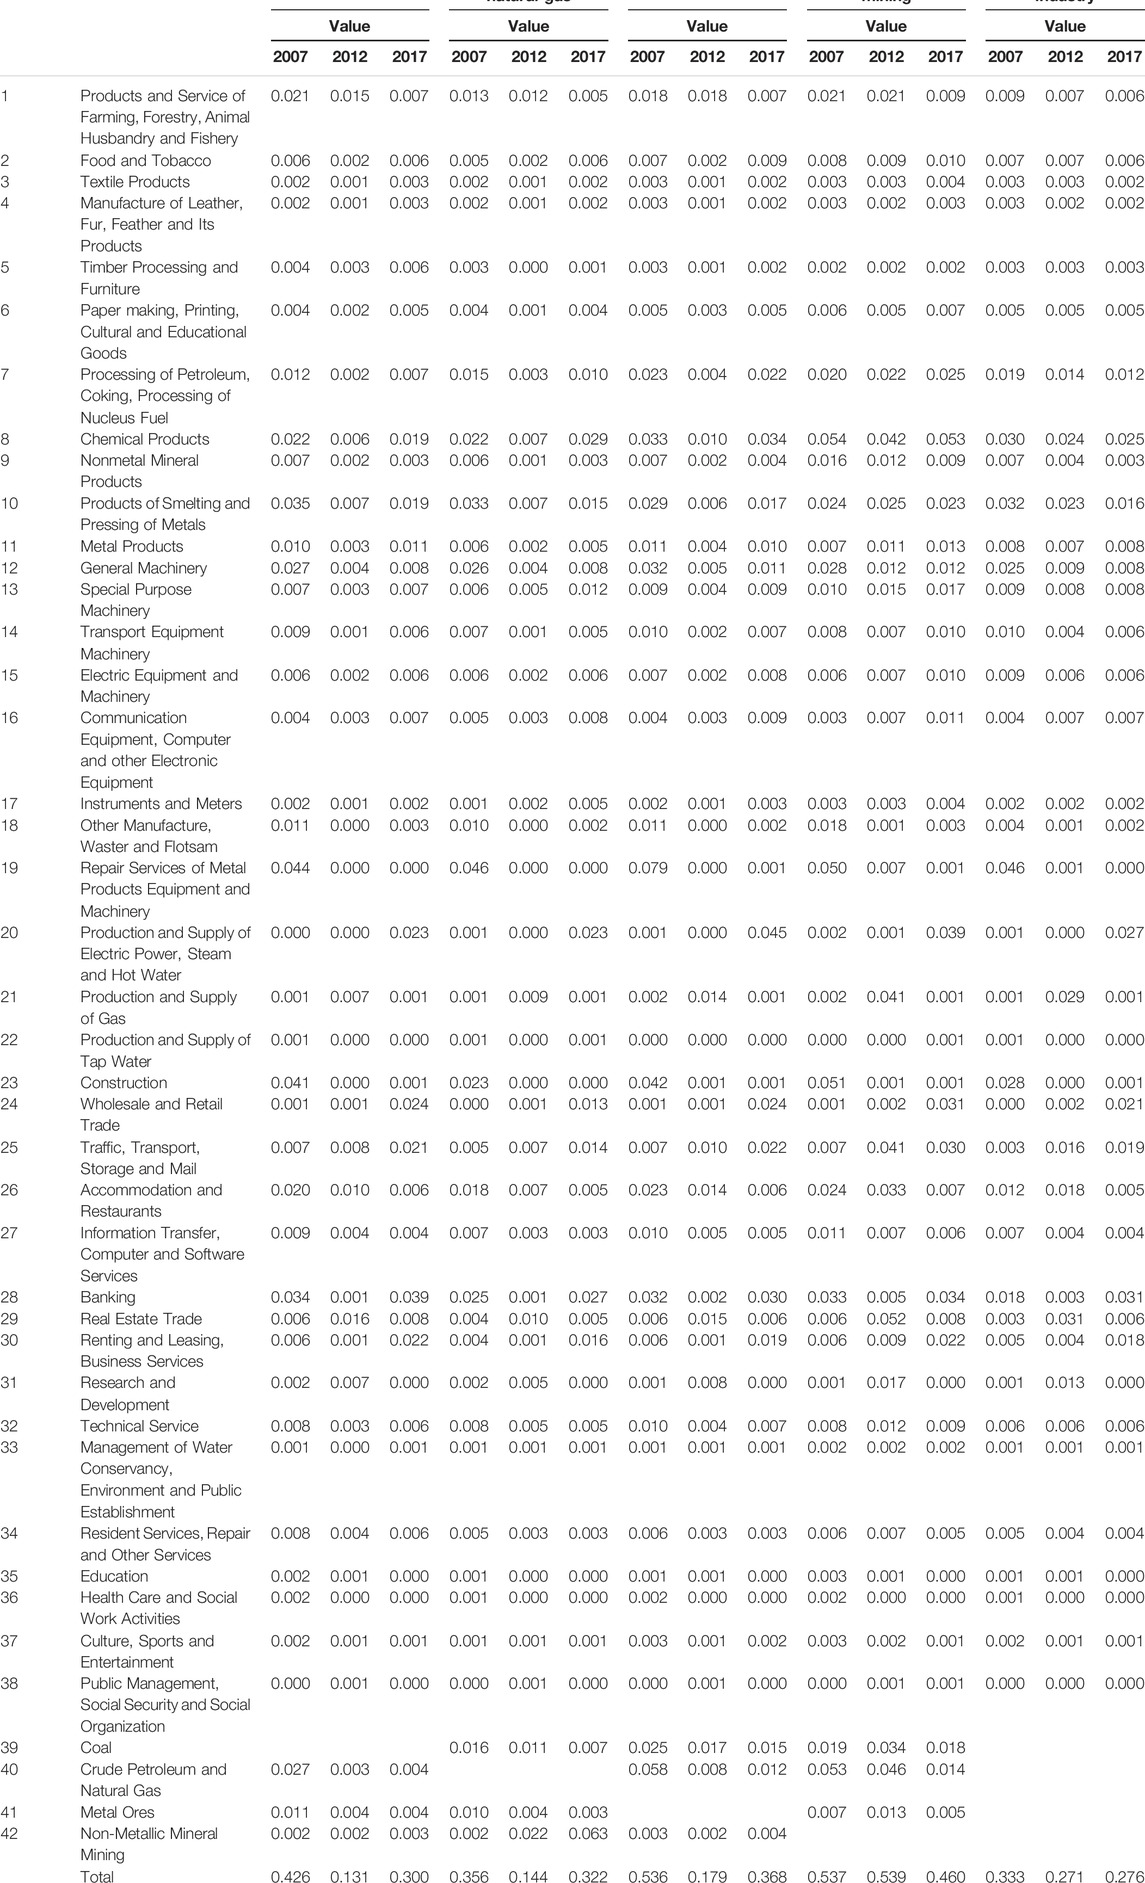
TABLE 4. Value-added creation effects of mining industry.
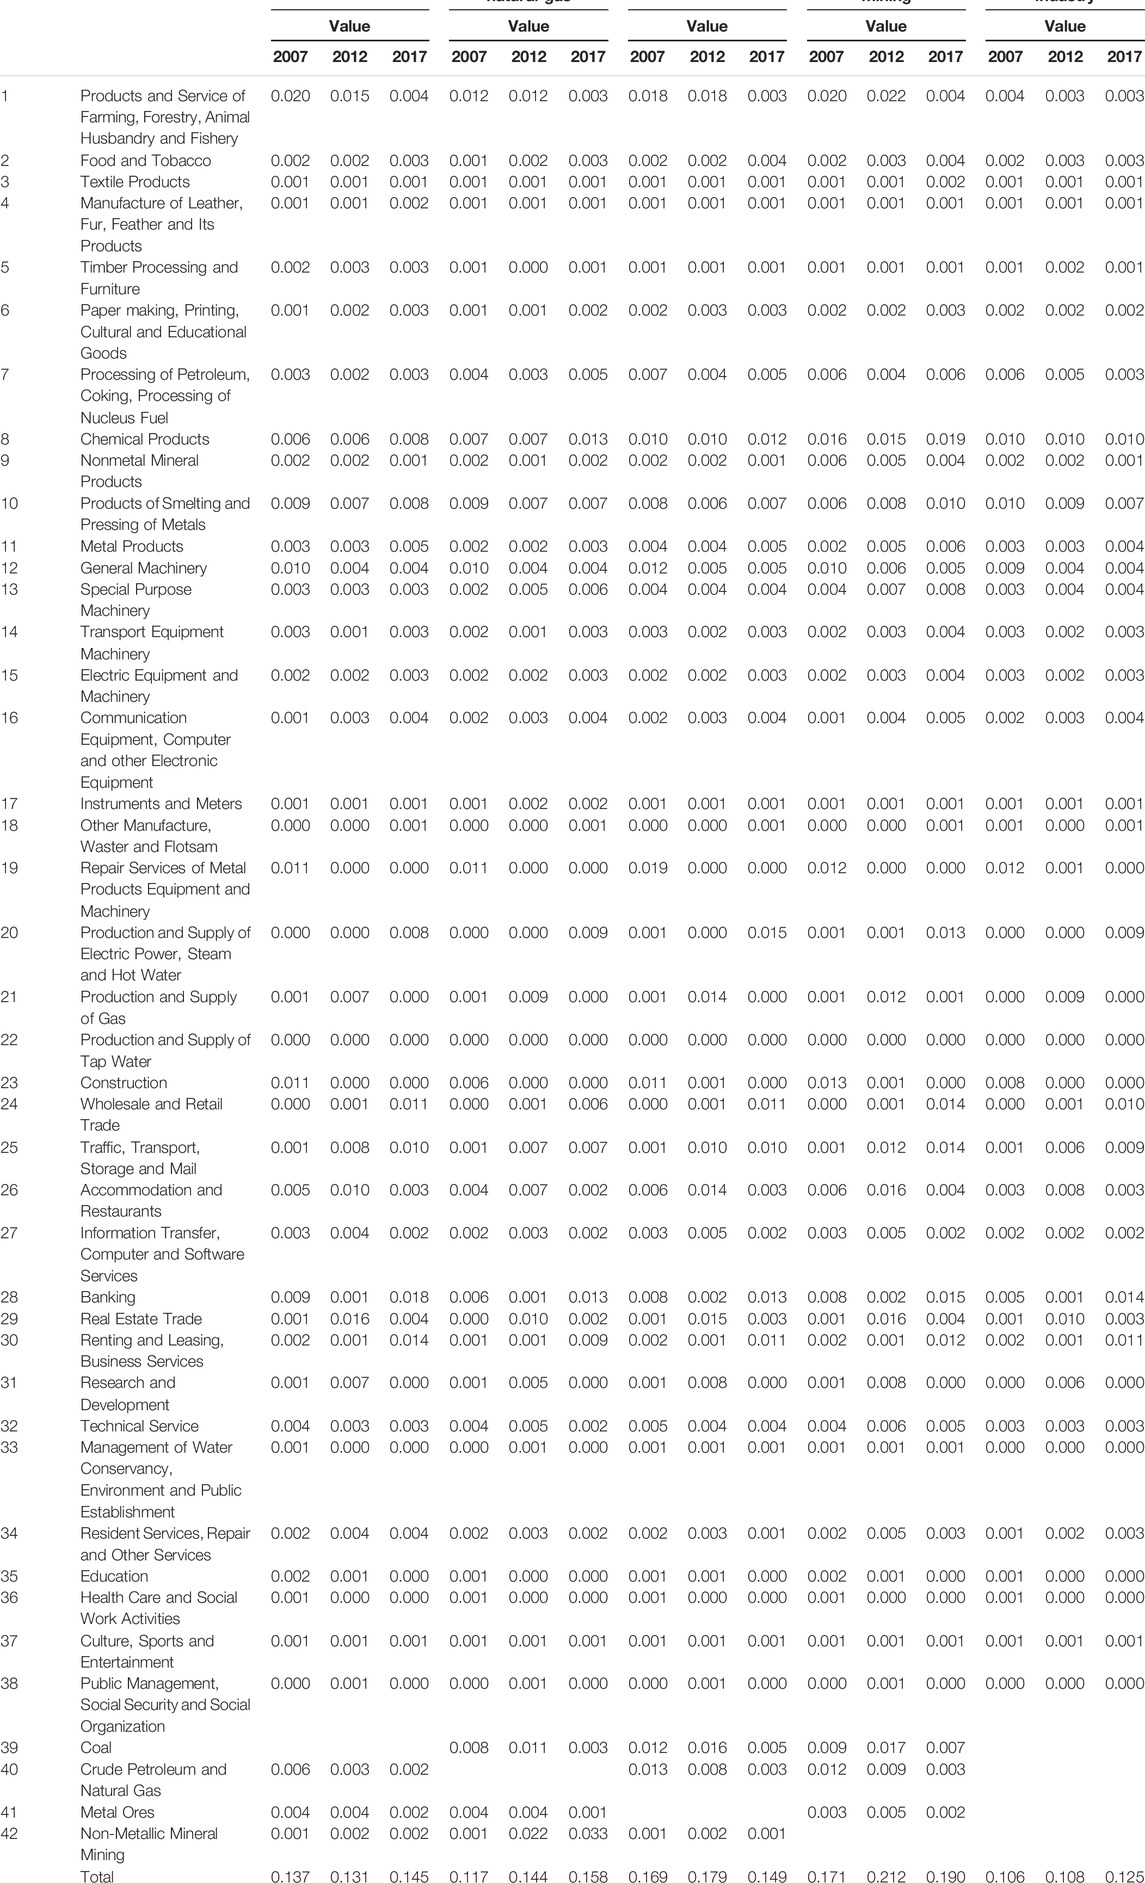
TABLE 5. Wage-inducing effects of mining industry.
Table 4 evaluates an impact analysis of the MI’s value-added creation on other sectors. Production or investment of $1 in the coal, crude petroleum and natural gas, metal ores, and non-metallic mineral mining sectors, respectively, generates $0.131–$0.426, $0.144–$0.356, $0.179–$0.536, and $0.460–$0.539 of value-added for other sectors. Thus, the effect of $1 production or investment in value-added creation in the entire MI on other sectors is $0.271–$0.333.
Table 5 presents the conclusions of calculating the MI’s wage-inducing effects. Production or investment of $1 in the coal, crude petroleum and natural gas, metal ores, and non-metallic mineral mining sectors, respectively, produces $0.131–$0.145, $0.117–$0.158, $0.149–$0.179, and $0.171–$0.212 of wages in other sectors. Thus, the wage-inducing effect of $1 of MI production or investment on other sectors is $0.106–$0.125.
4.3 Results of the Supply-Driven Model
Table 6 depicts the costs of sectoral mining supply shortages in 2007, 2012, and 2017. Each figure represents how much output loss would be suffered in other sectors in the case of a $1 supply failure in the MI. The total impact of a supply failure in each MI sub-sector on the national economy can be obtained by combining the effects of a supply shortfall in each sector. The supply shortage effects of the coal, crude petroleum and natural gas, metal ores, non-metallic mineral mining sectors, and the entire MI is calculated to be $4.026–$5.280, $5.045–$9.553, $9.300–$13.755, $5.294–$6.557, and $4.383–$5.949, respectively. All of the results are significantly greater than one. In other words, a $1 failure in MI supply could substantially influence the overall national economy, implying that MI products are critical to manufacturing in other industries.
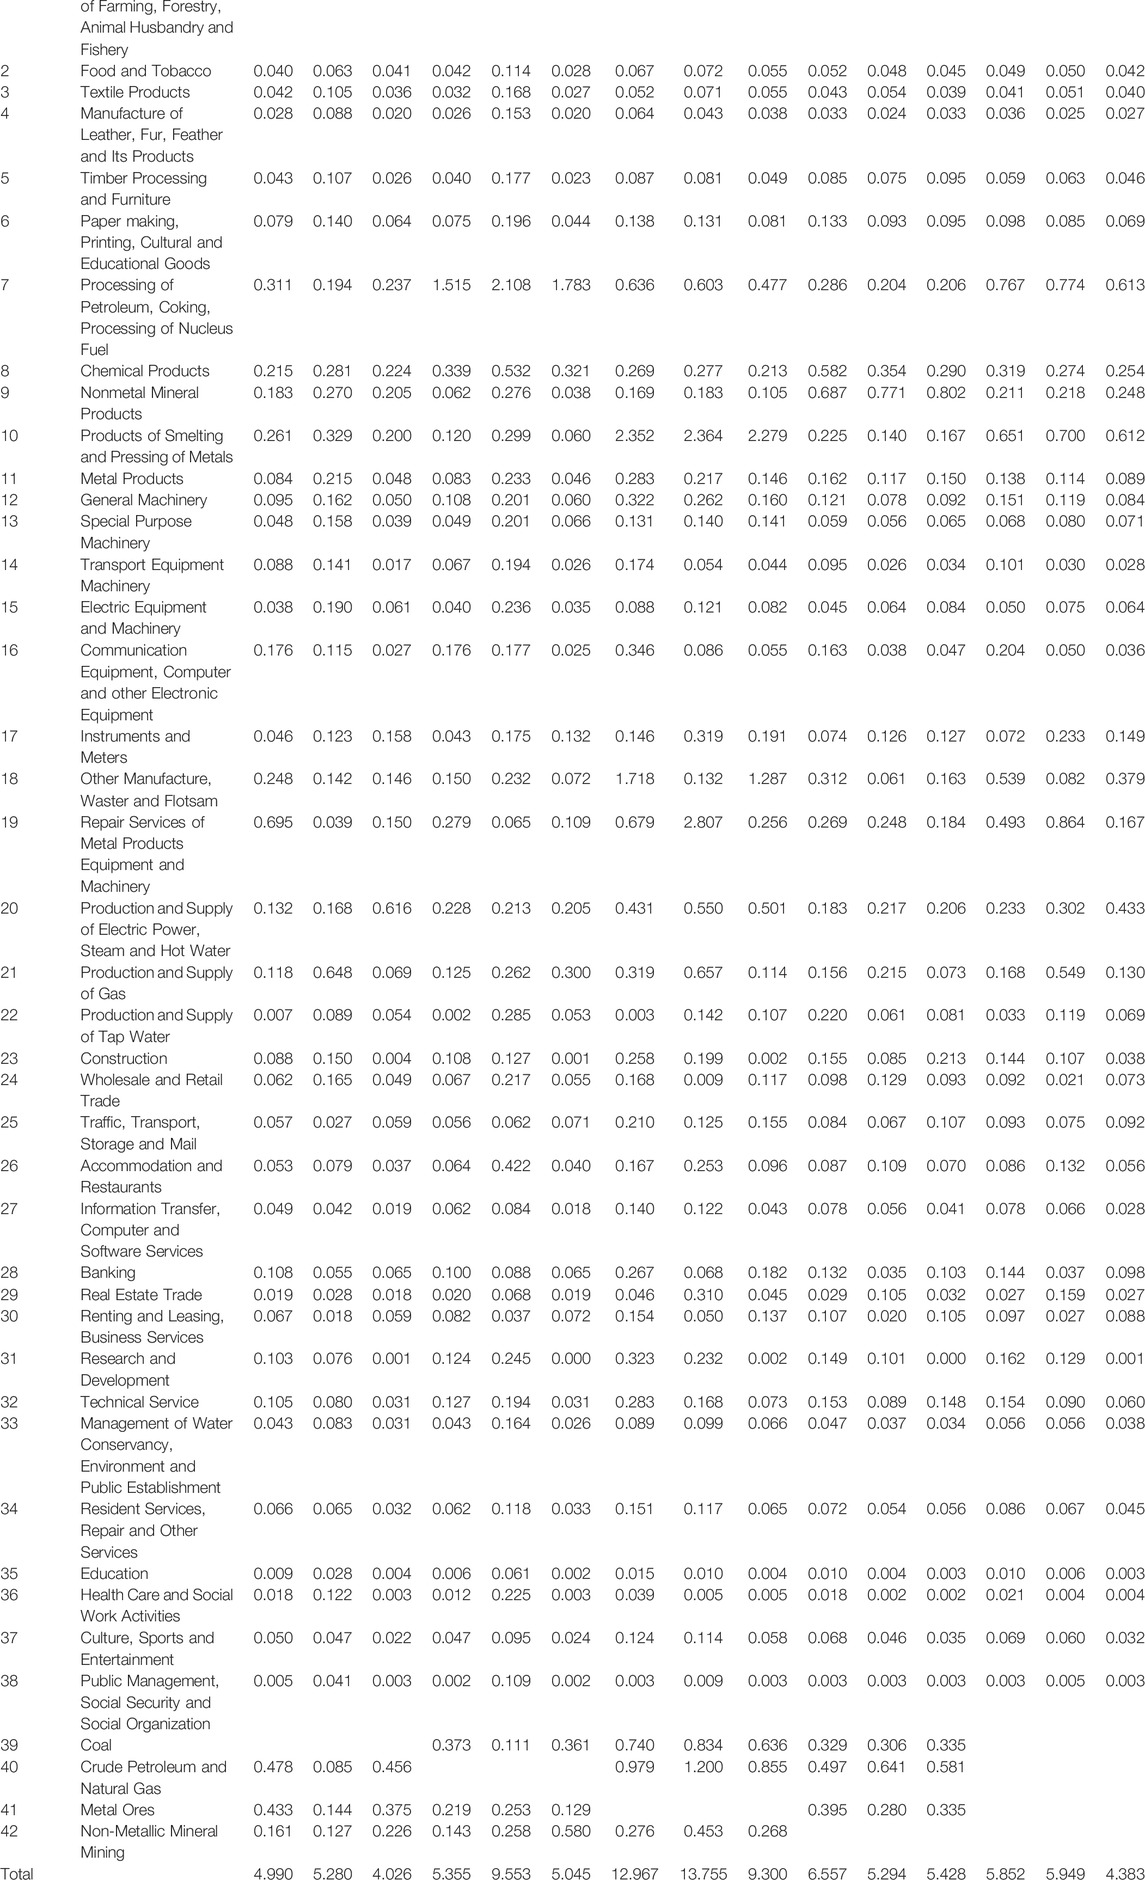
TABLE 6. Supply shortage effects of mining industry.
4.4 Results of the Price-Side Model
Table 7 shows the effect of a 10% rise in the price of MI products on the price levels of other sectors. For example, in the food and tobacco industry, the MI price-pervasive effect is given as 0.037–0.063, meaning that a 10% rise in the price of MI products increases the price of food and tobacco by 0.037%–0.063%.
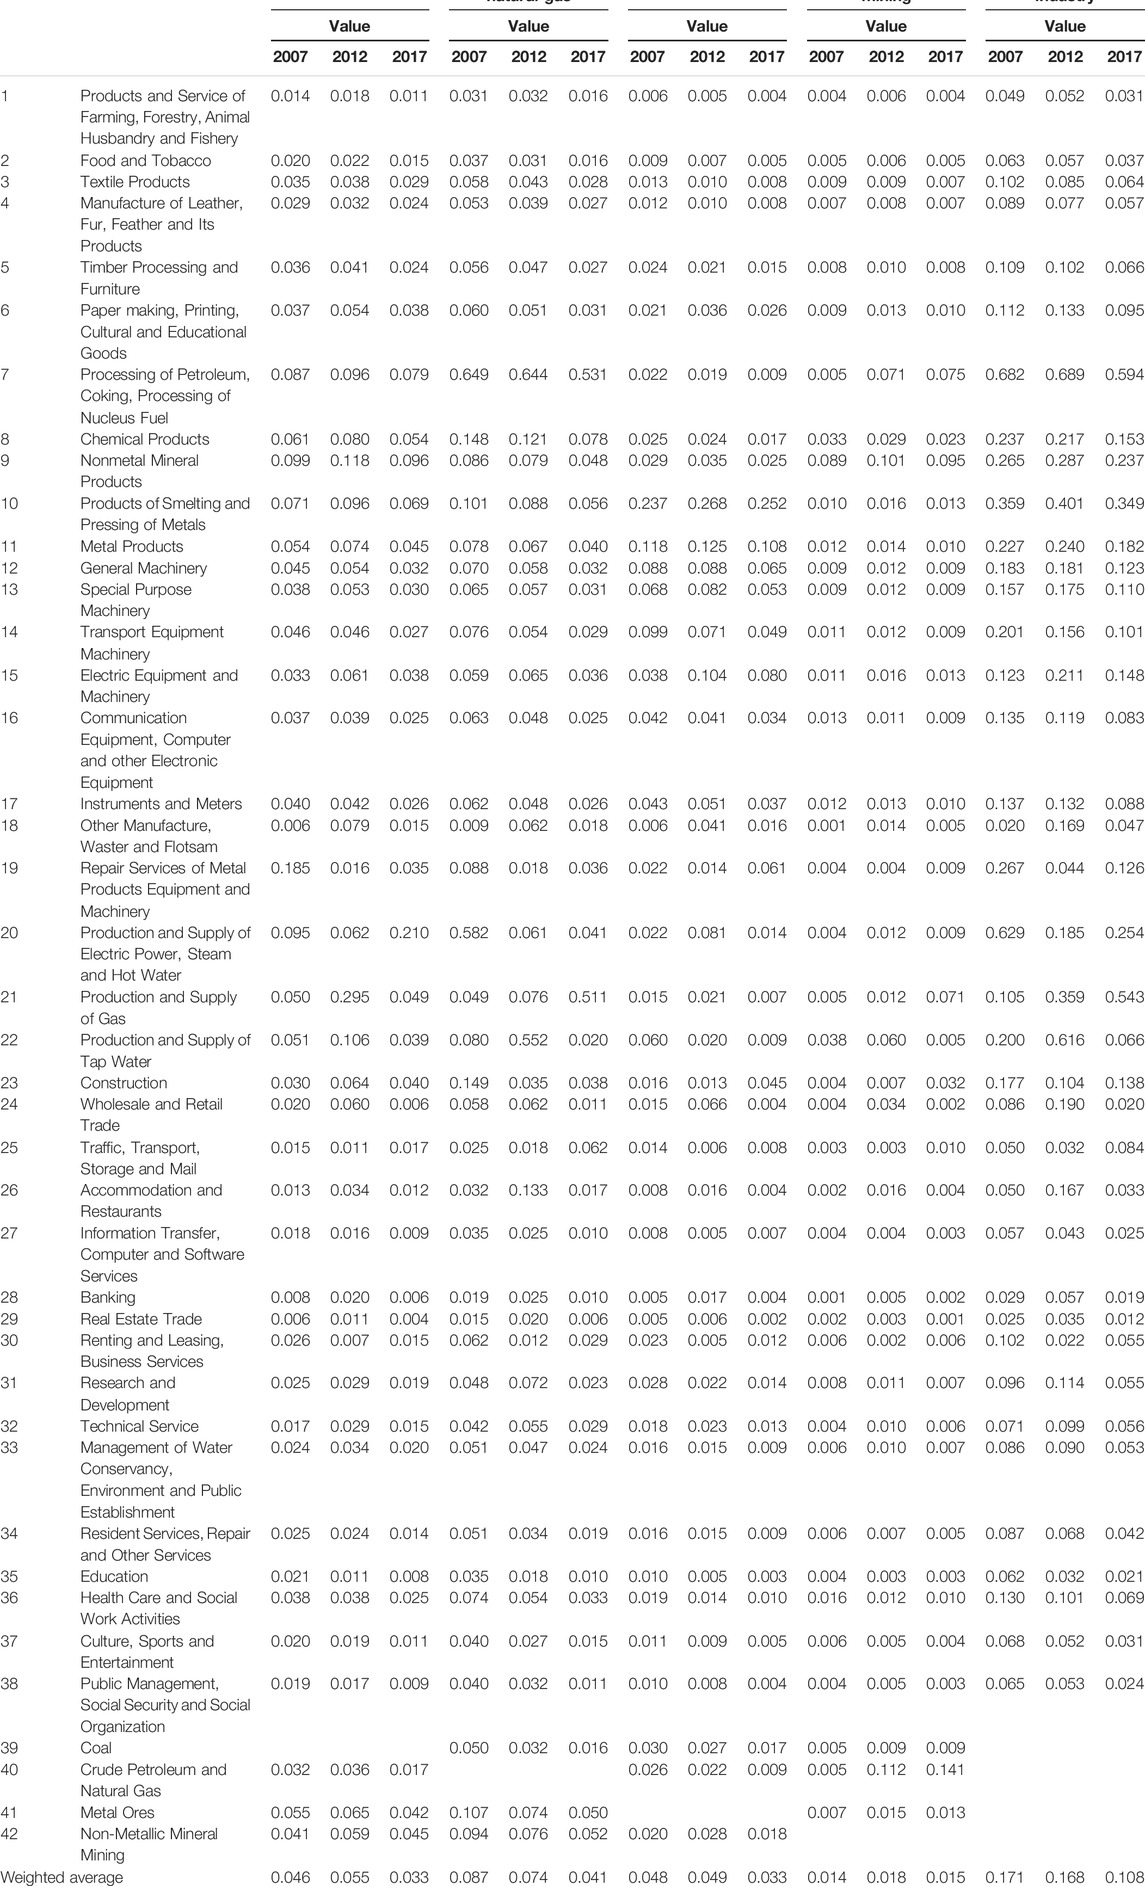
TABLE 7. Price-pervasive effects of 10% increase in the price for the output of mining industry.
When calculating the impact of price changes in the mining sector on the whole economy, the percentage values for each industry are summed and averaged, and the total impact is overestimated. Therefore, the price-pervasive effect on the economy can be calculated by weighted averaging of each sector’s price-pervasive effect on each sector’s output. For example, the weighted averages of the price-pervasive effect of a 10% increase in the price of coal, crude petroleum and natural gas, metal ores, and non-mineral mining sectors, and the entire MI sector, are estimated to be 0.033%–0.055%, 0.041%–0.087%, 0.033%–0.049%, 0.014%–0.018%, and 0.108%–0.171%, respectively.
4.5 The Inter-Industry Linkage Effect
Table 8 shows the mining sector’s inter-industry forward and backward linkage effects in 2007, 2012, and 2017. Two interesting facts were uncovered. First, except for metal ores (2007), the mining sector’s sensitivity to dispersion was less than one, implying that the MI’s forward linkage impact is less than the total of other industries. In other words, the MI is unaffected by changes in other industries and contributes significant input to the country’s economy. Second, the MI’s dispersion power is greater than one, indicating that mining exerts considerable economic influence on other industries. Therefore, the MI should be classified as a final manufacturer, as it has high backward and low forward linkages (Ivanova, 2014).

TABLE 8. The inter-industry linkage effect.
4.6 Discussion of the Results
This paper investigated the influence of the four MI sectors, including the overall MI sector, on the Chinese national economy from 2007 to 2017 using extensive IO analyses, including the demand-driven, supply-driven, and price-side models, and inter-industry linkage effect. The economic consequences of the IO analysis had three significant implications.
First, we used the demand-driven model to evaluate the MI’s economic consequences. As a result, the production-inducing effects, value-added creation effects, and wage-inducing effects of $1 of MI production or investment on the national economy were calculated to be $0.862–$1.171, $0.271–$0.333, and $0.106–$0.125, respectively. The figures on sectoral impacts of MI investments from the demand-driven model can be interpreted as benefits which ensue from development projects. As a result, policy decisions on whether to conduct a proposed MI project or not could, in principle, be deduced from an examination of costs and benefits associated with the project (Heo et al., 2010).
Since the study also estimated the economic effects for each sector, it is possible to examine the impacts of increased production or investment in the MI on each sector. In particular, the chemical products sector is the most affected by production or investment in the MI. This means that if the MI is activated, the Chemical Products sector will be activated the most. That is, the MI demands output from the Chemical Products sector more than it does from other sectors. However, production and investment in the MI have little influence on the Production and Supply of Tap Water sector.
Second, we used the supply-driven model to investigate the MI impact on supply shortages. Using the supply-driven model in IO analysis has increased in recent years due to the increased frequency of global natural disasters, such as COVID-19 pandemics and earthquakes, as it is helpful in setting economic reliability standards in the MI industry, but also in determining pricing and load management strategies (Howe et al., 1994). The effects of $1 of supply shortages in the Coal, Crude Petroleum and Natural Gas, Metal Ores, Non-Metallic Mineral Mining sectors, and the entire MI on the national economy were calculated to be $4.0262–$5.280, $5.045–$9.553, $9.300–$13.755, $5.294–$6.557, and $4.383–$5.949, respectively.
The results demonstrate that these numbers are much higher than one, indicating that MI production failure would significantly negatively impact the national economy because MI output is a primary input in other sectors’ manufacturing. Therefore, the government should make every effort to guarantee a steady MI supply, as a MI supply deficit could substantially negatively impact the economy (Feng et al., 2019). Supply shortages effects of the Metal Ores sector would be the most serious in the four MI sub-sectors.
Third, we employed a price-side model to analyze the impact of increased MI pricing on other industries. In addition, as the MI is exogenous in classic models, we attempted to consider the MI as an exogenous sector in this research. The impacts of a 10% price increase in the MI sector on the national economy were 0.033%–0.055%, 0.041%–0.087%, 0.033%–0.049%, 0.014%–0.018%, and 0.108%–0.171%, for the Coal, Crude Petroleum and Natural Gas, Metal Ores, Non-Metallic Mineral Mining sectors, and the entire MI, respectively. Thus, the price effects were minor overall.
For some reasons, there may be changes in the price of the output of the MI. A rise in raw material prices or labor expenses for the MI, tighter government regulations linked to safety and the environmental protection for the MI, or a decrease in yield due to a natural reduction in mineral deposits may cause an increase in the price of production in the MI (Ilankoon et al., 2018). Therefore, these results can be useful in formulating a MI pricing strategy based on the price-side model. Furthermore, it is possible to predict the sectors with significant or minor influence because mining costs have a high and low impact on different industry sectors. For example, the price effect of the MI is the largest for the Products of the Smelting and Metal Pressing sector.
5 Conclusion and Implications
5.1 Main Findings and Conclusions
This study investigated the influence of the MI sector on the Chinese national economy from 2007 to 2017 using comprehensive IO analyses, such as the demand-driven, supply-driven, and price-side models and inter-industry linkage effects. Except for our inter-industry linkage effects analysis, the MI sector was treated as exogenous to evaluate the net effects by changes in investment, supply, or price in each sector.
Based on the analytical results from the demand-driven model, a $1.0 change in the MI sector investment induced $0.862–$1.171 of the output, $0.271–$0.333 of the value-added, and $0.106–$0.125 of the wages in the national economy.
According to the analytical results from the supply-driven model, the supply shortage effect of the MI sector was $4.383–$5.949. In detail, sectors including “Processing of Petroleum, Coking, Processing of Nucleus Fuel”, “Products of Smelting and Pressing of Metals”, and “Repair Services of Metal Products Equipment and Machinery” presented high shortage effect.
According to the analysis based on price-side model, the national economic effect under 10% increase in the MI sector rate was 0.108%–0.171%. High sectoral price impacts were found in “Processing of Petroleum, Coking, Processing of Nucleus Fuel”, “Products of Smelting and Pressing of Metals”, and “Production and Supply of Electric Power, Steam and Hot Water”.
Finally, in the inter-industry linkage effect, the backward linkage effect of the MI sector was found greater than one, as 2.228–2.350, and the forward linkage effect was less than one, as 0.825–0.896. This indicated that the MI sector can be classified as a final manufacturer. This implies that the MI has bigger impacts in terms of investment expenditures on the national economy than other business. That is, the MI has a relatively strong capacity for pulling in other industries.
In conclusion, the temporal analysis shows that MI sectors play an increasingly important role in China from 2007 to 2017. The total contribution of the MI sectors shows a significant increase in this decade, but the growth rate slows down between 2012 and 2017. This may be caused by the lack of new mining economic motivation in the process of China’s mining restructuring. Another reason may be the global concern for environmental protection issues and mining sustainability strategy. The Chinese National 13th 5-year plan (2016–2020) recommends low carbon, clean, safe and modern energy systems (e.g., replace coal power generation with nuclear power) (Xing et al., 2017). However, with the promotion a series of mining regulations, such as the development of Green Mining Construction (GMC), the sustainable mining industry is gradually recovering.
5.2 Policy Implications
While our findings verified the positive effects of MI on national economy based on the evidence of China, much more work is needed to really integrate MI as an economic system innovation. Enlightened by the experiences of China and the key findings from our analysis, several policy implications were proposed and discussed as follows:
• First, the IO analysis was found to be beneficial in evaluating the economic effects of the Chinese MI, which is in line with prior study findings (Wang et al., 2019; Kim et al., 2020). IO analysis is a useful tool for studying various MI-related policy concerns, despite its inherent constraint of assuming fixed input needs. To modernize the MI and develop a sustainable, low-carbon, safe and efficient energy system, it is necessary for the Chinese government to transform the extensive mining paradigm by adopting new technologies, processes and equipment.
• Second, The analysis results from the price-side model showed that the adjustment of mining prices had little impact on household consumer goods. Considering the affordability of various industries in the national economy and people’s lives, it is necessary to reform the price of mineral products, change the unreasonable price relationship between mineral products and industrial products, and formulate a reasonable price system for mineral products.
• Third, in response to the environmental pollution caused by MI, the Chinese government has adopted a series of environmental control measures, such as setting up relevant environmental regulations to regulate the industry. However, due to the significant contribution of MI to the national economy, other measures should be taken by the Chinese government to overcome the lagging effect of the regulations on the industry development in addition to the implementation of them, so as to achieve a healthy and sustainable development of MI.
5.3 Research Limitations and Future Concerns
This paper used IO analysis to assess the feasibility of the mining sector’s overall economic contribution in China and produced a set of important indicators that could be utilized to build policy and the MI economy. However, the limitation of this article is that we treat the investments of MI projects as accumulative value rather than on-site survey data, while the NBSC is published every 5 years, hence the data match and timeliness issue might generate some uncertainty on the result.
As a follow-up to this study, future related studies may be carried out in two directions. First, although the article used the national IO table, multi-regional IO analysis can be carried out by employing a multi-regional IO table. This allows quantitative analysis of inter-regional effects as well as intra-regional effects. Second, the aim of the study is to assess the value of both direct and indirect contributions of China’s MI; however, it only considers the benefits of mining economy activities. Therefore, in future research, factors such as environmental pollution and shortage of mining resources should be taken into consideration to examine both the advantageous and disadvantageous impacts of the MI on the national economy.
Data Availability Statement
The original contributions presented in the study are included in the article/Supplementary Material, further inquiries can be directed to the corresponding author.
Author Contributions
The three authors have equally participated in conceptualization, literature review, data analysis and writing of the paper.
Conflict of Interest
The authors declare that the research was conducted in the absence of any commercial or financial relationships that could be construed as a potential conflict of interest.
Publisher’s Note
All claims expressed in this article are solely those of the authors and do not necessarily represent those of their affiliated organizations, or those of the publisher, the editors and the reviewers. Any product that may be evaluated in this article, or claim that may be made by its manufacturer, is not guaranteed or endorsed by the publisher.
References
Agyekum, E. B., Amjad, F., Mohsin, M., and Ansah, M. N. S. (2021). A Bird's Eye View of Ghana's Renewable Energy Sector Environment: A Multi-Criteria Decision-Making Approach. Util. Policy 70, 101219. doi:10.1016/j.jup.2021.101219
Asbahi, A. A. M. H. A., Gang, F. Z., Iqbal, W., Abass, Q., Mohsin, M., and Iram, R. (2019). Novel Approach of Principal Component Analysis Method to Assess the National Energy Performance via Energy Trilemma Index. Energy Rep. 5, 704–713. doi:10.1016/j.egyr.2019.06.009
Beylot, A., and Villeneuve, J. (2015). Assessing the National Economic Importance of Metals: An Input-Output Approach to the Case of Copper in France. Resour. Policy 44, 161–165. doi:10.1016/j.resourpol.2015.02.007
Chen, J., Jiskani, I. M., Jinliang, C., and Yan, H. (2020). Evaluation and Future Framework of Green Mine Construction in China Based on the DPSIR Model. Sustain. Environ. Res. 30 (1), 1–10. doi:10.1186/s42834-020-00054-8
Chen, Q. S., Yu, W. J., and Zhang, Y. F. (2015). Considerations on the Strengthening Mineral Resources Reserve in China. China Mining Magazine 2015 (1), 20–23. doi:10.3969/j.issn.1004-4051.2015.01.005
Davis, H. C., and Salkin, E. L. (1984). Alternative Approaches to the Estimation of Economic Impacts Resulting from Supply Constraints. Ann. Reg. Sci. 18 (2), 25–34. doi:10.1007/BF01287372
Fan, S., Yan, J., and Sha, J. (2017). Innovation and Economic Growth in the Mining Industry: Evidence from China's Listed Companies. Resour. Policy 54, 25–42. doi:10.1016/j.resourpol.2017.08.007
Feng, C., Huang, J.-B., and Wang, M. (2019). The Sustainability of China's Metal Industries: Features, Challenges and Future Focuses. Resour. Policy 60, 215–224. doi:10.1016/j.resourpol.2018.12.006
Ghosh, A. (1958). Input-output Approach in an Allocation System. Economica 25 (97), 58–64. doi:10.2307/2550694
Giarratani, F. (1976). Application of an Interindustry Supply Model to Energy Issues. Environ. Plan. A 8, 447–454. doi:10.1068/a080447
Guo, J., Yan, W. D., Xu, S. G., Cui, R. G., Hu, R. B., Lin, B. L., et al. (2021). A Discussion on Evaluation Criteria and List of Critical Minerals in China. Acta Geosci. Sin. 42 (2), 151–158. doi:10.3975/cagsb.2020.090601
Heo, J.-Y., Yoo, S.-H., and Kwak, S.-J. (2010). The Role of the Oil Industry in the Korean National Economy: An Input-Output Analysis. Energy Sources, Part B Econ. Plan. Policy 5 (4), 327–336. doi:10.1080/15567240802533880
Howe, C. W., Smith, M. G., Bennett, L., Brendecke, C. M., Flack, J. E., Hamm, R. M., Mann, R., Rozaklis, L., and Wunderlich, K. (1994). The Value of Water Supply Reliability in Urban Water Systems. J. Environ. Econ. Manag. 26 (1), 19–30. doi:10.1006/jeem.1994.1002
Ilankoon, I. M. S. K., Tang, Y., Ghorbani, Y., Northey, S., Yellishetty, M., Deng, X., et al. (2018). The Current State and Future Directions of Percolation Leaching in the Chinese Mining Industry: Challenges and Opportunities. Miner. Eng. 125, 206–222. doi:10.1016/j.mineng.2018.06.006
Ivanova, G. (2014). The Mining Industry in Queensland, Australia: Some Regional Development Issues. Resour. Policy 39, 101–114. doi:10.1016/j.resourpol.2014.01.005
Jiskani, I. M., Cai, Q., Zhou, W., Chang, Z., Chalgri, S. R., Manda, E., et al. (2020). Distinctive Model of Mine Safety for Sustainable Mining in Pakistan. Min. Metallurgy Explor. 37 (4), 1023–1037. doi:10.1007/s42461-020-00207-8
Ju, H.-C., Yoo, S.-H., and Kwak, S.-J. (2016). The Electricity Shortage Cost in Korea: An Input-Output Analysis. Energy Sources, Part B Econ. Plan. Policy 11 (1), 58–64. doi:10.1080/15567249.2011.567226
Kim, K.-H., Kim, J.-H., and Yoo, S.-H. (2020). An Input-Output Analysis of the Economic Role and Effects of the Mining Industry in South Korea. Minerals 10, 624. doi:10.3390/min10070624
Lei, Y., Cui, N., and Pan, D. (2013). Economic and Social Effects Analysis of Mineral Development in China and Policy Implications. Resour. Policy 38 (4), 448–457. doi:10.1016/j.resourpol.2013.06.005
Lin, C. (2015). China's New Normal of Economy and the Optimization and Upgrading of the Economic Structure. Int. Conf. Logist. Eng. Manag. Comput. Sci. 117, 1810–1813. doi:10.2991/lemcs-15.2015.365
Means, G. C., Montgomery, D. E., Clark, J. M., Hansen, A. H., and Ezekiel, M. (1939). The Structure of the American Economy. New York: Oxford University Press.
Miller, R. E., and Blair, P. D. (1985). Input-output Analysis: Foundations and Extensions. Englewood Cliffs: Bergen. doi:10.1017/cbo9780511626982.003
Ministry of Natural Resources, The Report of China Mineral Resources. Available at: http://www.mnr.gov.cn.
Ministry of Natural Resources, The National Plan for Mineral Resources 2016-2020. Available at: https://www.cgs.gov.cn/tzgg/tzgg/201612/t20161206_418714.html
National Bureau of Statistics of China (2020). China Statistics Yearbook. Beijing: China Statistics Press.
National Bureau of Statistics of China (2012). China's 2007 Input-Output Table. China Statistics Press.
National Bureau of Statistics of China (2017). China's 2012 Input-Output Table. China Statistics Press.
National Bureau of Statistics of China (2019). China's 2017 Input-Output Table. China Statistics Press.
Oosterhaven, J. (2019). “Rethinking Input-Output Analysis,” in Briefs in Regional Science (Springer). doi:10.1007/978-3-030-33447-5
San Cristóbal, J. R., and Biezma, M. V. (2006). The Mining Industry in the European Union: Analysis of Inter-industry Linkages Using Input-Output Analysis. Resour. Policy 31 (1), 1–6. doi:10.1016/j.resourpol.2006.03.004
Shen, L., Muduli, K., and Barve, A. (2015). Developing a Sustainable Development Framework in the Context of Mining Industries: AHP Approach. Resour. Policy 46, 15–26. doi:10.1016/j.resourpol.2013.10.006
Song, Y., Huang, J., Zhang, Y., and Wang, Z. (2019). Drivers of Metal Consumption in China: an Input-Output Structural Decomposition Analysis. Resour. Policy 63, 101421. doi:10.1016/j.resourpol.2019.101421
Stilwell, L. C., Minnitt, R. C. A., Monson, T. D., and Kuhn, G. (2000). An Input-Output Analysis of the Impact of Mining on the South African Economy. Resour. Policy 26, 17–30. doi:10.1016/s0301-4207(00)00013-1
Suh, D. H. (2021). Exploring the U.S. Mining Industry's Demand System for Production Factors: Implications for Economic Sustainability. Resour. Policy 74, 101214. doi:10.1016/j.resourpol.2018.06.005
Sun, H., Pofoura, A. K., Adjei Mensah, I., Li, L., and Mohsin, M. (2020). The Role of Environmental Entrepreneurship for Sustainable Development: Evidence from 35 Countries in Sub-saharan Africa. Sci. Total Environ. 741, 140132. doi:10.1016/j.scitotenv.2020.140132
The Stats Council of the People’s Republic of China, (2020). Made in China 2025. Available at: http://www.gov.cn/.
Tung, R. L. (2016). Opportunities and Challenges Ahead of China's "New Normal". Long. Range Plan. 49 (5), 632–640. doi:10.1016/j.lrp.2016.05.001
Upadhyay, A., Laing, T., Kumar, V., and Dora, M. (2021). Exploring Barriers and Drivers to the Implementation of Circular Economy Practices in the Mining Industry. Resour. Policy 72, 102037. doi:10.1016/j.resourpol.2021.102037
Wang, G., Xu, Y., and Ren, H. (2019). Intelligent and Ecological Coal Mining as Well as Clean Utilization Technology in China: Review and Prospects. Int. J. Min. Sci. Technol. 29 (2), 161–169. doi:10.1016/j.ijmst.2018.06.005
Wang, M., and Feng, C. (2017). Analysis of Energy-Related CO2 Emissions in China's Mining Industry: Evidence and Policy Implications. Resour. Policy 53, 77–87. doi:10.1016/j.resourpol.2017.06.002
Wang, Q., and Ge, S. (2020). Uncovering the Effects of External Demand on China's Coal Consumption: A Global Input-Output Analysis. J. Clean. Prod. 245, 118877. doi:10.1016/j.jclepro.2019.118877
Wang, Y., and Wang, N. (2019). The Role of the Marine Industry in China's National Economy: An Input-Output Analysis. Mar. Policy 99, 42–49. doi:10.1016/j.marpol.2018.10.019
Wang, Z., and Sun, J. (2017). Analysis of Interregional Industry Linkage and Economic Distance in China: Evidence from the Mining Industry. Appl. Econ. 49 (6), 606–617. doi:10.1080/00036846.2016.1203062
Wu, R.-H., and Chen, C.-Y. (1990). On the Application of Input-Output Analysis to Energy Issues. Energy Econ. 12 (1), 71–76. doi:10.1016/0140-9883(90)90010-d
Wu, Y., and Zhang, W. (2016). The Driving Factors behind Coal Demand in China from 1997 to 2012: An Empirical Study of Input-Output Structural Decomposition Analysis. Energy Policy 95, 126–134. doi:10.1016/j.enpol.2016.05.007
Xing, W., Wang, A., Yan, Q., and Chen, S. (2017). A Study of China's Uranium Resources Security Issues: Based on Analysis of China's Nuclear Power Development Trend. Ann. Nucl. Energy 110, 1156–1164. doi:10.1016/j.anucene.2017.08.019
Xu, T., Baosheng, Z., Lianyong, F., Masri, M., and Honarvar, A. (2011). Economic Impacts and Challenges of China’s Petroleum Industry: An Input–Output Analysis. Energy 36 (5), 2905–2911. doi:10.1016/j.energy.2011.02.033
Yang, Z., Abbas, Q., Hanif, I., Alharthi, M., Taghizadeh-Hesary, F., Aziz, B., et al. (2021). Short- and Long-Run Influence of Energy Utilization and Economic Growth on Carbon Discharge in Emerging SREB Economies. Renew. Energy 165, 43–51. doi:10.1016/j.renene.2020.10.141
Yoo, S.-H., and Yang, C.-Y. (1999). Role of Water Utility in the Korean National Economy. Int. J. Water Resour. Dev. 15, 527–541. doi:10.1080/07900629948745
Yoo, S.-H., and Yoo, T.-H. (2009). The Role of the Nuclear Power Generation in the Korean National Economy: An Input-Output Analysis. Prog. Nucl. Energy 51, 86–92. doi:10.1016/j.pnucene.2007.12.001
Keywords: input-output analysis, mining industry, economic impacts, China, national economy
Citation: Zhang B, Yao J and Lee H-J (2022) Economic Impacts and Challenges of Chinese Mining Industry: An Input–Output Analysis. Front. Energy Res. 10:784709. doi: 10.3389/fenrg.2022.784709
Received: 28 September 2021; Accepted: 19 April 2022;
Published: 09 May 2022.
Edited by:
Pu-yan Nie, Guangdong University of Finance and Economics, ChinaReviewed by:
Abdul Rehman, Henan Agricultural University, ChinaMuhammad Mohsin, Jiangsu University, China
Copyright © 2022 Zhang, Yao and Lee. This is an open-access article distributed under the terms of the Creative Commons Attribution License (CC BY). The use, distribution or reproduction in other forums is permitted, provided the original author(s) and the copyright owner(s) are credited and that the original publication in this journal is cited, in accordance with accepted academic practice. No use, distribution or reproduction is permitted which does not comply with these terms.
*Correspondence: Hyuck-Jin Lee, bGhqQHNlam9uZy5hYy5rcg==