 Martin Colla
 Julien Blondeau
 Hervé Jeanmart
- 1Institute of Mechanics, Materials and Civil Engineering, Université Catholique de Louvain, Louvain-la-Neuve, Belgium
- 2Thermo and Fluid Dynamics (FLOW), Brussels Institute for Thermal-Fluid Systems and Clean Energy (BRITE), Vrije Universiteit Brussel (VUB) and Université Libre de Bruxelles (ULB), Brussels, Belgium
Biomass is a key renewable resource for energy transition and climate change mitigation. It can be used for either energy purposes (production of heat, electricity, and fuel) or non-energy demand (e.g., chemicals). This raises the question of the optimal use of biomass in energy systems. In the literature, this optimal use is often determined for one specific situation in terms of greenhouse gas emissions and rarely considering the non-energy demand. The non-energy demand is defined as the demand for energy products used as raw materials. Given the expected simultaneous changes in all industrial sectors, it is important to include the non-energy demand in the models of energy systems as they will share common resources. This paper 1) studies the optimal use of lignocellulosic biomass within an energy system including the non-energy demand and 2) analyzes the evolution of its role throughout the energy transition. Belgium is taken as a case study as it presents a non-energy demand corresponding to ∼15% of its primary energy mix. The energy system is modeled with EnergyScope TD which optimizes whole-energy systems in terms of costs under greenhouse gas emission constraints. Local and imported biomass is considered with two potential scenarios. Fourteen biomass-converting technologies are included in the model. It is shown that high-temperature heat remains a significant application for biomass in all scenarios and increases when moving toward carbon neutrality. For greenhouse gas savings below 50%, biomass is largely used for low-temperature heat. However, when aiming at reducing greenhouse gas further (>50% reduction), biomass is substantially exploited for the non-energy demand. Electricity from biomass also appears, to a lesser extent, for large greenhouse gas savings only. The integration of the non-energy demand in the simulations impacts the allocation of biomass in the system, depending on the scenario of potential considered.
1 Introduction
In the context of the energy transition and climate change mitigation, biomass is a key player as a renewable and versatile resource for energy production. The global potential of biomass for energy purposes is significant. However, the expected contributions vary considerably depending on the assumptions and constraints considered. Focusing on sustainable resources, it is estimated that bioenergy could be provided globally between 126 EJ and 216 EJ in 2050 (Beringer et al., 2011). This range is roughly in line with other publications that estimate the potential considering different constraints (sustainability, technical, economic, etc.) (Haberl et al., 2010; Schueler et al., 2013; Berndes et al., 2015; Searle and Malins, 2015; Strapasson et al., 2017; IEA Bioenergy, 2020).
Biomass has always been the main renewable energy source in the world: about 56 EJ, that is, ∼10% of the world primary energy in 2018 (World Bioenergy Association, 2020). It accounted for about 67% of primary renewable energy supply in 2018 (including traditional biomass use) and is used mainly for heat purposes (IEA, 2020; World Bioenergy Association, 2020). Those trends are also true at the European and at the Belgian scale (Bioenergy Europe, 2019). However, although heat is currently, by far, the most important end-use of biomass, this could change in the future due to the need to de-fossilize all sectors. An increase in the share of biomass used for alternative applications could be observed. Indeed, it can also be used for the production of transport fuels, electricity, or chemicals (WWF, 2011; Daioglou et al., 2015; IEA, 2017). Therefore, given its finite potential, the question of the optimal use of this renewable resource in energy systems arises.
In the literature, the optimal use of biomass is often determined for a single specific situation and without considering the non-energy demand (NED) (Steubing et al., 2012; Fazlollahi and Maréchal, 2013; Kwon and Østergaard, 2013; Bentsen et al., 2014; Gironès et al., 2016; Vadenbo et al., 2017; Jordan et al., 2019; Jåstad et al., 2020). The NED is defined as the demand for energy products used as raw materials (and therefore not consumed as fuel), i.e., mainly for the production of plastics, chemicals, or fertilizers (Eurostat, 2019). The use of wood as material (e.g., construction or paper) is currently not included in this definition. Steubing et al. (2012) analyzed the optimal use of biomass in the EU without any specific target on the greenhouse gas (GHG) emissions, without considering the NED and considering biomass as the only alternative to fossil fuel technologies. They showed that biomass would be best used for heat in CHP in terms of environmental impact (including GHG emissions). Gironès et al. (2016) assessed the optimal use of 5,000 GWh of wood in the Swiss energy system without considering the NED. They analyzed the impacts on costs and GHG emissions of different uses of biomass (all the biomass potential being used in a single pathway). Their reference scenario is the situation where 5,000 GWh of wood will be used in boilers and for a Swiss energy system in 2035, achieving a GHG reduction of ∼47% compared to that in 2015. Their results showed that the wood would be best used to produce synthetic natural gas (SNG) through gasification and methanation with an electrolyzer for producing electricity in an advanced combined heat and power (CHP) plant, with the integration of electric vehicles. Vadenbo et al. (2017) showed that heat production would be the best application for woody biomass resources in the Danish energy system in 2025 in terms of environmental impact, including, but not restricted to, GHG emissions. The NED was not included in the study, and no specific GHG emission constraint was considered.
Only a few studies have included the NED in the study of biomass optimal use (Daioglou et al., 2015; Tsiropoulos et al., 2017). Daioglou et al. (2015) studied the competing uses of biomass worldwide for 2050 and 2100. They included chemical production but without the constraint of reaching carbon neutrality in the long term. They compared different scenarios based on GHG savings and highlighted the importance of bioenergy for transportation and electricity, due to the current large use of coal. However, due to the global scale of their study, these trends are not valid for all countries as they depend on the specific national energy system. Tsiropoulos et al. (2017) studied the Dutch energy system including the non-energy demand and related biomass technologies. They focused their results on 2030 political targets. They showed that, regarding those targets, biomass could significantly contribute to the heat and transport sectors, while its future use in the non-energy sector strongly depends on technological progress. However, they did not consider simulations forcing the GHG emission reduction beyond the political objectives for 2030. Hence, neither study allows conclusions to be drawn on the role of biomass (including the NED) when aiming for large GHG savings (close to carbon neutrality).
Therefore, it appears that the optimal use of biomass is most of the time studied for one specific situation generally without constraints on the global GHG emissions and rarely considering the NED. Thus, we propose here to analyze the evolution of the optimal use of biomass toward carbon neutrality taking into account the NED. The GHG savings constraints might indeed reduce the number of alternatives for some final needs (e.g., chemicals) and thus induce a shift of biomass use from one sector to another. With time, the NED will also emerge as an additional competing application for biomass resources. Hence, the objectives of this paper are 1) studying the optimal use of lignocellulosic biomass within an energy system including the non-energy demand and 2) analyzing the evolution of its role during the transition toward carbon neutrality. Those analyses are performed using the open-source model EnergyScope TD (Limpens et al., 2019). Belgium is taken as a case study as it presents a significant NED, corresponding to around 20% of its final energy consumption (FPS Economy, 2021). Moreover, Belgium presents a limited potential for endogenous renewable energy when compared to its final energy needs (31.4%) (Limpens et al., 2020b). Energy carriers will therefore have to be imported, and biomass is one of the options to be studied.
2 Materials and Methods
In this section, the different elements needed for the simulations are developed. First, the model is briefly explained. Then, the focus is put on the biomass feedstock specifications and the different technologies of conversion. Finally, a summary of the simulation conditions is presented.
2.1 EnergyScope TD Model
The energy system is modeled with EnergyScope TD (ESTD) which optimizes whole-energy systems in terms of costs under GHG emission constraints. As stated in Limpens et al. (2019), where the authors present exhaustively the model, ESTD is “a novel open-source model for the strategic energy planning of urban and regional energy systems.” “EnergyScope TD optimises both the investment and operating strategy of an entire energy system (including electricity, heating and mobility). Additionally, its hourly resolution (using typical days) makes the model suitable for the integration of intermittent renewables” (Limpens et al., 2019). The sensitivity analysis of the model applied to the Belgian energy system can be found in the study of Limpens et al. (2020a).
In this paper, the model applied to the Belgian energy system as presented by Limpens et al. (2020) is used as a starting point. Twenty-four different resources are modeled as well as more than 96 technologies of conversion to supply end-use demands: electricity, heat (low and high temperatures), mobility (pubic, private, and freight), and non-energy demand. The NED is therefore included in ESTD, which allows its study in the framework of energy system modeling. The consumption figures for the Belgian case study are directly taken from Capros et al. (2016). 2035 is the year of study as it constitutes an important milestone for energy transition, halfway to 2050 and its carbon neutrality goal, similarly to Limpens et al. (2020). For the GHG emission comparisons, 2015 is taken as the reference year. The quantification of greenhouse gas (GHG) emissions for 2015 is based on the estimations from Limpens et al. (2020) with the addition of all emissions linked to the NED feedstock. It means that 100% of the carbon content of the NED inputs is included in the GHG emission. In practice, part of the carbon content might be stored within the final products. This might lead to the overestimation of GHG emissions (conservative methodology). However, this carbon within the final products will sooner or later be released (Neelis et al., 2005). Therefore, for the snapshot simulations carried out in this study, it is easier to take all the GHG emissions related to the NED into account directly at the production stage to avoid losing track of them.
The Belgian NED is currently supplied entirely by fossil fuels (petroleum products and natural gas mainly) for the chemicals and petrochemicals mostly. Therefore, an additional constraint was added in the model regarding the non-energy demand: it specifies that 15.8% of the NED has to be supplied in the form of (synthetic) natural gas and the rest, 84.2%, in the form of light fuel oil (LFO) to be representative of the fuel share of 2019 (coal disregarded) (FPS Economy, 2021). The LFO can be imported as such or produced from synthetic liquid fuel (SLF). The price of LFO has been equated with naphtha price (the main feedstock in the NED in Belgium (FPS Economy, 2021) and taken from Tsiropoulos et al. (2017)). In the current paper, we added several technologies able to produce SLF from biomass (cf. Section 2.3), thus usable in the NED or mobility needs. This modeling approach for the NED remains simple, yet it allows representing the main trends of the overall energy system. In reality, the different energy carriers will undergo processing to produce the final desired molecules (e.g., ethylene, propylene, and ammonia) (Sharifzadeh et al., 2015; Spallina et al., 2017).
Imports of different energy carriers are allowed (hydrogen, bioethanol, biodiesel, synthetic natural gas, synthetic liquid fuel) as modeled by Limpens et al. (2020), using a single high price. This approach could be further developed by integrating specifications on the availability and price of each energy carrier according to its origin and properties. In this work, this was implemented for biomass feedstock only (Section 2.2) as this was the main focus of the study. Imports of electricity are allowed but capped to 30% of the annual electricity needs and constrained by connecting capacity, around 10 GW available simultaneously in 2035 based on Elia (2017). The estimated carbon footprint of this electricity in 2035 is 206 kgCO2eq/MWh. This value results from linear interpolation between the average EU electricity mix in 2015 and 0 kgCO2eq/kWh assumed to be achieved in 2050 according to political agendas (European Commission, 2020).
In this work, we developed the lignocellulosic biomass pathways in EnergyScope TD by adding imports of lignocellulosic biomass with distinction in terms of origin and quality (translated into different quantities, prices, and carbon footprints) as developed in Section 2.2. Furthermore, we added eight biomass-converting technologies, raising the total number of lignocellulosic biomass–converting technologies in the model to 14 (Section 2.3).
2.2 Feedstock
This section presents the supply curves for biomass feedstock implemented in ESTD (Figure 1). The focus of this study is on lignocellulosic feedstock as it represents the main part of the global potential (IEA Bioenergy, 2020). It usually induces lower stress on food commodities (Bhutto et al., 2015) and is one of the cheapest biomass feedstock (Ruiz et al., 2015), and there are various possibilities of conversion routes (Sharma et al., 2013) for different final uses, depending on the energy requirements of the system. In this study, two feedstock scenarios are considered: 1) Ref. scenario, based on the reference potential scenario from the ENSPRESO database, and 2) High scenario, based on the high potential scenario from the ENSPRESO database (Ruiz et al., 2019), as illustrated in Figure 1 and Table 1.
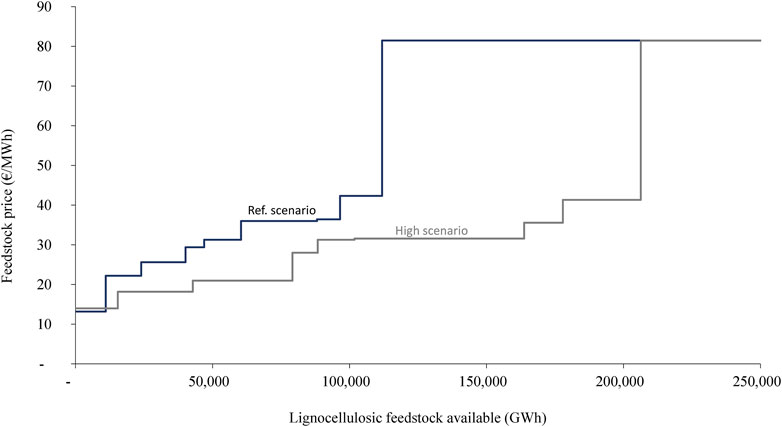
FIGURE 1. Cost supply curves of the lignocellulosic feedstock considered available for Belgium for the reference and high potential scenarios.

TABLE 1. Distribution of the lignocellulosic feedstock by origin and quality categories (in GWh) for the reference and high potential scenarios.
For all European countries (EU28 plus Norway, Iceland, Switzerland, and Western Balkans countries), data on the potential resources are taken from the ENSPRESO database (Ruiz et al., 2019). This database presents the biomass potential considering different feedstock categories at the country level for different target years with three main scenarios of availability. The lignocellulosic biomass considered here consists of products from forestry, agricultural residues, short rotation coppice, lignocellulosic energy crops, landscape care, and other solid bio-waste. For the landscape care and other solid biodegradable waste, only local (Belgian) potentials are included: no imports of those categories are allowed due to the complex and costly supply chain of this low-quality resource. The reference scenario potential based on ENSPRESO data (Ruiz et al., 2019) (∼12 EJ available in 2050 for the EU) is in the lower range of potential estimations (9–25 EJ/year) (Mandley et al., 2020). Thus, two scenarios regarding the EU potential were used in this work based on reference and high ENSPRESO potentials. For the import of lignocellulosic feedstock from the rest of the world (RoW), the value is derived from the imported solid biomass estimated in WWF (2011) for the EU. As their optimistic scenario presents a potential almost 10 times higher (Duscha et al., 2014), their conservative scenario was considered here (cf. category named “Rest of the world I.” in the analyses). The proportion of EU biomass potential considered available for Belgium was based on the GDP ratios of EU countries for 2035 (GDP data from Capros et al. (2016)), as it was shown that GDP is positively correlated with bioenergy import demand (Alsaleh et al., 2017).
The cost of the lignocellulosic biomass includes the cost of the feedstock, the processing, and the transportation. The pre-treatment step was added when not already considered in the references, considering briquetting with the energy efficiency retrieved from Murphy et al. (2013) (∼89%) and the costs reported by Perrin et al. (2017) (42.2€/t). The transport cost to Belgium was added based on average costs for pellets, chips, and logs available in the study of Suurs (2002), considering a mix between truck, ship, and train depending on the distance. The average distances considered were 500, 2,500, and 10,000 km for imports from neighboring countries, other EU countries, and rest of the world, respectively.
In addition, one last feedstock category was added representing other possible imports from the RoW. This artificial category is characterized by an unlimited availability and a very high price, conservatively fixed at twice the price of the most expensive pellets from Lamers et al. (2015): 81.5€/MWh. This will serve to analyze if biomass could be useful even with a high price and to establish what purposes drive the demand for this feedstock. This category is referred to as “Rest of the world II.” in the analyses. The evolution of feedstock availability and prices is illustrated in the supply curves of Figure 1.
Finally, the carbon footprint and the quality of the feedstock were also considered. For the carbon footprint, each feedstock category presents specific embedded GHG emissions derived from the European directive on renewable energy (RED II) (European Parliament, 2018). The carbon footprints take into account the different distances and feedstock considered (cf. Table 2). For the quality of the feedstock, the overall potential was differentiated into two different quality classes (cf. Table 1). The first one is considered the good quality one and gathers all the feedstock from forest/wood (primary products, primary residues, and residues from the forest industry). The second one is composed of the different energy crops, short rotation coppices, agricultural residues, landscape care (only local potential), and other solid biodegradable waste (only local potential). This second category is considered lower quality feedstock (low-quality category in Table 1) because it usually presents physical and chemical properties (e.g., low grindability, high ash content, and high alkali metal content) that affect the conversion processes and reduce their energy efficiency (Carroll and Finnan, 2012; Li et al., 2016). For this reason, an additional constraint was implemented in the model to limit the relative share of lower quality feedstock used. This proportion was based on the ash content of the feedstock to keep an average ash content lower than 3%, given by Elbersen et al. (2015) as the limit for a desirable feedstock for thermochemical conversion. Using wood and wheat straw as representative resources for both quality categories, and considering their properties reported by Carroll and Finnan (2012), the maximum share of low-quality biomass was set to 40% (on a mass basis).
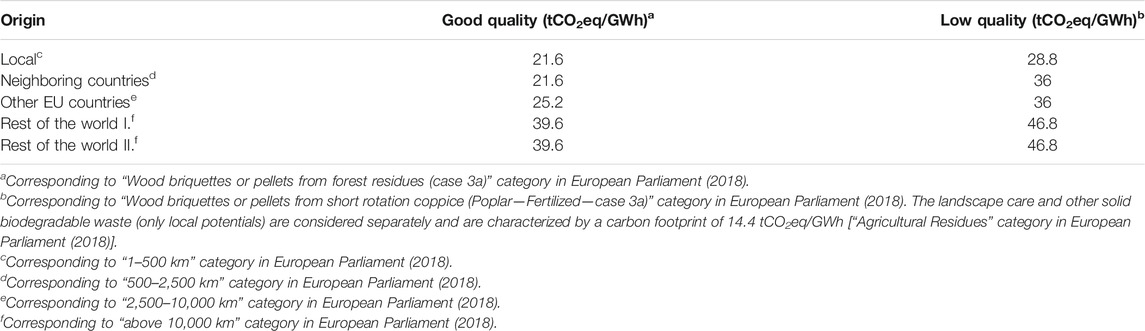
TABLE 2. Carbon footprint of the different lignocellulosic biomass by category (in tCO2eq/GWh).
2.3 Technologies
A range of technologies (14) were selected and implemented in the model to represent the different lignocellulosic biomass conversion routes (Figure 2). The purpose of this paper is not to compare different technologies producing similar output but rather to highlight overall trends in the use of biomass feedstock in terms of the final end-uses.
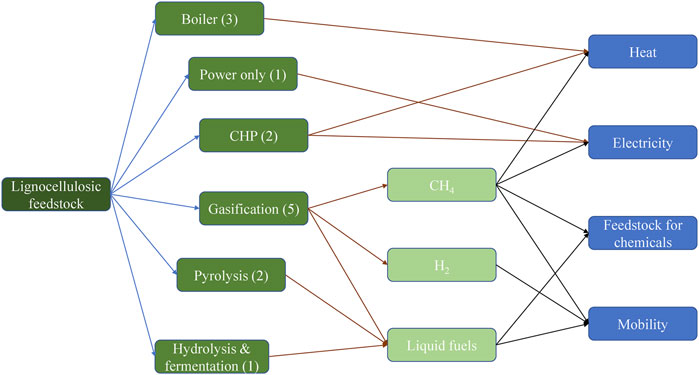
FIGURE 2. Schematic representation of the lignocellulosic biomass technologies considered with the figures in brackets representing the number of different technologies considered within a category.
In Figure 2, each box can contain different technologies that are integrated separately in the model. The number of technologies considered by category is mentioned in brackets, e.g., three different technologies for boilers: decentralized, district heating, or industrial. Additionally, the potential post-treatment processes are not explicitly represented in Figure 2 (upgrading, Fischer–Tropsch, etc.). The technologies with a low readiness status (lab and prototype steps) were not considered (e.g., hydrothermal liquefaction) (IEA, 2017). The technologies are modeled with their costs, lifetime, and (energy) efficiency (detailed in Supplementary Table SA1). Therefore, any technology using a different process but producing similar output with similar costs and efficiency could be assimilated to the process considered in the model.
2.4 EnergyScope TD Simulations
Once the biomass supply curves and the converting technologies are implemented in ESTD, the simulations can be run for the two scenarios (Ref. and high potentials). Among the available resources and technologies, the model selects the most economical ones to meet end-use demands while respecting the given maximum GHG emission constraint. Simulations are run for different GHG emission constraints, from no constraint to −90% of GHG emission compared with 2015, in steps of 10%. Through the different simulations, we can analyze to what extent and for which end-uses lignocellulosic biomass is used. Furthermore, we can study the impacts on biomass use of 1) the different GHG emission constraints, 2) the biomass availability and prices, and 3) the inclusion of the NED in modeling.
3 Results and Discussion
This section presents and discusses the different results of the study regarding the optimal role of biomass and its evolution within the Belgian energy system, with non-energy demand included. The overall energy system and the role of biomass in the primary energy mix are first discussed. Afterward, the focus is on the biomass role regarding final needs and its evolution throughout the energy transition. Finally, the impact of integrating the NED as part of the energy system is discussed for simulations with high GHG savings (90%).
3.1 Optimal Energy Mix and Its Evolution
Figure 3 shows the general results of the simulations regarding primary energy, for the study case (Belgian energy system in 2035), and GHG emission reductions between 40% and 90%, for both the reference and high potential scenarios. The simulations without any constraint on the GHG emissions already result in a GHG emission reduction of around 40% when compared to that in 2015, i.e., 38% and 40% for the reference and high scenarios, respectively. This is explained by the fact that EnergyScope TD optimizes the energy system without considering the historical energy system in place (i.e., it represents new, optimal energy systems built from scratch). Thus, the purely economic optimum of the energy system in 2035 already results in significant GHG emission reductions compared to that in 2015.
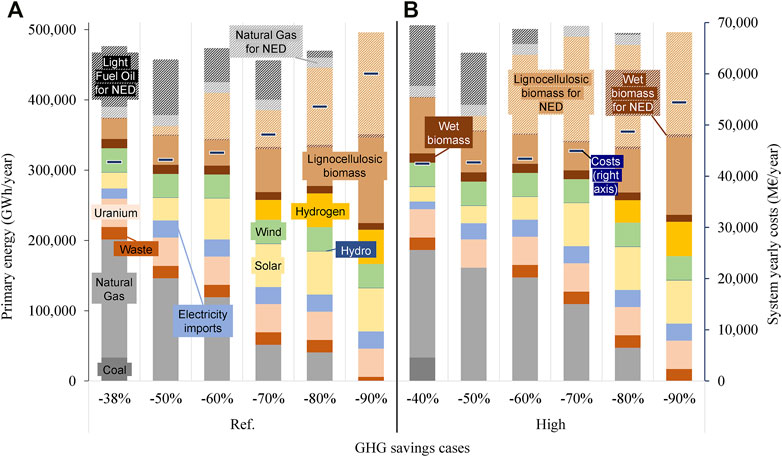
FIGURE 3. Primary energy use by fuels for the different GHG savings cases (compared to 2015) and associated costs of the energy system for the reference (A) and high (B) potential scenarios (NED, non-energy demand).
Lignocellulosic biomass represents 6% or 16% of the primary energy sources for the lowest GHG savings, for the reference or high scenario, respectively. Compared with the case in 2015 from Limpens et al. (2020), this represents a multiplication of the use of lignocellulosic biomass by 1.7 or 4.8 for the reference or high scenario, respectively. This shows that biomass is already a useful resource in the short term for energy systems even if only economic factors are considered. Moreover, it allows GHG savings compared with the current situation. Additionally, it is clear from Figure 3 that the high potential scenario reduces the cost of the system due to the higher availability of affordable biomass in the EU, highlighting the impact of resource prices on the overall costs.
Fossil fuel resources (coal, LFO, and natural gas) are progressively phased out when increasing GHG constraints. The coal, used in high-temperature (HT) heat, disappears rapidly from the mix when moving toward higher GHG savings (Figure 3). The NED is first supplied by LFO and NG, as it is currently the case today, but it is progressively replaced by biomass when increasing GHG savings targets (Figure 3). This shift explains the increase of primary energy between the simulations due to pyrolysis efficiency to produce the liquid fuels (i.e., 58%) while before the LFO was imported and directly used in the NED (i.e., efficiency of 100%). Conversely, some changes lead to a reduction of the system primary energy, e.g., the shift for low-temperature heat from biomass to electrical heat pumps (at simulations for GHG savings of 50%).
For GHG savings of 90%, no more fossil fuels are used and lignocellulosic biomass provides more than half of the primary energy for the system, for the two scenarios (Figure 3). Both the reference and high potential scenarios present very similar results for GHG savings of 90% in the primary mix (Figure 3) and the repartition of biomass uses (Figure 4). The main difference is the origin of the feedstock used (cf. Figure 5). From 80 to 90% GHG savings, biomass used is multiplied by 1.6 for the reference scenario and the increase is fully covered by the most expensive category of imports (Figure 5). All this shows that biomass is even more useful when it comes to reaching high GHG savings (no fossil fuels allowed).
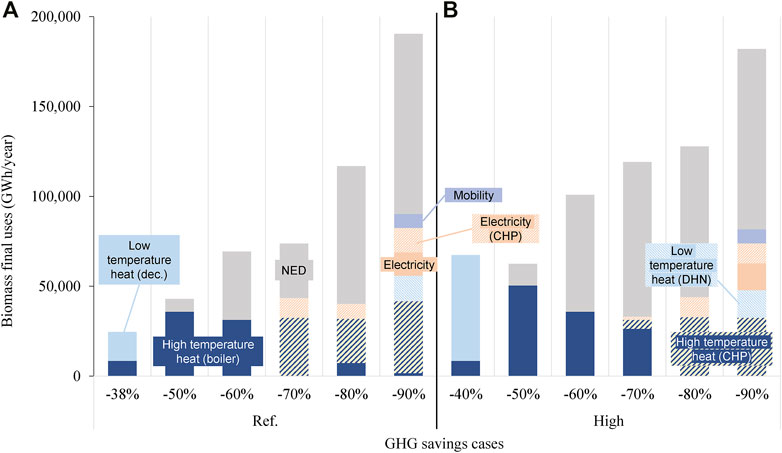
FIGURE 4. Lignocellulosic biomass optimal final use evolution with GHG savings cases for the reference (A) and high (B) potential scenarios (CHP, combined heat and power; dec., decentralized; DHN, district heating network; NED, non-energy demand).
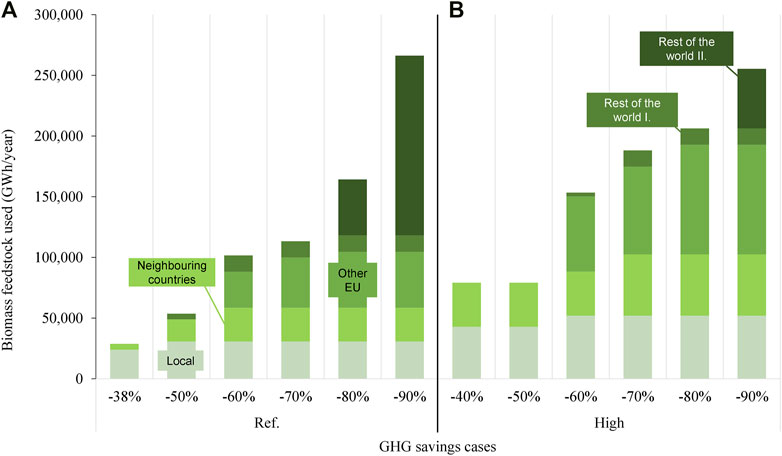
FIGURE 5. Lignocellulosic biomass feedstock used divided by origin for the different GHG savings cases, for the reference (A) and high (B) potential scenarios.
In the next section, we will analyze more precisely the roles of biomass from low to high GHG savings.
3.2 Optimal Use of Biomass and Its Evolution
Figure 4 focuses on the various uses of biomass in the optimized scenarios, while Figure 5 illustrates the origin of the selected biomass resources. For GHG savings of around 40%, low-temperature heat is a significant use of biomass (cf. Figure 4) with the cheapest biomass feedstock: the local and neighboring country categories (cf. Figure 5). However, this final use disappears for higher GHG savings. This is explained by two main reasons: 1) biomass will be requested for other purposes with fewer low-carbon alternatives and 2) heat pumps will be preferred for low-temperature heat with high penetration of intermittent renewables—synergies with thermal storage, and this was also concluded by Limpens et al. (2020). Thus, when moving to larger GHG savings, biomass will be used for other final services such as high-temperature (HT) heat, chemical feedstock for the NED, or mobility. The HT heat is the first to come to replace coal (cf. “−50%” simulations in Figure 3), as this is the most carbon-intensive resource. For even larger GHG savings, HT heat remains an important application, but a shift in the technology can be observed: from industrial boilers to CHP units (cf. Figure 4). CHP plants are favored to increase renewable electricity production when solar PV and wind have reached their full potential (>60% GHG savings). The choice between the boiler and the CHP plant also depends on the availability of affordable biomass compared to the HT heat needed. The HT heat is indeed the major use of biomass for large GHG savings, as it is the cheapest renewable source for this application (due to relatively low feedstock costs and high maturity of the technology with high efficiency). Therefore, CHP plants are used when a large quantity of affordable biomass is available as this will supply two different final needs. However, if this quantity is limited compared to the final needs, then boilers would be preferred to maximize the production of HT heat per unit of biomass.
When increasing the GHG savings further (60–70%), the light fuel oil used in the NED is progressively replaced by biomass as shown in Figure 3. When considering the high potential scenario, this shift happens already for smaller GHG savings (∼60% of savings—cf. Figure 3), due to the higher availability of biomass at a lower price (cf. Figure 1). For 90% GHG savings, the NED requires 54% or 57% of the biomass used by the system (for the reference and high scenarios, respectively). This shows that, for high GHG savings, the NED heavily relies on biomass and drives the need for import even with a high price.
For GHG savings of 90% when natural gas is not allowed anymore in the system, biomass is used to produce synthetic natural gas that will supply the NED (and the freight mobility), with district heat as a co-product during the gasification process as presented by the Danish Energy Agency and Energinet (2017) (cf. Figures 4, 6). Additionally, biomass is also used to produce electricity. Dispatchable electricity is an important need for high GHG savings to complete the electricity balance. Biomass for electricity is mainly produced from plants producing only electricity but also with combined heat and power (CHP) plants. CHP plants, in the reference scenario for 90% GHG savings, present a load factor of 79% and are assumed to be flexible according to the grid need. This specific aspect would need further research to assess the potential contribution of biomass-fired CHP plants to the stability of the grid.
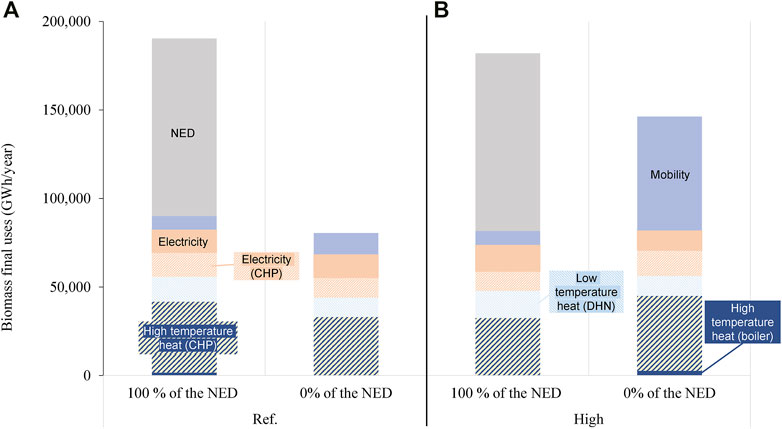
FIGURE 6. Lignocellulosic biomass optimal uses with and without non-energy demand (NED) for cases with GHG savings of 90%, for the reference (A) and high (B) potential scenarios (CHP, combined heat and power; dec., decentralized; DHN, district heating network; NED, non-energy demand).
Biomass imports are key in the energy balance of Belgium in the simulations. Indeed, when considering 90% GHG savings, local resources, respectively, represent only 12% or 20% for reference or high scenario (Figure 5). The high potential scenario is using (slightly) less biomass than the reference scenario for GHG savings of 90% because the average carbon footprint of the biomass used is lower (due to higher availability of EU biomass) and thus still allows waste to be used for HT heat production. The high potential scenario highlights that the EU could supply up to 76% of the biomass requirements for Belgium when considering 90% of GHG savings, while for the reference scenario, this proportion is reduced to 39%. The artificial category “Rest of the world II.,” with unlimited availability but with a price around twice as high as the second most expensive biomass category, is used in both scenarios for high GHG savings: larger than 70 and 80% for the reference and high availability scenarios, respectively (cf. Figure 5). This shows that lignocellulosic biomass will be required for intensive decarbonization of the Belgium energy system and the NED applications, even if it is available at a very high price.
3.3 Non-Energy Demand Variation for 90% GHG Savings
Figures 6, 7 show the impact of the NED on the use and the origin of biomass for GHG savings of 90%, for both the reference and high potential scenarios. When the non-energy demand is not considered as part of the system (as in many studies), the use of biomass is divided by a factor of 2.5 and 1.4 for the reference and high scenarios, respectively (cf. Figure 7). Indeed, the system avoids importing the most expensive category of biomass (“Rest of the world II.”) which is only relevant when the non-energy demand applications need to be decarbonized, for which there are few low-carbon alternatives: only the very expensive synthetic natural gas (SNG) or synthetic liquid fuel (SLF). On the one hand, for the reference scenario, the other uses of biomass are kept relatively constant: HT heat, electricity, and a small part of mobility through SNG. On the other hand, when the NED is removed from the high potential scenario simulations, the quantity of biomass used is less impacted due to greater availability of affordable biomass which allows for the apparition of new uses as diesel production (through pyrolysis and upgrade) for freight mobility (cf. Figure 6). This highlights the impact of integrating the NED in the study: it influences the optimal system, its related costs, and the uses of available biomass. Moreover, it shows that biomass could play a major role in NED decarbonization, even with high prices as it is this final need that drives the imports of the most expensive biomass category (Figure 7).
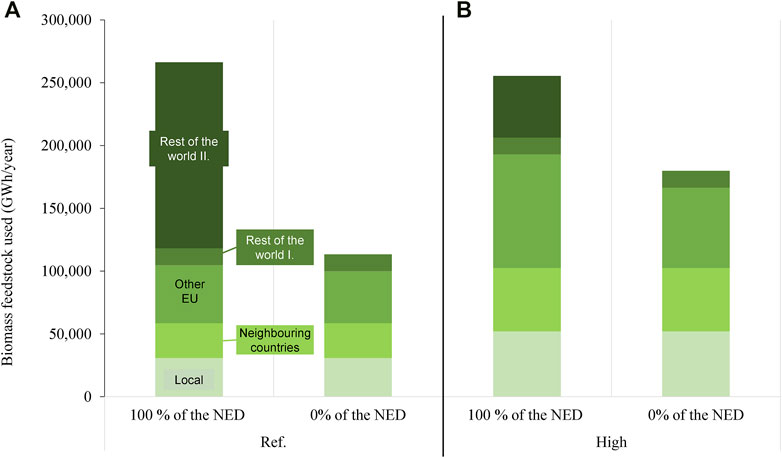
FIGURE 7. Lignocellulosic biomass feedstock used divided by origin with and without the non-energy demand (NED) for cases with GHG savings of 90%, for the reference (A) and high (B) potential scenarios.
3.4 Further Work and Perspectives
The model EnergyScope TD (ESTD) maximizes the economic benefit while respecting the system constraints (GHG emissions and hourly final need). Therefore, the prioritization of biomass depends on the costs of the alternatives for the same final service. Thus, it could be a weakness of the model if some alternatives are not integrated or if the prices are over (or under) estimated. For example, some other energy carriers that could also be imported (i.e., SLF, SNG, bioethanol, biodiesel, or hydrogen) are modeled in ESTD with one single and high price. Those prices may require nuances and specifications that depend on the origin and production routes as developed in this work for the lignocellulosic biomass. Additionally, the non-energy demand (NED) implementation could be improved. So far, the final need is evaluated in terms of equivalent energy requirement, while in the future, new processes to produce similar final molecules might appear depending on the energy carrier used (e.g., biomass, methanol, or hydrogen). Therefore, it would be interesting to develop this NED by modeling the final molecules required and their associated production processes with different types of feedstock. This would allow the model to choose the best path(s) to produce the final molecules included in the NED. Finally, the specific supply chains of the biomass feedstock should be studied to better characterize each biomass flow and discuss the impact on the global biomass market.
4 Conclusion
This paper discusses the optimal use of lignocellulosic biomass in energy systems including the non-energy demand (NED) and considers its evolution toward carbon neutrality. This has been done by using EnergyScope TD for the study case of the Belgian energy system in 2035. New converting technologies and additional resources of lignocellulosic biomass were added, considering imports of resources with different availabilities, qualities, prices, and carbon footprints. First, the simulations precisely highlight the versatility of biomass. It can contribute to the production of heat, power, fuels, and chemicals while leading to significant GHG savings. Furthermore, it is shown that low-temperature heat is the cheapest use of biomass and that it already allows for GHG savings. However, when targeting higher GHG savings, the biomass will be requested for other uses with fewer low-carbon alternatives. This study indicates that high-temperature heat remains a significant application for biomass in all simulations. Moreover, this biomass final use increases when moving to higher GHG savings, with a technological shift from boilers to CHP units. These results can have an impact on future decisions for industrial investments: an early investment in CHP units could be preferable to a later technological shift. Additionally, this study demonstrates that heat is far from being the only application of interest for biomass as long as a sufficient amount of affordable biomass is available. Indeed, for large GHG savings, the non-energy demand would require a significant amount of biomass as only a few low-carbon alternatives exist to supply this need. It is shown that considering the NED in the analysis significantly impacts the allocation of biomass in the system depending on the assumptions of biomass availability. Moreover, electricity production from biomass is also, to a lesser extent, an important use for the energy system for high GHG savings cases. Dedicated electricity production biomass units are used only for very large GHG savings, once no (or little) natural gas is allowed in the system. Biomass-fired CHP units could, as for them, play a significant role in the support of the electrical grid already for lower GHG savings. Finally, the study underscores that biomass imports are key for the Belgian energy transition. The availability of affordable and sustainable biomass feedstock has indeed a strong influence on the cost of the optimal system.
Data Availability Statement
The original contributions presented in the study are included in the article/Supplementary Material, and further inquiries can be directed to the corresponding author.
Author Contributions
MC, JB, and HJ were involved in conceptualization, performing the methodology, data analysis, and reviewing the paper. MC collected the data, performed the simulations, discussed the results, wrote the original draft, and edited the paper. JB and HJ supervised the project.
Funding
This study was funded by the Energy Transition Fund of Belgium. This support is gratefully acknowledged.
Conflict of Interest
The authors declare that the research was conducted in the absence of any commercial or financial relationships that could be construed as a potential conflict of interest.
Publisher’s Note
All claims expressed in this article are solely those of the authors and do not necessarily represent those of their affiliated organizations, or those of the publisher, the editors, and the reviewers. Any product that may be evaluated in this article, or claim that may be made by its manufacturer, is not guaranteed or endorsed by the publisher.
Supplementary Material
The Supplementary Material for this article can be found online at: https://www.frontiersin.org/articles/10.3389/fenrg.2022.802327/full#supplementary-material
References
Alsaleh, M., Abdul-Rahim, A. S., and Mohd-Shahwahid, H. O. (2017). An Empirical and Forecasting Analysis of the Bioenergy Market in the EU28 Region: Evidence from a Panel Data Simultaneous Equation Model. Renew. Sust. Energ. Rev. 80, 1123–1137. doi:10.1016/j.rser.2017.05.167
Bentsen, N. S., Jack, M. W., Felby, C., and Thorsen, B. J. (2014). Allocation of Biomass Resources for Minimising Energy System Greenhouse Gas Emissions. Energy 69, 506–515. doi:10.1016/j.energy.2014.03.045
Beringer, T., Lucht, W., and Schaphoff, S. (2011, Bioenergy Production Potential of Global Biomass Plantations under Environmental and Agricultural Constraints, 3). 299–312. doi:10.1111/j.1757-1707.2010.01088.x
Bhutto, A. W., Harijan, K., Qureshi, K., Bazmi, A. A., and Bahadori, A. (2015). Perspectives for the Production of Ethanol from Lignocellulosic Feedstock A Case Study. J. Clean. Prod. 95, 184–193. doi:10.1016/j.jclepro.2015.02.091
Capros, P., De Vita, A., Tasios, N., Siskos, P., and Kannavou, M. (2016). EU Reference Scenario 2016 Energy, Transport and GHG Emissions Trends to 2050. doi:10.2833/9127
Carroll, J. P., and Finnan, J. (2012). Physical and Chemical Properties of Pellets from Energy Crops and Cereal Straws. Biosyst. Eng. 112, 151–159. doi:10.1016/j.biosystemseng.2012.03.012
Creutzig, F., Ravindranath, N. H., Berndes, G., Bolwig, S., Bright, R., Cherubini, F., et al. (2015). Bioenergy and Climate Change Mitigation: an Assessment. GCB Bioenergy 7, 916–944. doi:10.1111/gcbb.12205
Daioglou, V., Wicke, B., Faaij, A. P. C., and van Vuuren, D. P. (2015). Competing Uses of Biomass for Energy and Chemicals: Implications for Long-Term Global CO2mitigation Potential. GCB Bioenergy 7, 1321–1334. doi:10.1111/gcbb.12228
Duscha, V., Ragwitz, M., and Breitschopf, B. (2014). Employment and Growth Effects of Sustainable Energies in the European Union, 199.
Elbersen, W., Bakker, R., Harmsen, P., Alakangas, E., Annevelink, B., Lenz, K., et al. (2015). S2BIOM Deliverable D2.2 A Selection Method to Match Biomass Types with the Best Conversion Technologies. Wageningen: Professional.
Elia (2017). Electricity Scenarios for Belgium Towards 2050. 152. Available at: https://www.elia.be/∼/media/files/Elia/About-Elia/Studies/20171114_ELIA_4584_AdequacyScenario.pdf.
European Commission (2020). Long-term Low Greenhouse Gas Emission Development Strategy of the EU and its Member States. 1–7. Available at: http://www4.unfccc.int/submissions/INDC/Published Documents/Latvia/1/LV-03-06-EU INDC.pdf.
European Parliament (2018). Directive (EU) 2018/2001 of the European Parliament and of the Council on the Promotion of the Use of Energy from Renewable Sources. Strasbourg: Off. J. Eur. Union, 82–209. Available at: https://eur-lex.europa.eu/legal-content/EN/TXT/PDF/?uri=CELEX:32018L2001&from=EN.
Eurostat (2019). Energy, Transport and Environment Statistics. 2019 edition. Available at: https://ec.europa.eu/eurostat/about/policies/copyright%0Ahttps://ec.europa.eu/eurostat/about/policies/copyright%0Ahttp://assets.dft.gov.uk/statistics/releases/transport-energy-and-environment-statistics-2011/energy-2011.pdf.
Fazlollahi, S., and Maréchal, F. (2013). Multi-objective, Multi-Period Optimization of Biomass Conversion Technologies Using Evolutionary Algorithms and Mixed Integer Linear Programming (MILP). Appl. Therm. Eng. 50, 1504–1513. doi:10.1016/j.applthermaleng.2011.11.035
Gironès, V. C., Moret, S., Peduzzi, E., Nasato, M., and Maréchal, F. (2016). Optimal Use of Biomass in Large-Scale Energy Systems: Insights for Energy Policy. ECOS 2016 - Proc. 29th Int. Conf. Effic. Cost, Optimisation, Simul. Environ. Impact Energ. Syst.
Haberl, H., Beringer, T., Bhattacharya, S. C., Erb, K.-H., and Hoogwijk, M. (2010). The Global Technical Potential of Bio-Energy in 2050 Considering Sustainability Constraints. Curr. Opin. Environ. Sustainability 2, 394–403. doi:10.1016/j.cosust.2010.10.007
IEA (2020). Key World Energy Statistics 2020, 33. Paris: Int. Energy Agency, 4649. Available at: https://webstore.iea.org/download/direct/4035%0Ahttp://data.iea.org/payment/products/103-world-energy-statistics-and-balances-2018-edition-coming-soon.aspx%0Ahttps://www.oecd-ilibrary.org/energy/key-world-energy-statistics-2020_295f00f5-en.
IEA Bioenergy (2020). Roles of Bioenergy in Energy System Pathways towards a “Well-Below-2-Degrees-Celsius (WB2)” World - Workshop Report and Synthesis of Presented Studies.
Jåstad, E. O., Bolkesjø, T. F., Trømborg, E., and Rørstad, P. K. (2020). The Role of Woody Biomass for Reduction of Fossil GHG Emissions in the Future North European Energy Sector. Appl. Energ. 274, 115360. doi:10.1016/j.apenergy.2020.115360
Jordan, M., Lenz, V., Millinger, M., Oehmichen, K., and Thrän, D. (2019). Future Competitive Bioenergy Technologies in the German Heat Sector: Findings from an Economic Optimization Approach. Energy 189, 116194. doi:10.1016/j.energy.2019.116194
Kwon, P. S., and Østergaard, P. A. (2013). Priority Order in Using Biomass Resources - Energy Systems Analyses of Future Scenarios for Denmark. Energy 63, 86–94. doi:10.1016/j.energy.2013.10.005
Lamers, P., Hoefnagels, R., Junginger, M., Hamelinck, C., and Faaij, A. (2015). Global Solid Biomass Trade for Energy by 2020: An Assessment of Potential Import Streams and Supply Costs to North-West Europe under Different Sustainability Constraints. GCB Bioenergy 7, 618–634. doi:10.1111/gcbb.12162
Li, C., Aston, J. E., Lacey, J. A., Thompson, V. S., and Thompson, D. N. (2016). Impact of Feedstock Quality and Variation on Biochemical and Thermochemical Conversion. Renew. Sust. Energ. Rev. 65, 525–536. doi:10.1016/j.rser.2016.06.063
Limpens, G., Coppitters, D., Rixhon, X., and Contino, F. (2020a). The Impact of Uncertainties on the Belgian Energy System : Application of the Polynomial Chaos Expansion to the EnergyScope Model . 1–10.
Limpens, G., Jeanmart, H., and Maréchal, F. (2020b). Belgian Energy Transition: What Are the Options? Energies 13, 1–29. doi:10.3390/en13010261
Limpens, G., Moret, S., Jeanmart, H., and Maréchal, F. (2019). EnergyScope TD: A Novel Open-Source Model for Regional Energy Systems. Appl. Energ. 255, 113729. doi:10.1016/j.apenergy.2019.113729
Mandley, S. J., Daioglou, V., Junginger, H. M., van Vuuren, D. P., and Wicke, B. (2020). EU Bioenergy Development to 2050. Renew. Sust. Energ. Rev. 127, 109858. doi:10.1016/j.rser.2020.109858
Murphy, F., Devlin, G., and McDonnell, K. (2013). Miscanthus Production and Processing in Ireland: An Analysis of Energy Requirements and Environmental Impacts. Renew. Sust. Energ. Rev. 23, 412–420. doi:10.1016/j.rser.2013.01.058
Neelis, M. L., Patel, M., Gielen, D. J., and Blok, K. (2005). Modelling CO2 Emissions from Non-energy Use with the Non-energy Use Emission Accounting Tables (NEAT) Model. Resour. Conservation Recycling 45, 226–250. doi:10.1016/j.resconrec.2005.05.003
Perrin, A., Wohlfahrt, J., Morandi, F., Østergård, H., Flatberg, T., De La Rua, C., et al. (2017). Integrated Design and Sustainable Assessment of Innovative Biomass Supply Chains: A Case-Study on Miscanthus in France. Appl. Energ. 204, 66–77. doi:10.1016/j.apenergy.2017.06.093
Ruiz, P., Nijs, W., Tarvydas, D., Sgobbi, A., Zucker, A., Pilli, R., et al. (2019). ENSPRESO - an Open, EU-28 Wide, Transparent and Coherent Database of Wind, Solar and Biomass Energy Potentials. Energ. Strategy Rev. 26, 100379. doi:10.1016/j.esr.2019.100379
Ruiz, P., Sgobbi, A., Nijs, W., Thiel, C., Dalla Longa, F., Kober, T., et al. (2015). The JRC-EU-TIMES Model. Bioenergy Potentials for EU and Neighbouring Countries. doi:10.2790/39014
Schueler, V., Weddige, U., Beringer, T., Gamba, L., and Lamers, P. (2013). Global Biomass Potentials under Sustainability Restrictions Defined by the European Renewable Energy Directive 2009/28/EC. GCB Bioenergy 5, 652–663. doi:10.1111/gcbb.12036
Searle, S., and Malins, C. (2015). A Reassessment of Global Bioenergy Potential in 2050. GCB Bioenergy 7, 328–336. doi:10.1111/gcbb.12141
Sharifzadeh, M., Wang, L., and Shah, N. (2015). Decarbonisation of Olefin Processes Using Biomass Pyrolysis Oil. Appl. Energ. 149, 404–414. doi:10.1016/j.apenergy.2015.03.081
Sharma, B., Ingalls, R. G., Jones, C. L., and Khanchi, A. (2013). Biomass Supply Chain Design and Analysis: Basis, Overview, Modeling, Challenges, and Future. Renew. Sust. Energ. Rev. 24, 608–627. doi:10.1016/j.rser.2013.03.049
Spallina, V., Velarde, I. C., Jimenez, J. A. M., Godini, H. R., Gallucci, F., and Van Sint Annaland, M. (2017). Techno-economic Assessment of Different Routes for Olefins Production through the Oxidative Coupling of Methane (OCM): Advances in Benchmark Technologies. Energ. Convers. Manage. 154, 244–261. doi:10.1016/j.enconman.2017.10.061
Steubing, B., Zah, R., and Ludwig, C. (2012). Heat, Electricity, or Transportation? the Optimal Use of Residual and Waste Biomass in Europe from an Environmental Perspective. Environ. Sci. Technol. 46, 164–171. doi:10.1021/es202154k
Strapasson, A., Woods, J., Chum, H., Kalas, N., Shah, N., and Rosillo-Calle, F. (2017). On the Global Limits of Bioenergy and Land Use for Climate Change Mitigation. GCB Bioenergy 9, 1721–1735. doi:10.1111/gcbb.12456
Suurs, R. (2002). Long Distance Bioenergy Logistics. An Assessment of Costs and Energy Consumption for Various Biomass Energy Transport Chains.
Tsiropoulos, I., Hoefnagels, R., Jong, S. de., van den Broek, M., Patel, M., and Faaij, A. (2017). Emerging Bioeconomy Sectors in Energy Systems Modeling – Integrated Systems Analysis of Electricity, Heat, Road Transport, Aviation, and Chemicals: a Case Study for the Netherlands. Biofuels, Bioprod. Biorefining 6, 246–256. doi:10.1002/bbb
Vadenbo, C., Tonini, D., and Astrup, T. F. (2017). Environmental Multiobjective Optimization of the Use of Biomass Resources for Energy. Environ. Sci. Technol. 51, 3575–3583. doi:10.1021/acs.est.6b06480
World Bioenergy Association (2020). GLOBAL BIOENERGY STATISTICS 2020. Available at: https://worldbioenergy.org/uploads/201210 WBA GBS 2020.pdf.
WWF (2011). The energy report 100% renewable energy by 2050. Gland, Switzerland. Available at: https://portals.iucn.org/library/node/28831. doi:10.1007/bfb0087305
Keywords: energy transition, biomass, non-energy demand, energy system modeling, optimal uses
Citation: Colla M, Blondeau J and Jeanmart H (2022) Optimal Use of Lignocellulosic Biomass for the Energy Transition, Including the Non-Energy Demand: The Case of the Belgian Energy System. Front. Energy Res. 10:802327. doi: 10.3389/fenrg.2022.802327
Received: 26 October 2021; Accepted: 24 February 2022;
Published: 15 March 2022.
Edited by:
Enrico Sciubba, University Niccolò Cusano, ItalyReviewed by:
Hassan Nezammahalleh, Hamyarapply Educational Consulting Group, IranChinedu Okoli, National Energy Technology Laboratory (DOE), United States
Copyright © 2022 Colla, Blondeau and Jeanmart. This is an open-access article distributed under the terms of the Creative Commons Attribution License (CC BY). The use, distribution or reproduction in other forums is permitted, provided the original author(s) and the copyright owner(s) are credited and that the original publication in this journal is cited, in accordance with accepted academic practice. No use, distribution or reproduction is permitted which does not comply with these terms.
*Correspondence: Martin Colla, bWFydGluLmNvbGxhQHVjbG91dmFpbi5iZQ==