 Mingzhe Zhao
 Yimin Wang
 Xuebin Wang1*
- 1State Key Laboratory of Eco-hydraulics in Northwest Arid Region of China (Xi’an University of Technology), Xi’an, China
- 2Yalong River Hydropower Development Company, Ltd, Chengdu, China
- 3Northwest Engineering Corporation Limited, Xi’an, China
The rapid development of renewable energy improves the requirements of renewable energy output simulation. The clustering characteristics and correlation of renewable energy would improve the accuracy of power output simulation. To clarify the typical power output process of a large-scale wind power base, a novel method is proposed for wind power output scene simulation in this paper. Firstly, the genetic algorithm (GA) Kmeans is used to divide the wind farm clusters. The wind power output of each cluster is calculated by the wind turbine model. Then, the Copula principle is used to describe the correlation characteristic of wind farm clusters. Finally, the power output scenes are simulated by the Markov chain Monte Carlo (MCMC) method. To verify the effectiveness of proposed method, the wind power base in the downstream Yalong River basin is taken as the case study. The results show that the 65 wind farms should be divided into 6 clusters. The five typical power output scenes in winter–spring and summer–autumn seasons are simulated respectively based on the clustering characteristics and correlation of wind farms. This study provides a valuable reference for other large-scale renewable power bases all over the world.
Introduction
An energy structure with fossil energy as its main source brings many problems, such as environmental pollution, climate change, and energy depletion crisis, which seriously restrict the development of the social economy (Zhang et al., 2018; Wang et al., 2018). Since the 21st century, energy structure transformation has become the focus of countries worldwide (Hou et al., 2019). Under the guidance of the concept of energy structure transformation, the development of the global renewable energy industry has been accelerating, and the installed capacity of renewable energy has increased from 812 GW in 2004 to about 3,089 GW in 2021. However, the high randomness, intermittency, and uncontrollability of renewable energy result in large-scale wind and photovoltaic (PV) power generation presenting large challenges for integration into a power grid (Wang et al., 2019; Wang et al., 2019; Liu et al., 2020). Therefore, clarifying the characteristics of large-scale renewable energy and simulating the power output scene is of great significance for renewable energy development (Kim et al., 2020; Zhang et al., 2020).
Currently, numerous studies focus on the analysis of the spatial and temporal distribution of renewable energy, as well as the evaluation of complementary characteristics of various clean energy power stations. De Blasis et al. (2021) applied a high-order multivariate Markov model to clarify the cross- and auto-correlation characteristics between wind speed and direction. Almeida et al. (2021) proposed a Monte Carlo-based multi-area reliability assessment method to represent the relevant features and intermittency of variable renewable energy resources. Xu et al. (2017) constructed the relation function of the marginal cumulative distribution function of the intensity of wind speed and light irradiance through the Copula function and used the Kendall rank correlation coefficient to describe the spatial and temporal characteristics of wind and PV indirectly. Huang et al. (2021) used the Copula method to analyze the uncertainties of wind and solar power for quantifying the risk of wind–solar–hydro complementary system. Cantao et al. (2017) used hydro–wind correlation maps to analyze the wind and hydropower complementarity, which are quantitative and more intuitive. Based on the variable-structure Copula function, Wang et al. (2020) proposed a novel method to describe the correlation and complementarity of distributed wind power and load for optimizing the planning capacity of distributed wind power. Antunes Campos et al. (2020) assessed the complementary nature between wind with the Pearson’s correlation coefficient and PV power and optimized energy storage capacity in the utility-scale hybrid power plants. However, the research on the combination of temporal–spatial distribution characteristics of renewable energy and output simulation or prediction is still insufficient.
Based on the complementary characteristics of new energy such as wind energy and solar energy, there have been many scholars who have studied the clustering characteristics of new energy in different regions. Dai et al., 2017 proposed an evaluation method of cluster output smoothness and quantified the contribution of wind power clustering to reduce the fluctuation of wind power output. Yesilbudak (2016) adopted the Kmeans clustering method with Squared Euclidean, City-Block, Cosine, and Pearson Correlation distance measures to analyze the clustering characteristics of 75 provinces’ wind speed in Turkey. According to the aggregate effect of wind and solar power plants, Liu et al. (2020) aggregated all the power plants of study area into a virtual wind power plant and a virtual solar power plant. Chidean et al. (2018) presented the Second-Order Data-Coupled Clustering (SODCC) algorithm to analyze the wind power resource in the Iberian Peninsula. Yan et al. (2020) proposed a scenario generation method and established the planning model of renewable energy based on cluster partition. Nevertheless, there is less research focused on the correlation of multiple renewable energy clusters.
To develop and utilize large-scale renewable energy and reduce the adverse impact of renewable energy uncertainty, many scholars have conducted research on renewable energy scene simulation and power forecasting. Renewable power output scene simulation aims to fully tap the overall characteristics and statistical laws of renewable energy, generate typical power output scenes, and provide basis for renewable power system planning (Densing and Wan, 2022). In the previous literature, Deng et al. (2018) used a typical scenario simulation method of renewable power output calculating the renewable energy accommodation capability. Ding et al. (2016) proposed a short-term stochastic simulation method based on the renewable power output error and used the method for a real power grid in Northwest China. Compared with renewable power output scene simulation, renewable energy prediction provides a basis for making power system generation plan and power grid dispatching operation (Zhang et al., 2020). Renewable energy forecast generally uses the statistical regression methods and machine learning technologies to estimate the future power output process. Wang et al. (2020) proposed a hybrid wind power forecasting approach based on Bayesian model averaging and Ensemble learning. Neshat et al. (2021) proposed a novel three stages’ composite deep learning-based evolutionary approach to forecast the power output in wind-turbine farms with the chaotic characteristics of wind speed series. Singh et al. (2021) represented the short-term wind power forecasting accuracy of five machine learning methods, such as k-nearest neighbor (kNN), decision-tree, extra tree regression, random forest, and gradient boosting machine (GBM). However, most of the existing research ignores the characteristic differences between different wind farms, and there are only a few studies on wind power simulating or forecasting of large-scale wind power bases based on the clustering method.
At present, research on the characteristics of new energy resources, cluster division, and renewable power output forecasting and simulating has achieved phased results, but there are still some deficiencies. In the planning and designing stage of the renewable energy system, the simulation scenes of renewable power output would be frequently used. However, the unreasonable wind power output scenes would seriously affect the development and management of the renewable energy system. In particular, previous research on renewable energy simulation assumes that the power output should be consistent in the whole area. The power output scenes of a representative wind farm would be usually used to describe all wind farms in the region. However, for large-scale wind power bases, there are certain differences in wind power output characteristics in the region. Ignoring the correlation and complementarity of wind farm clusters will lead to a large deviation in the simulation results of the wind power output. Consequently, researching on power output scene simulation of large-scale wind power base considering the power station cluster division and power output correlation of adjacent clusters is very necessary and urgent.
In order to fill this gap and obtain the accurate power output scenes of large-scale wind power bases, this paper proposed a power output scene simulation method considering power station clustering and cluster correlation. Firstly, the wind farm clusters are divided by the genetic algorithm (GA)-Kmeans method with similar distances. Secondly, based on the conversion relationship of wind speed and electric power, the wind power output physical model is used to calculate the wind power output of each wind farm cluster. Then, using the joint and conditional distribution functions of Copula, the correlation between different clusters is analyzed. Finally, the Markov chain Monte Carlo (MCMC) method is used to simulate the power output scenes of large-scale wind bases. The wind power base of the downstream Yalong River basin is taken as an example to verify the validity and rationality of the new method.
Methodology
The methods to be used for simulating the power output scene of large-scale wind power mainly consists of four parts. The technical route of the large-scale wind power base output simulating method with the correlation is shown in Figure 1. The nomenclature table of abbreviations, variables, and constants is shown in Table 1.
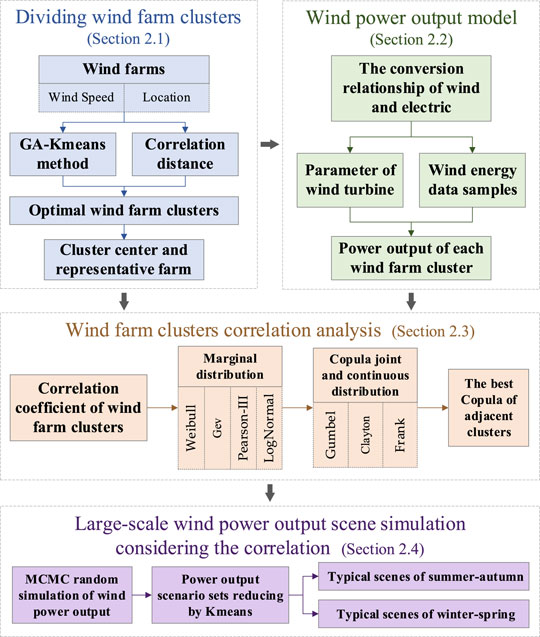
FIGURE 1. The technical route of the proposed methods.
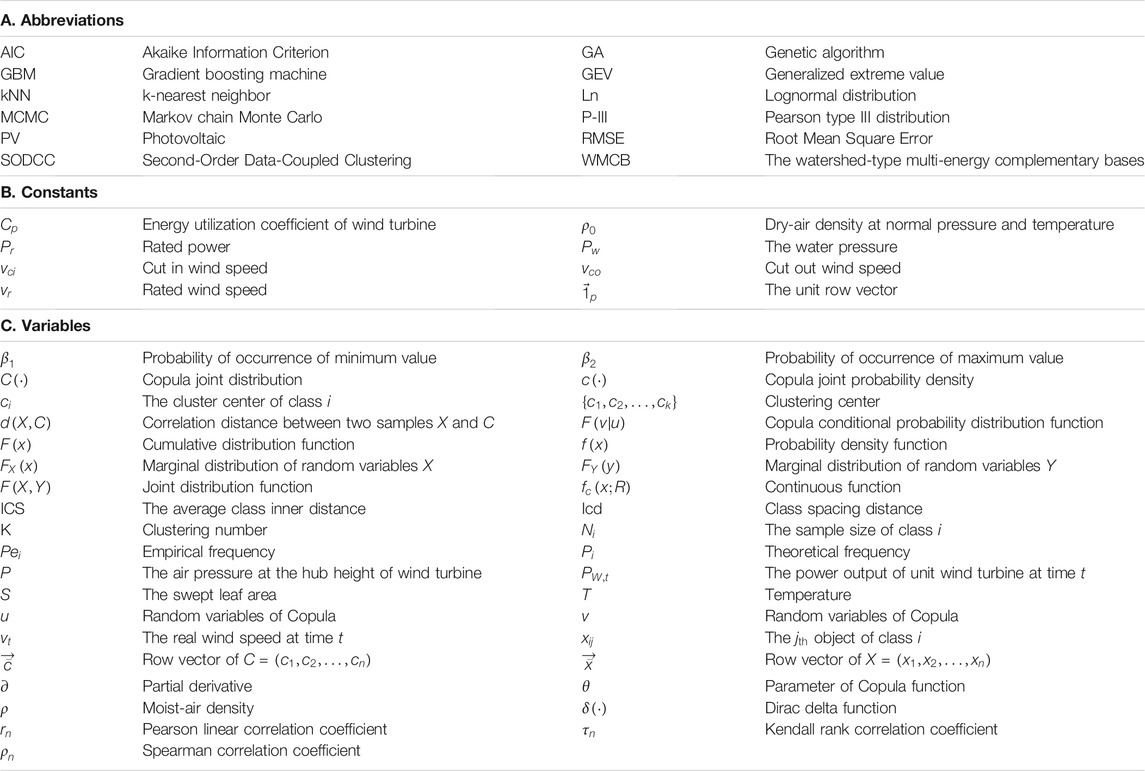
TABLE 1. The nomenclature table of abbreviations, constants, and variables.
Wind Farm Cluster Division With the GA-Kmeans Method
The GA-Kmeans method was performed to divide the wind farm clusters. The uncertainty caused by the clustering number K and clustering center
Furthermore, the correlation distance was selected as the distance evaluation index in the Kmeans clustering process. The fitness function optimized by the GA algorithm was constructed by counting the intra-class distance and inter-class distance of each cluster.
The correlation distance between
where
The similarity of objects in the Kmeans cluster can be expressed by the average class inner distance as follows:
where
The object difference between clusters of Kmeans clustering can be expressed by class spacing as:
The fitness function was defined as:
The fitness function value was determined by the quality of clustering results. The fitness function value is larger when the average in-class distance is smaller and class distance is larger. Currently, the clustering effect is better.
Calculation Method of Wind Power Output
The wind speed and electric power conversion model is adopted to calculate the output power of a single wind turbine. The total output process of the wind farm can be obtained by the ratio of the unit capacity to the installed machine. The power conversion relation of a wind turbine is shown as:
where
Wind Farm Clusters Correlation Analysis With the Copula Principle
The correlation analysis method of adjacent wind farm clusters based on the Copula principle includes the marginal distribution model of wind farm cluster power output, the Copula function type and conditional distribution of adjacent wind power cluster output, and the goodness-of-fit test method of the distribution model.
The Marginal Distribution of Wind Power Output
The main distribution marginal functions widely used in statistical analysis are Pearson type III distribution (P-III), lognormal distribution (Ln), Generalized extreme value distribution (Gev), and Weibull distribution. In this paper, four distributions are used to fit the marginal distribution of each wind power cluster’s output.
It is worth noting that if the wind power output is taken as the random variable, there are multiple repeated minimum and maximum values in the sample sequence. Moreover, the probabilities of minimum and maximum values are not equal to 0, which leads to the discontinuity of probability density function and cumulative distribution function of wind power output. Therefore, the probability distribution of wind power output needs to be described by the interception distribution model, and the probability density and cumulative distribution function can be expressed as:
where,
The Copula Function Type and the Conditional Distribution
Sklar (1959) introduced the theory of Copula into statistics, providing an effective method for multivariate analysis. For 2-dimensional random variables, random variables
where
If
where
Analyzing the correlation between variables is the basis of constructing Copula joint distribution. Pearson linear correlation coefficient (
Nelson (1999) gave a detailed introduction to the Copula function and its properties. Generally, Copula functions can be divided into three types: Elliptic, Archimedean, and Quadratic. The Archimedean Copula with one parameter is the most widely used.
In this paper, three Archimedean Copula (Gumbel Copula, Clayton Copula, and Frank Copula) are used to construct the joint distribution of wind power of each wind farm cluster. The joint distribution functions and conditional distribution functions of three Copula type are provided as follows:
1) The joint distribution function and conditional distribution function of Gumbel Copula are shown as:
where
2) The joint distribution function and conditional distribution function of Clayton Copula are shown as:
where
3) The joint distribution function and conditional distribution function of Frank Copula are shown as:
where
The Goodness-of-Fit Test Index
Root Mean Square Error (RMSE) and Akaike Information Criterion (AIC) were used to evaluate the goodness of fit of the Copula joint distribution function.
1) RMSE is the most commonly used index for the goodness-of-fit test.
where
2) AIC considers the deviation of Copula function fitting and the uncertainty caused by the number of parameters of Copula function.
where
Large-Scale Wind Power Output Scene Simulation Considering the Correlation
According to the correlation characteristics among wind power clusters, the MCMC method is used in this study to randomly sample from the conditional distribution of each variable and its related variables in a fixed order to form the output scenario set of large-scale wind power bases, and the sampled output scenarios are reduced based on the synchronous backstepping method to extract representative typical output scenarios. The steps of output scenario simulation of large-scale wind power are as follows:
1) Generate
2) Let
3) Calculate the output of all wind farm clusters
4) Repeat steps (1) to (3)
5) Based on the Kmeans scenario reduction method, the representative typical output scenarios are extracted in the output scenario set of a large-scale wind power base.
Case Study
This study focuses on the Yalong River (the longest tributary of the Jinsha River), which is located in Southwest China. Its geographical location is 96°52′E to 102°48′E and 26°32′N to 33°58′N. The Yalong River basin is an area that is rich in wind energy and solar energy resources. There are abundant wind and PV power resources on both sides of the river basin, and it has great development potential (Wang et al., 2016; Liu et al., 2019). The complementary characteristics of wind, PV, and hydropower resources within the year are fully used to improve the comprehensive benefits. According to the preliminary plan of the watershed-type multi-energy complementary bases (WMCB) in the downstream Yalong River basin, there are more than 65 wind power farms with a total capacity of 7 GW; there are nearly 19 PV power stations with a total capacity of about 5.6 GW; the hydropower installed capacity of the downstream Yalong River basin is 14.7 GW (Zhang et al., 2020).
According to the planned location of the wind farms in the lower reaches of the Yalong River (as shown in Figure 2), the wind energy reanalysis data at each station location are extracted, and the wind speed power conversion model is used to calculate the long-series output process of each wind farm. The advanced GW121-2.5MW wind turbine is selected as the reference unit in the research process. The main technical parameters of the GW121-2.5MW wind turbine are shown in Table 2.
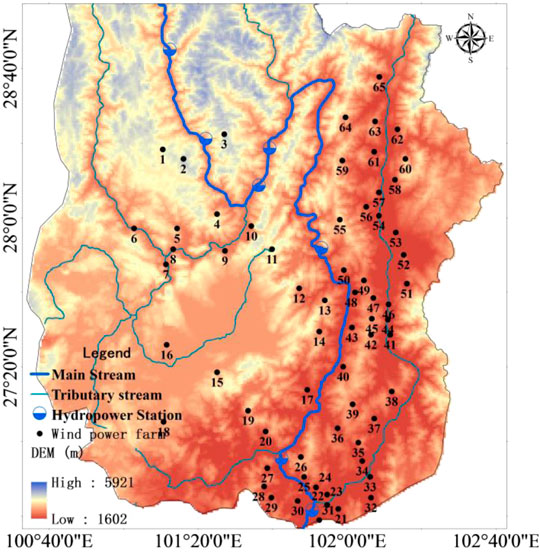
FIGURE 2. The downstream Yalong River basin.

TABLE 2. The main technical parameters of the GW121-2.5MW wind turbine.
Results and Discussion
In order to numerically verify the effectiveness of the research model and method, the results and discussion of the wind farms cluster in the downstream Yalong River basin are performed.
Dividing the Wind Farm Clusters
Kmeans method should determine the clustering number
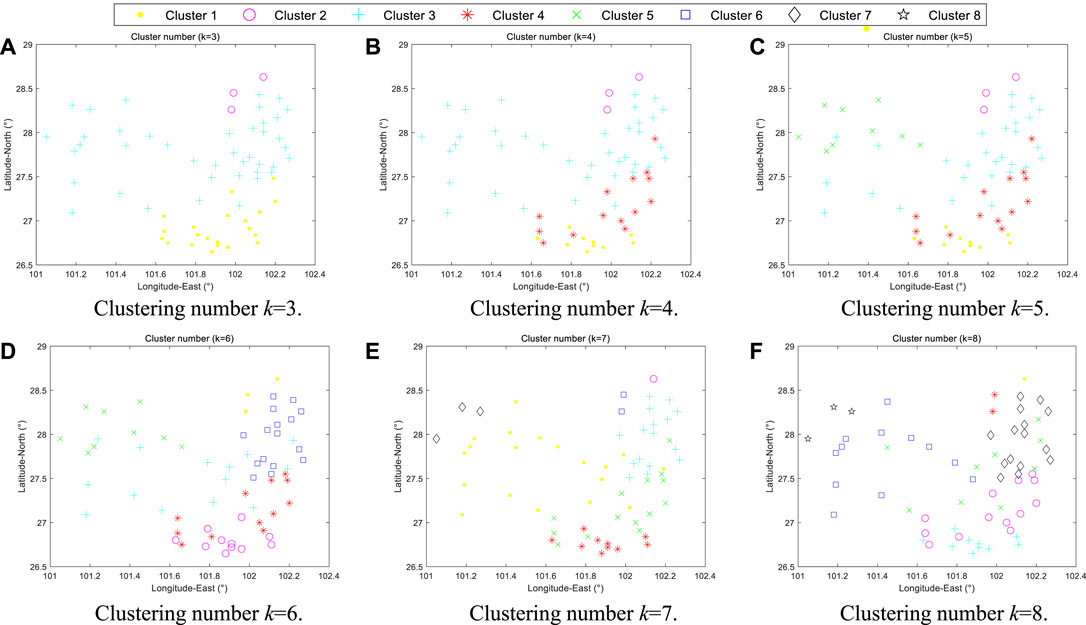
FIGURE 3. Clustering results of wind farms under different clustering numbers (k = 3–8). (A) Clustering number k = 3. (B) Clustering number k = 4. (C) Clustering number k = 5. (D) Clustering number k = 6. (E) Clustering number k = 7. (F) Clustering number k = 8
Therefore, comparing the clustering results under different cluster numbers, the optimal clustering number is
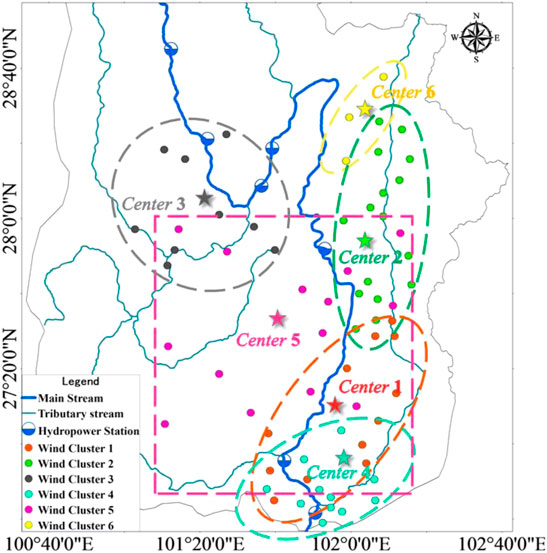
FIGURE 4. The wind farm cluster division results in downstream Yalong River basin.

TABLE 3. The cluster center and representative wind farm of dividing wind farm clusters.
Power Output Characteristic of Wind Farm Clusters
According to the wind power cluster division results, the power output of each cluster is calculated by the wind power output physical model, and the typical daily power output of 6 clusters in each month is shown in Figure 5. It can be seen from Figure 5 that the wind power output has obvious daily and annual variation rules. In the short term, the wind power output is low from 10:00 to 15:00, and the wind power output usually reaches the peak at about 20:00, which is the same time as the peak load. In the long term, the output of wind power clusters shows obvious seasonal law. From June to October, the power output of each cluster is significantly lower than that in other months. Therefore, it can be divided into two characteristic periods: summer–autumn and spring–winter.
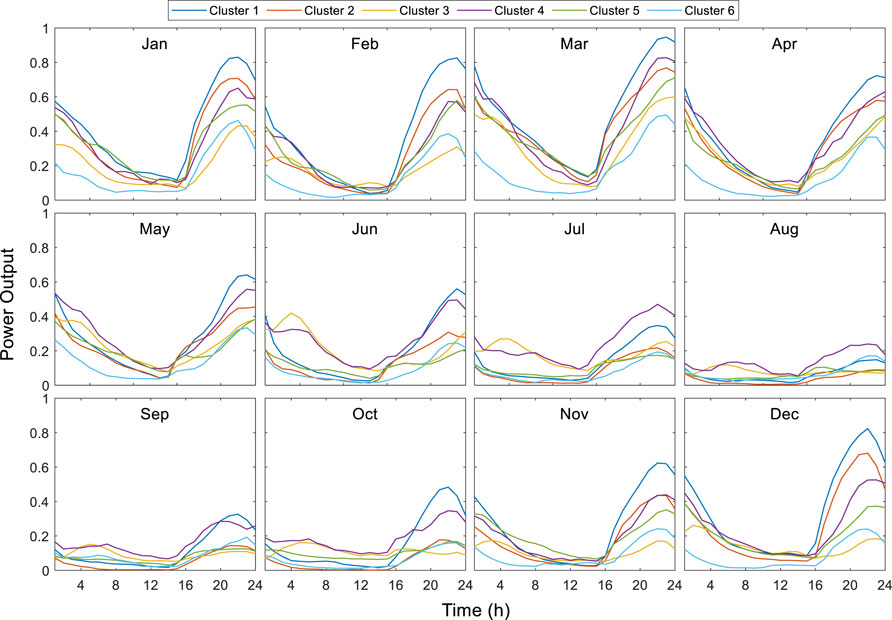
FIGURE 5. Daily power output variation curve of six wind farm clusters in each month.
The daily power output intervals of 6 wind farm clusters in the winter–spring and summer–autumn seasons are shown in Figure 6. From Figure 6, there are significant differences in the daily power output intervals of different seasons and different clusters. In the spring–winter season, the mean value and variation range of daily power output are relatively large, while in the summer–autumn season, the mean value and variation range of daily power output are both small.
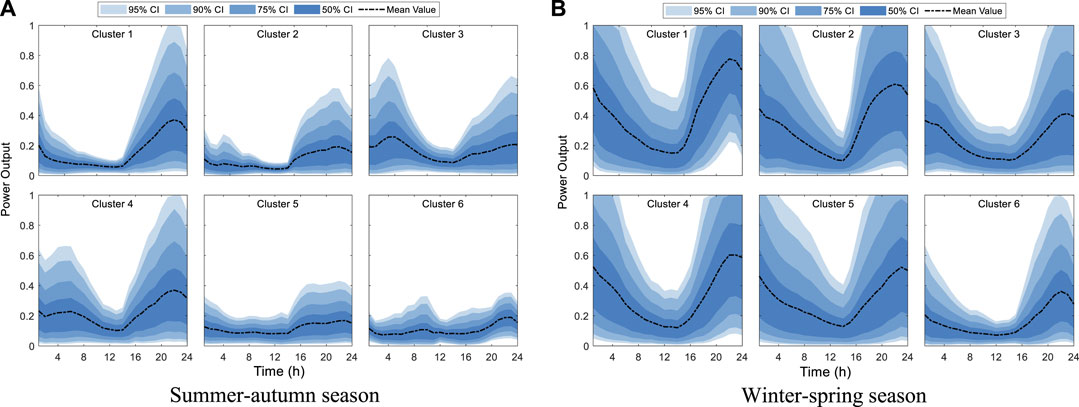
FIGURE 6. Daily power output interval of six wind farm clusters in summer–autumn and winter–spring seasons. (A) Summer–autumn season. (B) Winter–spring season.
Correlation Analysis of Wind Farm Clusters Based on Copula
According to wind farm cluster division results in downstream Yalong River basin and power output sequence and characteristic of each wind cluster, analyze the correlation of adjacent wind farm clusters with three types of Copula function.
The Correlation Coefficient of Adjacent Wind Farm Clusters
In this study, the Pearson, Spearman, and Kendall correlation coefficients are used to evaluate the correlation among six wind farm clusters in downstream Yalong River basin, as shown in Table 4. The scatter matrix of wind farm clusters is drawn in Figure 7.
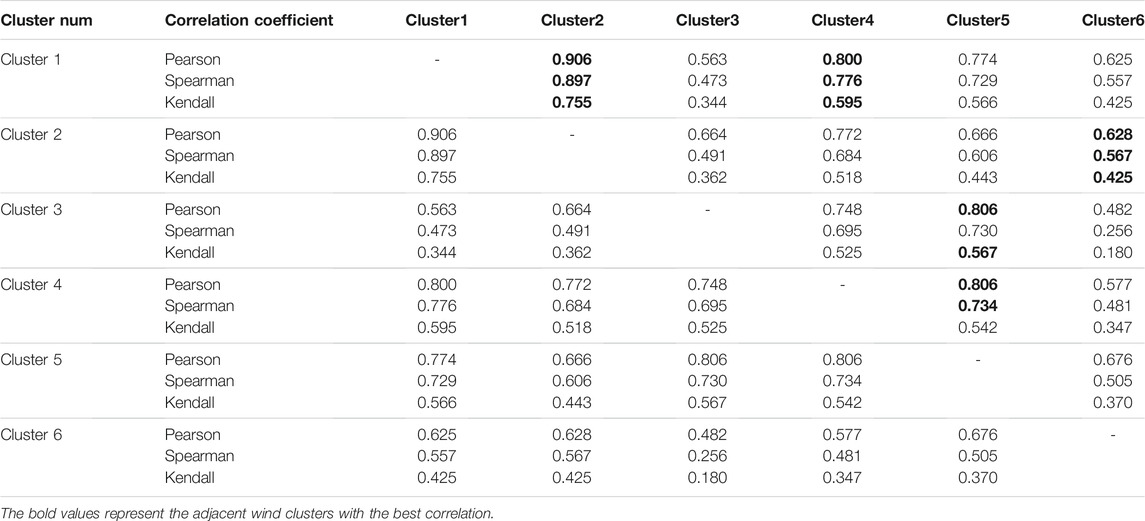
TABLE 4. The correlation coefficients of wind farm clusters in the downstream Yalong River basin.
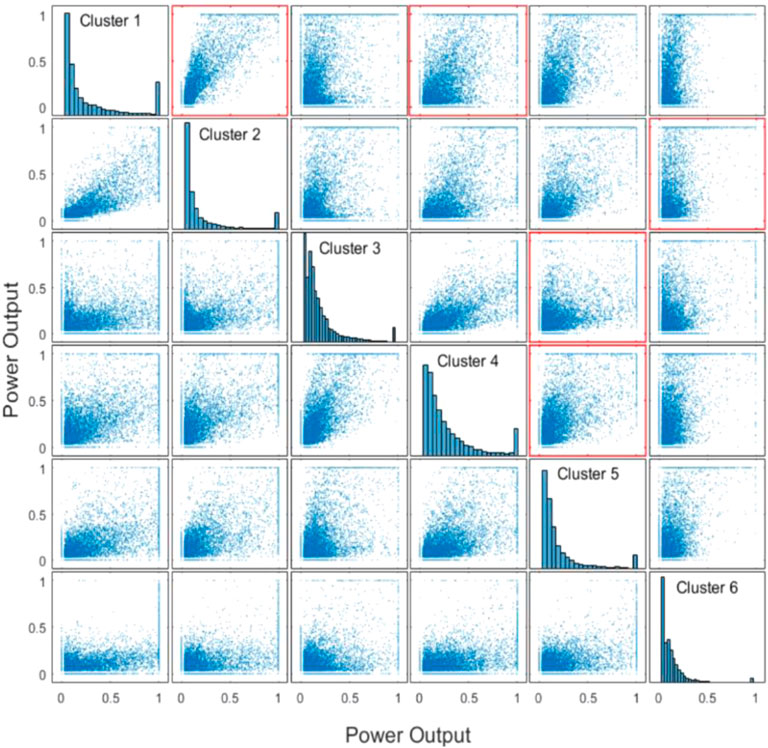
FIGURE 7. The correlation scatter diagram matrix of wind farm cluster.
Because it is hard to analyze the correlation of multiple wind farm clusters directly, this study uses a set of correlations of adjacent wind farm clusters to represent the correlation of multiple wind farm clusters. According to the three correlation coefficients and scatter matrix of each wind power cluster, the adjacent wind farm clusters with strong correlation are selected to form the adjacent wind farm clusters connected head to tail: Cluster3–Cluster5, Cluster5–Cluster4, Cluster4–Cluster1, Cluster1–Cluster2, and Cluster2–Cluster6. Figure 7 and Figure 4 indicate that the selected adjacent wind power clusters are consistent with the spatial distribution law of wind farm clusters in downstream Yalong River basin.
The Marginal Distribution of Each Wind Farm Cluster
In this paper, the generalized extreme value distribution, Weibull distribution, Pearson type III distribution, and lognormal distribution are selected as the marginal distribution function to fit the power output of each wind farm cluster, and the marginal distribution parameters are estimated by the maximum likelihood method. The cumulative distribution curves of the power output of six wind power clusters in downstream Yalong River basin are shown in Figure 8.
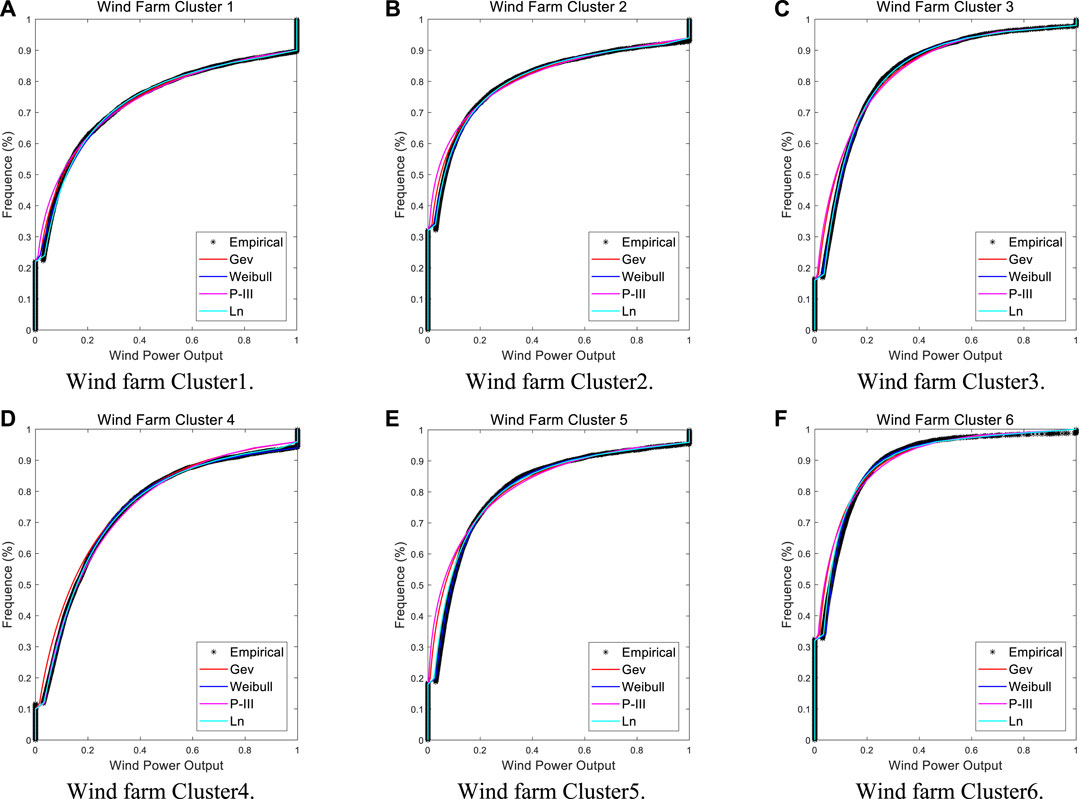
FIGURE 8. The marginal distribution function of power output in each wind farm cluster. (A) Wind farm Cluster1. (B) Wind farm Cluster2. (C) Wind farm Cluster3. (D) Wind farm Cluster4. (E) Wind farm Cluster5. (F) Wind farm Cluster6.
From Figure 8, comparing the empirical frequency with the cumulative frequency of each marginal distribution, it can be found that the goodness-of-fitting of the four distribution curves is roughly the same, and four type distributions could fit the data samples well. After screening, the optimal marginal distributions of Cluster1, Cluster3, Cluster5, and Cluster6 are lognormal distribution, the optimal marginal distributions of Cluster2 and Cluster4 are Weibull distribution, and the optimal marginal distribution of each wind farm cluster is used to construct Copula joint distribution. Moreover, the interception distribution model used in this study can effectively fit the samples with the power output of 0 and 1 in the data series.
The Copula Joint Function of Adjacent Wind Farm Clusters
According to the adjacent wind farm clusters and the marginal distribution of each wind power cluster, the Gumbel Copula, Clayton Copula, and Frank Copula are used to construct the joint distribution of adjacent wind farm clusters. The Copula joint distribution parameters are estimated by the maximum likelihood method. The AIC and RMSE criteria are used to test the goodness-of-fitting of Copula functions, as shown in Table 4. As can be seen from Table 5, the best joint distribution in Cluster3–Cluster5 is Frank Copula function. The best joint distribution in Cluster5–Cluster4, Cluster4–Cluster1, Cluster1–Cluster2, and Cluster2–Cluster6 is the Gumbel Copula function. The best Copula joint distribution of adjacent wind farm clusters is shown in Figure 9.
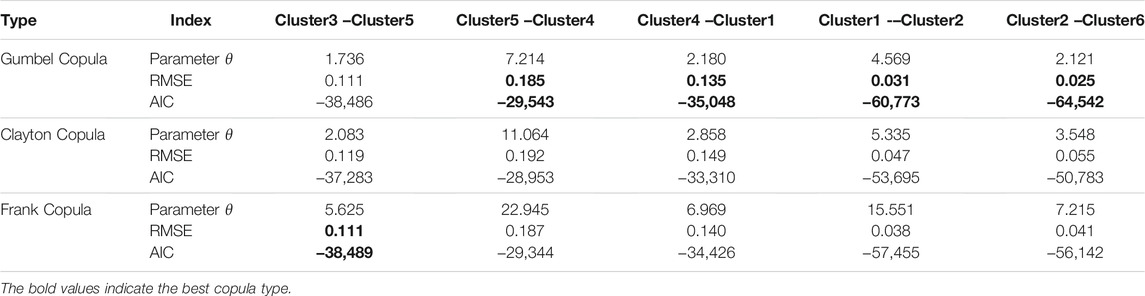
TABLE 5. Parameter estimation and the goodness-of-fit test index of the joint distribution function.
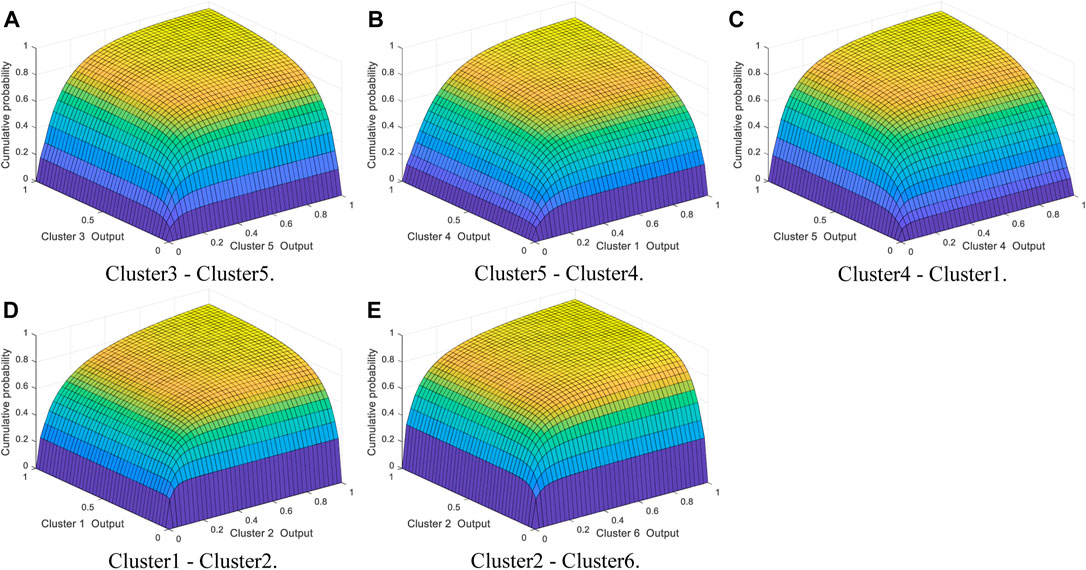
FIGURE 9. The best joint distribution graph between adjacent wind farm clusters. (A) Cluster3–Cluster5. (B) Cluster5–Cluster4. (C) Cluster4–Cluster1. (D) Cluster1–Cluster2. (E) Cluster2–Cluster6.
Figure 9 indicates that the Copula joint distribution diagram can intuitively reflect the joint probability of adjacent wind farm clusters. According to the joint distribution of wind farm clusters, when the power output of a wind farm cluster is certain, the conditional probability of power output of its adjacent cluster can be determined. On the contrary, given the joint probability of adjacent wind farm clusters and one of the cluster power output, the corresponding power output of the other cluster can be deduced.
Output Scenario Combination of Large-Scale Wind Power
Based on the Copula joint distribution, the 10,000 sets of power output scenarios of downstream Yalong River wind power base in summer–autumn and winter–spring are simulated by the MCMC method and shown in Figures 10A, B. From Figure 6 and Figures 10A, B, the simulated power output scenario sets of wind power base in summer–autumn and winter–spring have the same law as the daily power output interval.
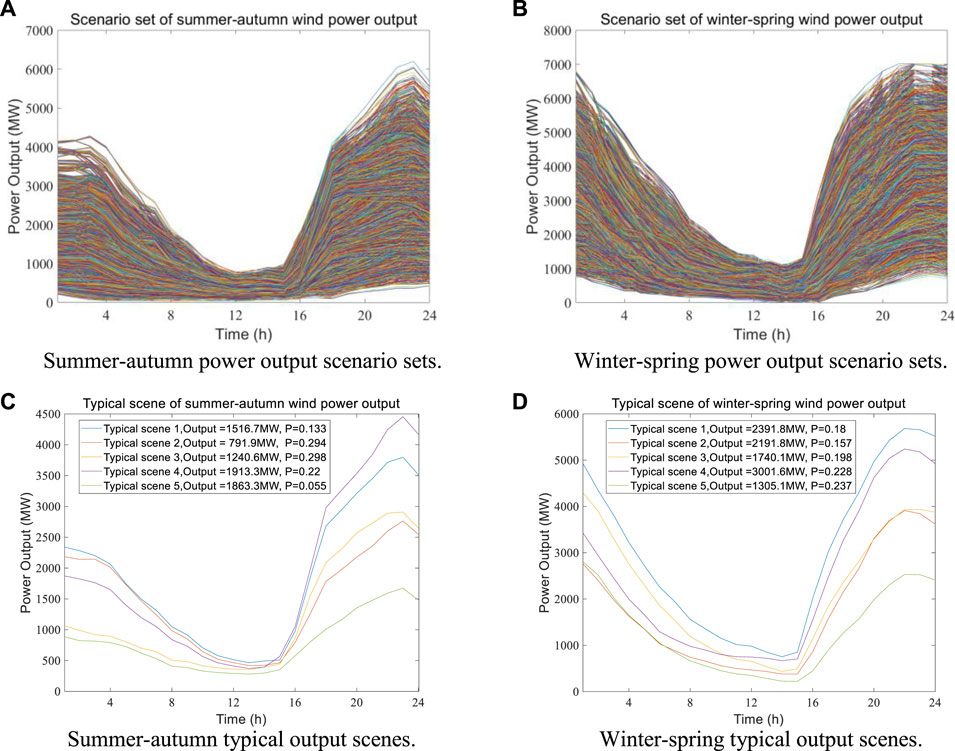
FIGURE 10. The power output scenario sets and the typical output scenes of the Yalong River wind power base in the summer–autumn and winter–spring seasons. (A) Summer–autumn power output scenario sets. (B) Winter–spring power output scenario sets. (C) Summer–autumn typical output scenes. (D) Winter–spring typical output scenes.
However, the power output scenario sets of wind power base in summer–autumn and winter–spring are too complex, so the power output scenario sets need to be reasonably reduced. The Kmeans scenario reduction model is used to reduce 10,000 sets of scenarios into five typical scenarios. The representative typical wind power output scenarios and the corresponding scenario probabilities in the winter–spring and summer–autumn seasons are shown in Figures 10C, D. From Figure 10, the typical power output scenes can basically cover the original scenario set, and each typical power output scenario is highly representative. Otherwise, comparing the typical power output scenes of wind power base in summer–autumn and winter–spring seasons, the probability of each scene in winter–spring season is relatively similar, and the scene probability is about 0.2. In the summer–autumn season, the probability of each scene is quite different. The probability of Scene2 and Scene3 is close to 0.3, while the probability of Scene5 is only 0.055. In general, the power output simulation method of large-scale wind power base can realize the rapid modeling and solution of the integrated output of abundant wind farms.
Conclusion
The continuous expansion of new energy such as wind power directly leads to the increase of power system uncertainty and the difficult grid integration of new energy. It is beneficial to divide the large-scale wind power base into wind power clusters and quantify the correlation of wind power clusters. Therefore, this paper proposed a power output scene simulation method of large-scale wind power bases considering power station clustering and cluster correlation characteristics. The method is applied in the Yalong River downstream, and the main conclusions of this paper can be summarized:
1) GA-Kmeans clustering method with a similar distance to the evaluation standard can quickly and accurately divide the clusters of renewable energy power stations and effectively solve the influence of cluster number and initial cluster center on Kmeans clustering results. In the case study, this method is applied to divide the 65 wind farms in the downstream Yalong River basin into 6 clusters, and the cluster division results are consistent with the spatial distribution characteristics of wind energy resources in the basin.
2) Copula function can effectively reflect the output correlation of multi-dimensional wind farm clusters and significantly improve the simulation or prediction effect of the power output in large-scale wind power bases. In the case study, the Copula function is constructed to determine the best joint distribution of 6 adjacent wind farm clusters in the downstream Yalong River basin. Then, based on the correlation characteristic, the MCMC sampling method is used to simulate the typical power output of the Yalong River downstream wind power base in winter–spring and summer–autumn seasons, respectively.
3) Compared with the power output scenario sets, the typical power output scenes can effectively remove the redundant information in many scenario sets and highlight the representative situation of the integrated output of a large-scale wind power base. Furthermore, the typical power output scenes could be conducive to the application of scenes in practical work such as planning, design, scheduling, and operation of large-scale wind power base.
Data Availability Statement
The raw data supporting the conclusion of this article will be made available by the authors, without undue reservation.
Author Contributions
MZ designed the framework and analyzed the data of this study; YW and XW provided significant suggestions on the methodology and structure of the manuscript; YZ, JC, and TL collected the data; MZ wrote the paper.
Funding
This research was funded by the Natural Science Foundation of China (grant numbers U1965202, 52009101, and 51909207).
Conflict of Interest
Author YZ is employed by Yalong River Hydropower Development Company, Ltd. Author TL is employed by Northwest Engineering Corporation Limited.
The remaining authors declare that the research was conducted in the absence of any commercial or financial relationships that could be construed as a potential conflict of interest.
Publisher’s Note
All claims expressed in this article are solely those of the authors and do not necessarily represent those of their affiliated organizations, or those of the publisher, the editors, and the reviewers. Any product that may be evaluated in this article, or claim that may be made by its manufacturer, is not guaranteed or endorsed by the publisher.
Acknowledgments
The authors gratefully thank the Yalong River Hydropower Development Co., Ltd. and Southwest Branch of State Grid Corporation of China for providing the data.
References
Almeida, D. B., Borges, C. L. T., Oliveira, G. C., and Pereira, M. V. (2021). Multi-area Reliability Assessment Based on Importance Sampling, MCMC and Stratification to Incorporate Variable Renewable Sources. Electric Power Syst. Res. 193, 107001. doi:10.1016/j.epsr.2020.107001
Antunes Campos, R., Rafael Do Nascimento, L., and Rüther, R. (2020). The Complementary Nature between Wind and Photovoltaic Generation in Brazil and the Role of Energy Storage in Utility-Scale Hybrid Power Plants. Energ. Convers. Manag. 221, 113160. doi:10.1016/j.enconman.2020.113160
Cantão, M. P., Bessa, M. R., Bettega, R., Detzel, D. H. M., and Lima, J. M. (2017). Evaluation of Hydro-Wind Complementarity in the Brazilian Territory by Means of Correlation Maps. Renew. Energ. 101, 1215–1225. doi:10.1016/j.renene.2016.10.012
Chidean, M. I., Caamaño, A. J., Ramiro-Bargueño, J., Casanova-Mateo, C., and Salcedo-Sanz, S. (2018). Spatio-temporal Analysis of Wind Resource in the Iberian Peninsula with Data-Coupled Clustering. Renew. Sust. Energ. Rev. 81 (2), 2684–2694. doi:10.1016/j.rser.2017.06.075
De Blasis, R., Masala, G. B., and Petroni, F. (2021). A Multivariate High-Order Markov Model for the Income Estimation of a Wind Farm. Energies 14 (2), 388. doi:10.3390/en14020388
Deng, J., Wang, A., Hu, Y., Ren, A., and Wang, K. (2018). Analysis of Renewable Energy Accommodation Capability of Shanxi Power Grid Based on Operation Simulation Method. 2018 2ND IEEE CONFERENCE ENERGY INTERNET ENERGY SYSTEM INTEGRATION (Ei2), 1–9. doi:10.1109/EI2.2018.8582094
Densing, M., and Wan, Y. (2022). Low-dimensional Scenario Generation Method of Solar and Wind Availability for Representative Days in Energy Modeling. Appl. Energ. 306, 118075. doi:10.1016/j.apenergy.2021.118075
Ding, K., Wang, N., Xie, H., and Bie, Z. (2016). Production Simulation of Power Systems Considering the Forecast Error of Renewable Energy. 2016 IEEE PES ASIA-PACIFIC POWER ENERGY ENGINEERING CONFERENCE (Appeec), 2091–2095. doi:10.1109/APPEEC.2016.7779855
Hou, Q., Zhang, N., Du, E., Miao, M., Peng, F., and Kang, C. (2019). Probabilistic Duck Curve in High PV Penetration Power System: Concept, Modeling, and Empirical Analysis in China. Appl. Energ. 242, 205–215. doi:10.1016/j.apenergy.2019.03.067
Huang, K., Liu, P., Ming, B., Kim, J.-S., and Gong, Y. (2021). Economic Operation of a Wind-Solar-Hydro Complementary System Considering Risks of Output Shortage, Power Curtailment and Spilled Water. Appl. Energ. 290, 116805. doi:10.1016/j.apenergy.2021.116805
Kim, H., Lee, J., Yoon, M., Lee, M., Cho, N., and Choi, S. (2020). Continuation Power Flow Based Distributed Energy Resource Hosting Capacity Estimation Considering Renewable Energy Uncertainty and Stability in Distribution Systems. Energies 13 (17). doi:10.3390/en13174367
Liu, B., Lund, J. R., Liao, S., Jin, X., Liu, L., and Cheng, C. (2020). Optimal Power Peak Shaving Using Hydropower to Complement Wind and Solar Power Uncertainty. Energ. Convers. Manag. 209, 112628. doi:10.1016/j.enconman.2020.112628
Dai, J., Cao, J., Liu, D., Wen, L., and Long, X. (2017). Power Fluctuation Evaluation of Large Scale Wind Turbines Based on SCADA Data. IET Renew. Power Gen. 11, 395–402. doi:10.1049/iet-rpg.2016.0124
Liu, Y., Jiang, Z., Feng, Z., Chen, Y., Zhang, H., and Chen, P. (2019). Optimization of Energy Storage Operation Chart of Cascade Reservoirs with Multi-Year Regulating Reservoir. Energies 12 (20), 3814. doi:10.3390/en12203814
Neshat, M., Nezhad, M. M., Abbasnejad, E., Mirjalili, S., Groppi, D., Heydari, A., et al. (2021). Wind Turbine Power Output Prediction Using a New Hybrid Neuro-Evolutionary Method. Energy 229, 120617. doi:10.1016/j.energy.2021.120617
Singh, U., Rizwan, M., Alaraj, M., and Alsaidan, I. (2021). A Machine Learning-Based Gradient Boosting Regression Approach for Wind Power Production Forecasting: A Step towards Smart Grid Environments. Energies. 14(16). doi:10.3390/en14165196
Sklar, A. (1959). Fonctions de Repartition a n Dimensions et Leurs Marges. Publications de l'Institut de statistique de l'Université de Paris 8.
Wang, G., Jia, R., Liu, J., and Zhang, H. (2020). A Hybrid Wind Power Forecasting Approach Based on Bayesian Model Averaging and Ensemble Learning. Renew. Energ. 145, 2426–2434. doi:10.1016/j.renene.2019.07.166
Wang, X., Chang, J., Meng, X., and Wang, Y. (2019). Hydro-thermal-wind-photovoltaic Coordinated Operation Considering the Comprehensive Utilization of Reservoirs. Energ. Convers. Manag. 198, 111824. doi:10.1016/j.enconman.2019.111824
Wang, X., Chang, J., Meng, X., and Wang, Y. (2018). Short-term hydro-thermal-wind-photovoltaic Complementary Operation of Interconnected Power Systems. Appl. Energ. 229, 945–962. doi:10.1016/j.apenergy.2018.08.034
Wang, X., Mei, Y., Cai, H., and Cong, X. (2016). A New Fluctuation Index: Characteristics and Application to Hydro-Wind Systems. Energies 9 (2), 114. doi:10.3390/en9020114
Wang, Y., Yang, R., Xu, S., and Tang, Y. (2020). Capacity Planning of Distributed Wind Power Based on a Variable-Structure Copula Involving Energy Storage Systems. Energies 13 (14), 3602. doi:10.3390/en13143602
Wang, Y., Zhao, M., Chang, J., Wang, X., and Tian, Y. (2019). Study on the Combined Operation of a hydro-thermal-wind Hybrid Power System Based on Hydro-Wind Power Compensating Principles. Energ. Convers. Manag. 194, 94–111. doi:10.1016/j.enconman.2019.04.040
Xu, L., Wang, Z., and Liu, Y. (2017). The Spatial and Temporal Variation Features of Wind-Sun Complementarity in China. Energ. Convers. Manag. 154, 138–148. doi:10.1016/j.enconman.2017.10.031
Yan, J., Sang, Z., Wang, S., Du, Z., Huang, J., Yang, D., et al. (2020). Analysis of Solar and Wind Power on Access Planning of Multiple Renewable Energy Sources. 2020 5TH INTERNATIONAL CONFERENCE RENEWABLE ENERGY ENVIRONMENTAL PROTECTION 621. doi:10.1088/1755-1315/621/1/012069
Yesilbudak, M. (2016). Clustering Analysis of Multidimensional Wind Speed Data Using K-Means Approach. 2016 IEEE INTERNATIONAL CONFERENCE RENEWABLE ENERGY RESEARCH APPLICATIONS (Icrera), 961–965. doi:10.1109/ICRERA.2016.7884477
Zhang, L., Xie, J., Chen, X., Zhan, Y., and Zhou, L. (2020). Cooperative Game-Based Synergistic Gains Allocation Methods for Wind-Solar-Hydro Hybrid Generation System with Cascade Hydropower. Energies 13 (15), 3890. doi:10.3390/en13153890
Zhang, X., Ma, G., Huang, W., Chen, S., and Zhang, S. (2018). Short-Term Optimal Operation of a Wind-PV-Hydro Complementary Installation: Yalong River, Sichuan Province, China. Energies 11 (4), 868. doi:10.3390/en11040868
Keywords: output scene simulation, GA-Kmeans method, Copula principle, large-scale wind power base, renewable energy
Citation: Zhao M, Wang Y, Wang X, Chang J, Zhou Y and Liu T (2022) Modeling and Simulation of Large-Scale Wind Power Base Output Considering the Clustering Characteristics and Correlation of Wind Farms. Front. Energy Res. 10:810082. doi: 10.3389/fenrg.2022.810082
Received: 06 November 2021; Accepted: 17 February 2022;
Published: 22 March 2022.
Edited by:
ZhaoYang Dong, University of New South Wales, AustraliaReviewed by:
Davide Astolfi, University of Perugia, ItalyMeysam Majidi Nezhad, Sapienza University of Rome, Italy
Copyright © 2022 Zhao, Wang, Wang, Chang, Zhou and Liu. This is an open-access article distributed under the terms of the Creative Commons Attribution License (CC BY). The use, distribution or reproduction in other forums is permitted, provided the original author(s) and the copyright owner(s) are credited and that the original publication in this journal is cited, in accordance with accepted academic practice. No use, distribution or reproduction is permitted which does not comply with these terms.
*Correspondence: Yimin Wang, d2FuZ3lpbWluQHhhdXQuZWR1LmNu; Xuebin Wang, eHVlYmluMTk5MEAxNjMuY29t