 Shilong Chen1
 Zihang Zhang
 Chao Xing
- 1Department of Electrical Engineering, Kunming University of Science and Technology, Kunming, China
- 2Kunming Power Supply Bureau in Yunnan Power Grid Co., Ltd., Kunming, China
- 3Electric Power Research Institute, Yunnan Power Grid Co., LTD., Kunming, China
In this paper, a protection scheme for the traction network of the penetrating co-phase traction direct power supply system based on the waveform similarity at both ends of line is proposed. Besides, research on the transmission characteristics of fault current is also carried out. This article, from the perspectives of the reflection and refraction process, attenuation degree, and polarity of fault current, analyzes the correlation and difference of current waveforms at both ends when interior line faults and adjacent line faults emerge. The correlation of waveforms can be proved by cosine similarity after the process of synchronous squeezes wavelet transformation of fault current. The conclusions are as follows: when the interior line faults occur, the sequence, reflection and refraction process, and attenuation degree reaching both ends are roughly the same, the polarity change direction is the same, and the waveform similarity is high; when the adjacent line faults occur, the sequence, reflection and refraction process, and attenuation degree reaching at both ends are greatly different, the polarity change direction is opposite, and the waveform similarity is low. When a protection scheme is based on using cosine similarity, it can quickly and accurately identify internal or external current faults. Simulation results show that the proposed algorithm can meet the requirements of rapidity, selectivity, and reliability and is not affected by transition resistance and fault inception angles, so it has an application prospect to a certain degree.
1 Introduction
The traction direct power supply system is a unique branch of the power system, but suffers high failure frequency due to its complicated deployment environment, such as bad geographic environment, complex weather conditions, locomotive load, and lightning stroke. At the same time, traction network has high requirements for power supply reliability. For this reason, its relay protection scheme must have specific capabilities to quickly and accurately identify the faults.
Relay protection schemes and fault location methods based on traveling wave and transient signals have achieved great success in the deployment of transmission and distribution lines. Deng et al. (2018), Biswas and Milanfar, (2016) and Li et al. (2019) based on time–frequency correlation of fault waveform characteristics put forward a time–frequency matrix constructed by fault waveform of continuous wavelet transform and S-transform, and by it, they believe that the internal and external faults of transmission line could be distinguished; Wang et al. (2019) and Zhen et al. (2019), with the help of cosine similarity of transient current waveform to construct a flexible DC distribution system, give a scheme for outgoing feeder protection of new energy station. Based on the correlation characteristics of fault waveforms, Li Z. et al. (2018) and Hongchun et al. (2012) propose using waveform coefficient to distinguish internal and external faults; Li et al. (2019), based on the waveform similarity of forward and reverse differential currents, state that the fault location information can be accessed by analysis of the Pearson coefficient. In recent years, many researchers in this field have analyzed the propagation characteristics of fault traveling wave in the traction network line and appealed that the research of fault traveling wave and fault located of traction network should be conducted as a whole (Xue et al., 2012; Xiong et al., 2019; Pan et al., 2014). However, fault traveling wave and fault transient signal have not been widely used in the protection of traction network. As transient protection is of the advantages of stability, reliability, and rapidity, it would be a new attempt to apply it to traction network.
The penetrating co-phase traction direct power supply system and capacitance are paralleled at every outlet of traction substations for filtering, and the paralleled capacitance would create wave impedance discontinuity. The waveform detected at the relay location is the transient signal generated by the fault point, and after repeated folding, reflection, (Shen et al., 2021; Shen and Raksincharoensak, 2021a) and refraction, it is superimposed according to a certain time sequence. The traction network and line boundary exert a certain attenuation effect on the fault transient signal, which is why the amplitude of waveform (Shen et al., 2020a; Shen et al., 2020b; Zhang et al., 2021) at both ends of the line is different when the fault location is different. The polarity of the signal detected at both ends of the device is different (Shen and Raksincharoensak, 2021b; Shen et al., 2022) when the fault location is different. The cosine similarity is used to represent the difference of waveform at both ends of the line. When the information about the reflection and refraction, arrival time sequence, attenuation degree, polarity, and other relevant factors of waveforms at both ends of the line are roughly the same, the waveform similarity is high, and the cosine similarity is large. Otherwise, the cosine similarity is small. Taking advantage of the (Han et al., 2016; Li B. et al., 2018) abovementioned characteristics, the pilot protection of traction network in the traction direct power supply system could be constructed on the basis of the similarity of current waveform.
Synchronous squeeze wavelet transform (SWT) compresses the time–frequency map after wavelet transform in the frequency domain direction (Li et al., 2021; Liu et al., 2020), and its time–frequency curve is clearer and the decomposition result remains approximately unchanged, which is conducive to solving the mode mixing problem and is more accurate than taking wavelet transform, S-transform, and other methods (Duan et al., 2019; Yu et al., 2017a).
This study studies the unique structure of the traction direct power supply system. Based on the transmission characteristics and attenuation function of transient waveform, it analyzed the similarity of the current waveforms at both ends of the traction network interior line faults and adjacent line faults and proposed a new method of the line protection based on synchronous squeeze wavelet and waveform similarity, whereby the internal and external faults can be quickly and accurately identified. The scheme uses cosine similarity of waveform at both ends of the line to form the protection criterion, making effective use of the waveform characteristics and making the protection more reliable, and is not affected by the transition resistance and the initial angle of the fault. It is the first time this method and the traction system have been combined. With the help of simulation software PSCAD/EMTDC, the model of the penetrating co-phase traction direct power supply system could be constructed for effective algorithm verification.
2 Structure and Boundary of the Penetrating Co-Phase Traction Direct Power Supply System
2.1 Penetrating Co-Phase Traction Direct Power Supply System
The structure of the penetrating co-phase traction direct power supply system is shown in Figure 1. The system is mainly composed of public power grid, traction substation, traction network, and electric locomotive. The three-phase alternating current of the public power grid outputs a single-phase alternating current with equal amplitude and same phase through rectifier operation and inverter operation of traction substation (Li, 2014). Usually, the length of the line between two traction substations is 30–35 km. In this study, 35 km is adopted.
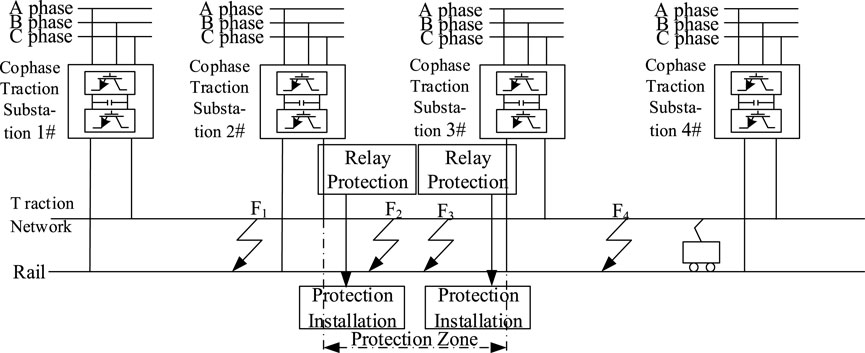
FIGURE 1. Penetrating co-phase traction direct power supply system.
2.2 Boundary of Traction Network
Connection method of co-phase traction substation and traction network is shown in Figure 2. The capacitors at the outlet are connected in parallel with the traction network to reduce the harmonic content entering the traction network and improve the power quality of the traction network lines.
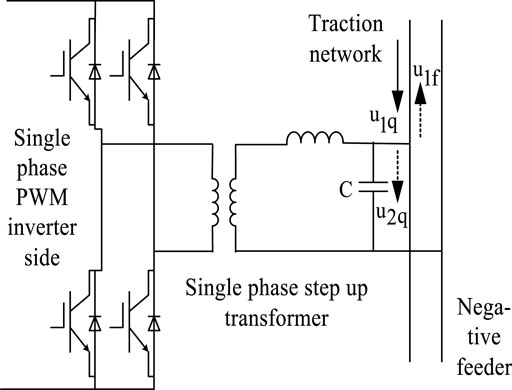
FIGURE 2. Connection method of co-phase traction substation and traction network.
The capacitance connected in parallel with traction network shows low impedance to high frequency current. Thus, it is of certain boundary characteristics. When the fault current passes through the boundary of the traction network, a part of the fault current flows into the capacitors, which leads to a sharp difference with the fault current detected at the relay location where internal and external fault appears. According to the method from Song et al., 2014, the capacitance at the outlet of traction substation plus-2 meters contact line is set as the line boundary.
According to the composition of traction network boundary of co-phase traction power supply system, the frequency characteristics are analyzed, as shown in Figure 3.

FIGURE 3. Amplitude–frequency characteristics of the traction network boundary.
It can be seen from Figure 3 that fault signals with different frequencies show unequal passage characteristics after passing through the boundary. When the signal frequency is greater than 600Hz, the amplitude of amplitude–frequency characteristic is far less than 1, which indicates that the boundary has a strong attenuation effect on high frequency signal (Shen et al., 2017; Yang et al., 2018; Song et al., 2020).
3 The Analysis of the Fault Current of the Penetrating Co-Phase Traction Direct Power Supply System
Figure 4 is the typical schematic diagram of the traction network line structure, and
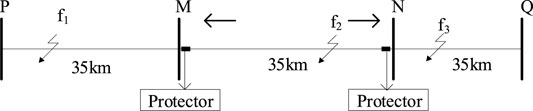
FIGURE 4. Schematic diagram of the traction network line structure.
3.1 Internal Line Fault
When the fault occurs in
When a metallic short-circuit fault occurs, a distance of 15 km form
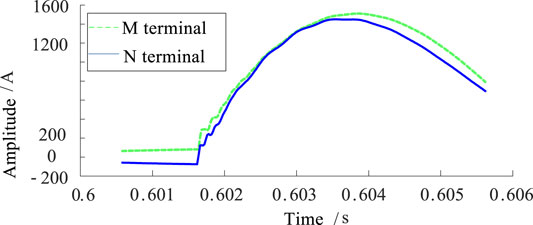
FIGURE 5. Line mode waveform in M and N at the fault in the zone (f2). (A) Forward zone out of fault (
It can be seen from Figure 5 that the waveform of mode component of fault transient current at both ends of the line is basically the same when the fault occurs in the zone.
3.2 Adjacent Line Fault
In case of fault occurring in
When a metallic short-circuit fault occurs, a distance of 35 km forms the forward zone of
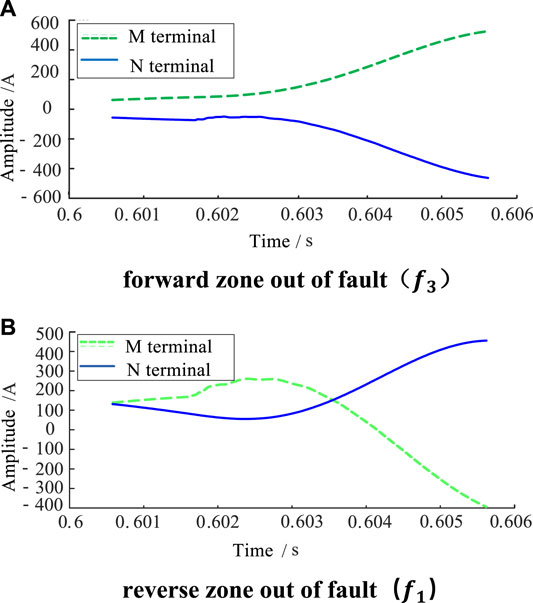
FIGURE 6. Line mode waveform in M and N at the fault outside the zone.
It can be seen from Figure 6 that the waveform of mode component of fault transient current at both ends of the line is opposite and in sharp difference when the fault occurs outside the zone.
To sum up, the waveform of fault current is related to transmission characteristics (refraction and reflection process, attenuation degree, arrival time sequence, change direction) and transmission function. When the fault occurs in the zone, the refraction and reflection process and attenuation characteristics of the transient current are basically the same, the polarity change direction is the same, and the transmission sequence is slightly different, all resulting in local differences in waveform. But generally speaking, the fault transient current waveforms detected at both ends of the line are basically similar. When the fault occurs outside the area, the transient current attenuates through the boundary, the frequency components are different, the refraction and reflection process, the transmission sequence are completely different, and the polarity change direction is opposite. The waveform of fault transient current detected at both ends of the line is significantly different.
4 The Pilot Protection Based on Synchronous Squeezed Wavelet and Waveform Similarity
Based on the above analysis, this article puts forward the transmission line protection principle based on the theoretical basis of the change characteristics of current waveform at both ends and the similarity of transient current waveform.
4.1 Similarity Theory
Cosine similarity is widely applied for information retrieval and data mining. In recent years, many scholars have studied, with cosine similarity, the fault line detection, fault location, and line protection (Li B. et al., 2019; Wang et al., 2019; Li Z. et al., 2018). The cosine value of the angle between two vector inner spaces is used to characterize their similarity, which is known as the follows:
From Eq. 1, it can be concluded that when the direction of two vectors,
If
In the formula,
The value range of
4.2 The Method Based on Synchronous Squeezed Wavelet Transformation
4.2.1 Basic Principles of SWT
Daubechies et al., 2011 and Thakur et al., 2013 proposed when obtained by SWT, the time–frequency curve is of higher clearness, the component precision is higher, and the time–frequency energy is more concentrated (Duan et al., 2019; Yu et al., 2017a). In this case, the composite signal,
The synchronous squeezed wavelet changes on the basis of continuous wavelet, and
After synchronous squeezing of wavelet coefficient,
In this formula,
If
After the reconstruction of the component,
For constant
According to (8), the SWT reconstructed component,
4.2.2 The Signal of Synchronous Squeezed Wavelet Transformation Processing
When SWT is used to process fault transient signal, the steps are as follows:
(1) The result of the continuous wavelet transform processing for composite (Yang et al., 2021a; Yang et al., 2021b; Yang et al., 2022) signal,
(2) Division of frequency interval: if the length of
(2) Division of frequency interval: if the length of
(3) Computing the coefficient of synchronous squeezed wavelet
where
(4) After inverse transform, the reconstructed signal,
where
4.3 Protection Scheme
The basic flow chart of traction network protection algorithm using synchronous squeezed wavelet transformation and waveform similarity is shown in Figure 7.
(1) Start
(2) After the procedure has started, the fault transient current under the data window at both ends of the line is collected and decoupled. Selecting a mode component, the reconstructed signal
(3) If the similarity between the two ends is greater than the set threshold,
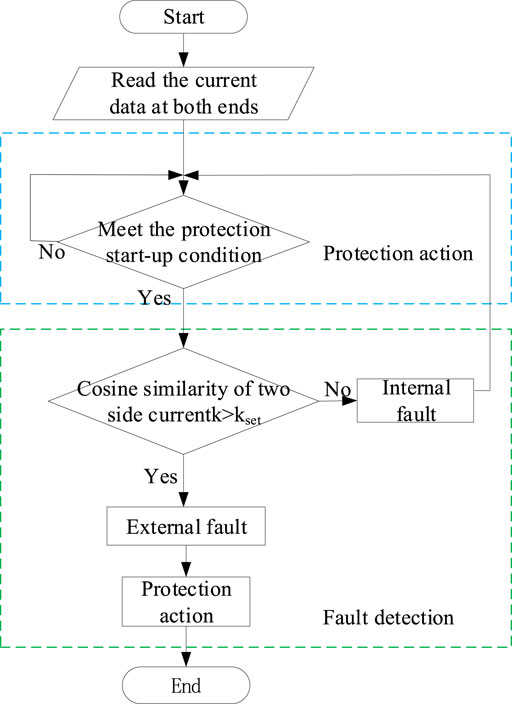
FIGURE 7. Protection scheme flowchart.
Considering the influence of test error, communication delay, noise and other factors, the constant is set as 0.6, that is,
5 Simulation Verification and Analyzing
With the help of simulation software PSCAD/EMTDC, the model of the penetrating co-phase traction direct power supply system can be constructed, as shown in Figure 1.
The line between No.1 and two of traction substation, that is the section of
5.1 The Analysis of Internal and External Faults in Different Locations
In order to simulate and analyze the effectiveness of the protection scheme at different fault locations, assuming metal grounding short-circuit faults occur at

TABLE 1. Cosine similarity at different fault locations.
As shown in Table 1, in case of fault in the zone, the waveform similarity of both sides of the line is close to 1, indicating that the current waveform on both sides of the line is highly correlated; when the fault occurs outside the zone, value of waveform similarity is close to -1, indicating that the current waveform on both sides is negatively correlated. It can be seen from Table 1 that the internal and external faults can be accurately identified by the calculation results of cosine similarity.
5.2 The Identification of Internal and External Faults Under Different Transition Resistances
As simulated analysis of effectiveness of the protection scheme, the transition resistances are
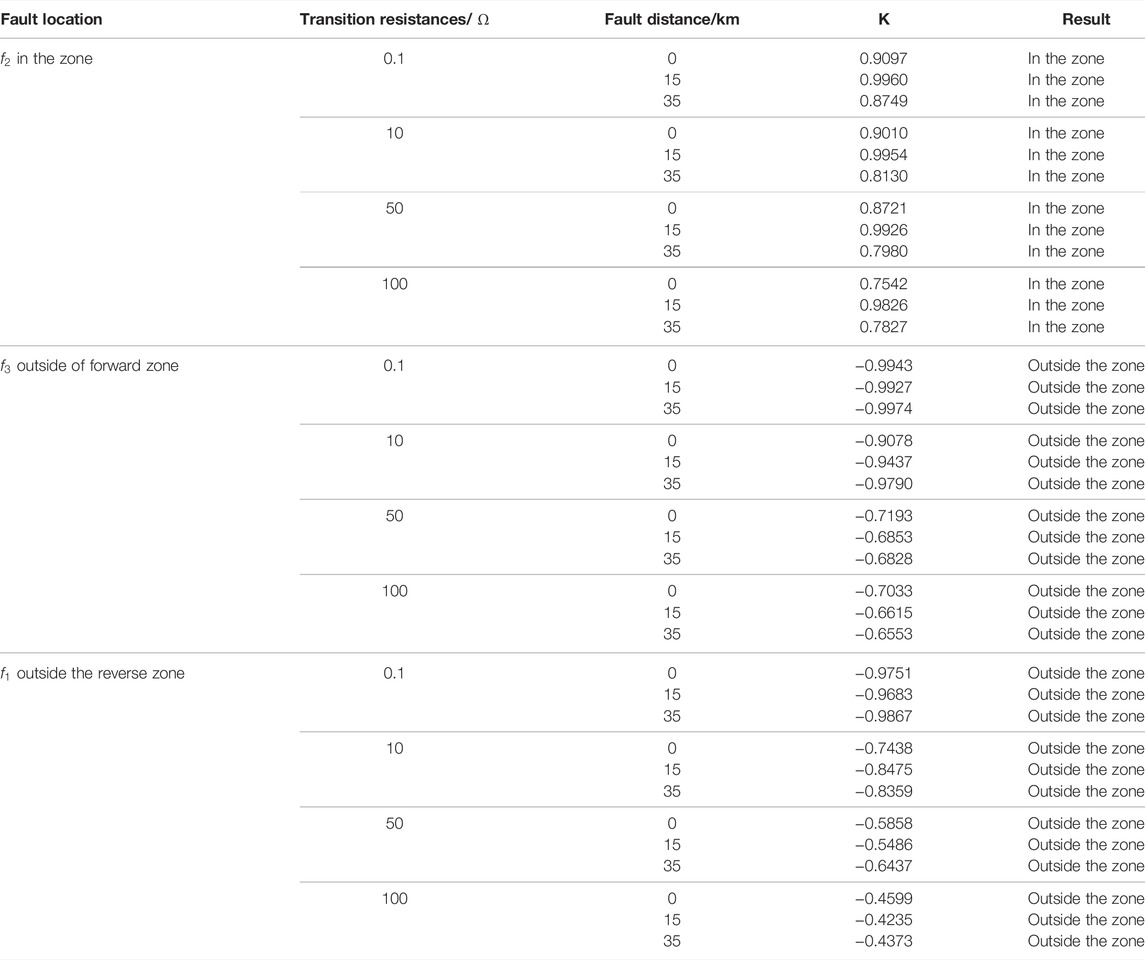
TABLE 2. Cosine similarity under different transition resistances.
The waveform similarity calculation results of different fault locations under different transition resistances are shown in Figure 8.
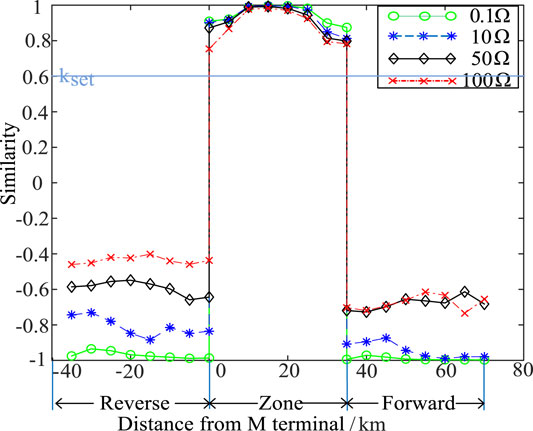
FIGURE 8. Similarity under different transition resistances.
In Figure 8, the abscissa is the distance from the fault point to the protection device,
5.3 The Identification of Internal and External Faults at Different Fault Inception Angles
The effectiveness of the protection scheme is analyzed when the fault inception angles are
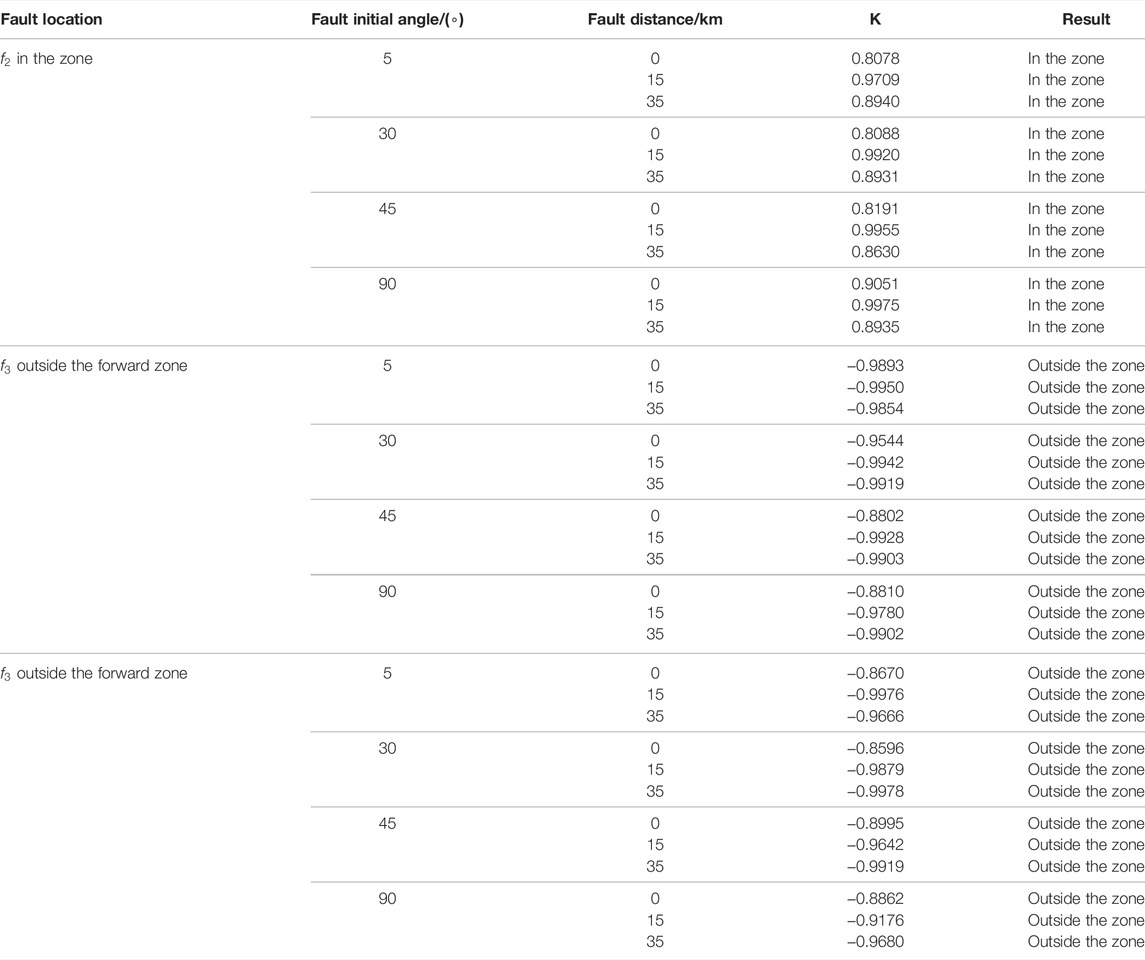
TABLE 3. Cosine similarity under different fault initial angles.
The waveform similarity calculation results of different fault locations at different fault inception angles are shown in Figure 9.
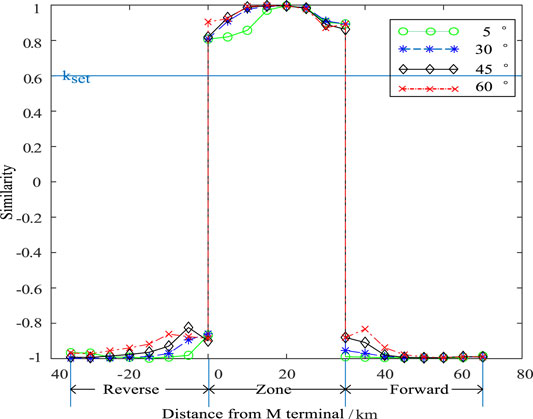
FIGURE 9. Similarity at different initial fault angles.
It can be seen from Table 3 and Figure 8 that, at different fault inception angles, the similarity of current waveforms at both ends is greater than 0.6 in the case of internal fault, and much less than 0.6 in the case of external fault.
It can be seen from Figures 8, 9 that the similarity value of the fault in the zone is greater than the threshold value, and that of the fault outside the zone is less than the threshold value. When the fault occurs at different initial fault angles, faults can be correctly identified by the protection scheme, which shows that the protection scheme is less affected by the initial fault angle.
From the above simulation results, it can be seen that this protection scheme based on synchronous squeezed wavelet and waveform similarity can accurately identify the internal and external faults when they occur at different fault locations, under different transition resistances, and at different fault initial angles, so as to reliably protect the line.
6 Conclusion
In this article, the propagation characteristics of fault transient current in the penetrating co-phase traction power supply system during internal and external faults are analyzed, and a protection scheme for the co-phase traction direct power supply system based on synchronous squeezed wavelet transformation and waveform similarity is proposed. The theoretical analysis and simulation results show the following:
(1) The scheme has the advantages of short time window, easy calculation, and good rapidity
(2) The waveform of fault transient current detected at both ends is basically the same and the polarity change direction is the same as well in the case of internal fault; as for external fault, the waveform of fault transient current detected at both ends is quite different, and the polarity change direction is opposite
(3) The synchronous squeezed wavelet transform can achieve lossless and invertible transformation, and the processed fault transient current can accurately represent the fault information
(4) A large number of simulation experiments show that the protection scheme based on synchronous squeezed wavelet transform and waveform similarity can quickly and accurately distinguish the internal and external faults and can act reliably at different fault locations, under different transition resistances and at different initial fault angles
Data Availability Statement
The original contributions presented in the study are included in the article/Supplementary Material; further inquiries can be directed to the corresponding author.
Author Contributions
SC was responsible for methodology, formal analysis, and validation. WZ was responsible for review and supervision and contributed to the conception and design of the study. ZZ was responsible for simulation, data analysis, and manuscript writing. HL and PL wrote sections of the manuscript. GB and CX were responsible for the derivation of the formula. All authors have read and approved the final version.
Funding
This work was supported by the National Natural Science Funds of China (No. 51767012).
Conflict of Interest
Authors HL and CX were employed by the company Yunnan Power Grid Co., Ltd.
The remaining authors declare that the research was conducted in the absence of any commercial or financial relationships that could be construed as a potential conflict of interest.
Publisher’s Note
All claims expressed in this article are solely those of the authors and do not necessarily represent those of their affiliated organizations, or those of the publisher, the editors, and the reviewers. Any product that may be evaluated in this article, or claim that may be made by its manufacturer, is not guaranteed or endorsed by the publisher.
References
Biswas, S. K., and Milanfar, P. (2016). One Shot Detection with Laplacian Object and Fast Matrix Cosine Similarity. IEEE Trans. Pattern Anal. Mach. Intell. 38 (3), 546–562. doi:10.1109/tpami.2015.2453950
Daubechies, I., Lu, J., and Wu, H.-T. (2011). Synchrosqueezed Wavelet Transforms: An Empirical Mode Decomposition-like Tool. Appl. Comput. Harmonic Anal. 30 (2), 243–261. doi:10.1016/j.acha.2010.08.002
Deng, F., Li, X., Zeng, X., Leng, Y., Ni, J., Ma, S., et al. (2018). Research on Single-End Traveling Wave Based Protection and Fault Location Method Based on Waveform Uniqueness and Feature Matching in the Time and Frequency Domain[J]. Proc. CSEE 38 (05), 1475–1487. doi:10.13334/j.0258-8013.pcsee.170899
Duan, J., Li, H., Yang, L., and Zhao, Z. (2019). Transient-based Directional Protection Using Synchrosqueezing Wavelet Transforms for AC Transmission Lines in HVAC/DC Hybrid System[J]. Proc. CSEE 39 (13), 3833–3842. doi:10.13334/j.0258-8013.pcsee.180669
Han, L., Zhang, J., and Huang, Z. (2016). Surface Wave Removal with Synchrosqueezing Wavelet Transform[J]. Oil Geophys. Prospecting 51 (01), 71–79+19. doi:10.13810/j.cnki.issn.1000-7210.2016.01.010
Hongchun, S., Xincui, T., Jun, D., Guangbin, Z., Yi, Y., and Shiyun, S. (2012). Identification between Internal and External Faults of ±800kV HVDC Transmission Lines Based on Voltage Correlation[J]. Proc. CSEE 32 (04), 151–160+5. doi:10.13334/j.0258-8013.pcsee.2012.04.022
Li, B., Zhang, J., Liu, H., and Li, H. (2019). Fault Location of HVDC Transmission Lines Based on Waveform Similarity Analysis[J]. Electric Power Automation Equipment 39 (09), 27–32+53. doi:10.16081/j.epae.201909001
Li, B., Qiu, H., Chao, H., Zhang, Y., and Jiang, Y. (2018). High-speed Direction protection of Flexible DC System Based on Voltage Source Converter[J]. Electric Power Automation Equipment 38 (02), 1–8. doi:10.16081/j.issn.1006-6047.2018.02.001
Li, Q. (2014). On New Generation Traction Power Supply System and its Key Technologies for Electrification Railway[J]. J. Southwest Jiaotong Univ. 49 (04), 559–568. doi:10.3969/j.issn.0258-2724.2014.04.001
Li, Z., He, Z., Guo, T., et al. (2019). Transient Protection Method for Transmission Lines Based on Similarity of Time-Frequency Matrix[J]. Automation Electric Power Syst. 43 (05), 121–134. doi:10.7500/AEPS20180806002
Li, Z., Guo, T., Zeng, X., Fan, C., and Xiong, Y. (2018). Wave Correlation Analysis Based Transient Protection Method for Transmission Lines[J]. Proc. CSU-EPSA 30 (08), 44–50. doi:10.3969/j.issn.1003-8930.2018.08.008
Li, Z., Jiang, W., Abu-Siada, A., Li, Z., Xu, Y., and Liu, S. (2021). Research on a Composite Voltage and Current Measurement Device for HVDC Networks. IEEE Trans. Ind. Electron. 68 (9), 8930–8941. doi:10.1109/tie.2020.3013772
Liu, Y., Yang, N., Dong, B., Wu, L., Yan, J., Shen, X., et al. (2020). Multi-Lateral Participants Decision-Making: A Distribution System Planning Approach with Incomplete Information Game. IEEE Access 8, 88933–88950. doi:10.1109/access.2020.2991181
Pan, D., Tian, L., and Zhou, H. (2014). Characteristics of Travelling Wave Propagation in Catenary of High-Speed Railway[J]. J. China Railway Soc. 36 (02), 25–30. doi:10.3969/j.issn.1001-8360.2014.02.004
Shen, X., Ouyang, T., Khajorntraidet, C., Li, Y., Li, S., and Zhuang, J. (2022). Mixture Density Networks-Based Knock Simulator. Ieee/asme Trans. Mechatron. 27, 159–168. doi:10.1109/TMECH.2021.3059775
Shen, X., Ouyang, T., Yang, N., and Zhuang, J. (2021). Sample-based Neural Approximation Approach for Probabilistic Constrained Programs. IEEE Trans. Neural Netw. Learn. Syst., 1–8. doi:10.1109/TNNLS.2021.3102323
Shen, X., and Raksincharoensak, P. (2021a). Pedestrian-aware Statistical Risk Assessment. IEEE Trans. Intell. Transport. Syst., 1–9. doi:10.1109/TITS.2021.3074522
Shen, X., and Raksincharoensak, P. (2021b). Statistical Models of Near-Accident Event and Pedestrian Behavior at Non-signalized Intersections. J. Appl. Stat doi:10.1080/02664763.2021.1962263
Shen, X., Zhang, Y., Sata, K., and Shen, T. (2020a). Gaussian Mixture Model Clustering-based Knock Threshold Learning in Automotive Engines. IEEE/ASME Trans. Mechatron. 25 (6), 2981–2991. doi:10.1109/TMECH.2020.3000732
Shen, X., Zhang, X., Ouyang, T., Li, Y., and Raksincharoensak, P. (2020b). Cooperative Comfortable-Driving at Signalized Intersections for Connected and Automated Vehicles. IEEE Robot. Autom. Lett. 5 (4), 6247–6254. doi:10.1109/LRA.2020.3014010
Shen, X., Zhang, Y., Shen, T., and Khajorntraidet, C. (2017). Spark advance Self-Optimization with Knock Probability Threshold for Lean-Burn Operation Mode of SI Engine. Energy 122, 1–10. doi:10.1016/j.energy.2017.01.065
Song, G., Hou, J., Guo, B., and Chen, Z. (2020). Pilot protection of Hybrid MMC DC Gridbased on Active Detection. J. Prot. Control. Mod. Power Syst. V5 (1), 82–96. doi:10.1186/s41601-020-0152-2
Song, G., Ran, M., Xu, C., Jin, X., Liu, T., and Ma, Z. (2014). A New Single-End Current Based Whole-Line Quick-Action Protection for VSC-HVDC Transmission Lines[J]. Power Syst. Techn. 38 (05), 1402–1407. doi:10.13335/j.1000-3673.pst.2014.05.043
Thakur, G., Brevdo, E., Fučkar, N. S., and Wu, H.-T. (2013). The Synchrosqueezing Algorithm for Time-Varying Spectral Analysis: Robustness Properties and New Paleoclimate Applications. Signal. Process. 93 (5), 1079–1094. doi:10.1016/j.sigpro.2012.11.029
Wang, C., Jia, K., Bi, T., Zhao, Q., and Zhu, R. (2019). Protection for Flexible DC Distribution System Based on Transient Current Waveform Similarity Identification[J]. Power Syst. Techn. 43 (10), 3823–3832. doi:10.13335/j.1000-3673.pst.2018.2163
Xiong, L., Wu, G., and Wang, Z. (2019). Study on Fault Location of Multi Measuring Points Traveling Wave Method Based on IHHT in All Parallel at Traction Network[J]. Trans. China Electrotechnical Soc. 34 (15), 3244–3252. doi:10.19595/j.cnki.1000-6753.tces.180834
Xue, Y., Duan, J., Xu, B., and Li, J. (2012). Characteristic Analysis of Fault Generated Traveling Waves in Direct Feeding Traction Network[J]. Power Syst. Techn. 36 (04), 167–173. doi:10.13335/j.1000-3673.pst.2012.04.041
Yang, N., Ye, D., Zhou, Z., Cui, J., Chen, D., and Wang, X. (2018). Research on Modelling and Solution of Stochastic SCUC under AC Power Flow Constraints. IET Generation, Transm. Distribution 12 (15), 3618–3625. doi:10.1049/iet-gtd.2017.1845
Yang, N., Huang, Y., Hou, D., Liu, S., Ye, D., Dong, B., et al. (2019). Adaptive Nonparametric Kernel Density Estimation Approach for Joint Probability Density Function Modeling of Multiple Wind Farms. Energies 12, 1356. doi:10.3390/en12071356
Yang, N., Liu, S., Deng, Y., and Xing, C. (2021b). An Improved Robust SCUC Approach Considering Multiple Uncertainty and Correlation. IEEJ Trans. Elec Electron. Eng. 16, 21–34. doi:10.1002/tee.23265
Yang, N., Yang, C., Wu, L., Shen, X., Jia, J., Li, Z., et al. (2022). Intelligent Data-Driven Decision-Making Method for Dynamic Multisequence: An E-Seq2Seq-Based SCUC Expert System. IEEE Trans. Ind. Inf. 18, 3126–3137. doi:10.1109/TII.2021.3107406
Yang, N., Yang, C., Xing, C., Ye, D., Jia, J., Chen, D., et al. (2021a). Deep Learning‐based SCUC Decision‐making: An Intelligent Data‐driven Approach with Self‐learning Capabilities. IET Generation Trans. Dist 16, 629–640. doi:10.1049/gtd2.12315
Yu, M., Wang, B., Chen, X., Wang, W., and Jin, J. (2017b). Application of Synchrosqueezed Wavelet Transform for Extraction of the Oscillatory Parameters of Low Frequency Oscillation in Power Systems[J]. Trans. China Electrotechnical Soc. 32 (06), 14–20. doi:10.19595/j.cnki.1000-6753.tces.2017.06.003
Yu, B., Wang, B., Wang, W., Zhang, L., Cheng, Y., et al. (2017a). Power System Time-Varying Transient Harmonics Detection Based on SWT[J]. Trans. China Electrotechnical Soc. 32 (S1), 50–57. doi:10.19595/j.cnki.1000-6753.tces.L70483
Zhang, L., Xie, Y., Ye, J., Xue, T., Cheng, J., Li, Z., et al. (2021). Intelligent Frequency Control Strategy Based on Reinforcement Learning of Multi-Objective Collaborative Reward Function. Front. Energ. Res doi:10.3389/fenrg.2021.760525
Keywords: penetrating co-phase traction direct power supply system, synchronous squeezed wavelet transformation, cosine similarity, traction network, transient protection
Citation: Chen S, Zhang Z, Liu H, Bi G, Xing C, Li P and Zhang W (2022) Traction Network Protection Based on Similarity of Transient Current Waveform. Front. Energy Res. 10:865602. doi: 10.3389/fenrg.2022.865602
Received: 30 January 2022; Accepted: 03 March 2022;
Published: 31 March 2022.
Edited by:
Xun Shen, Tokyo Institute of Technology, JapanReviewed by:
Sandeep Kumar Duran, Lovely Professional University, IndiaSahil Sardana, Indian Institute of Technology, Dhanbad, India
Copyright © 2022 Chen, Zhang, Liu, Bi, Xing, Li and Zhang. This is an open-access article distributed under the terms of the Creative Commons Attribution License (CC BY). The use, distribution or reproduction in other forums is permitted, provided the original author(s) and the copyright owner(s) are credited and that the original publication in this journal is cited, in accordance with accepted academic practice. No use, distribution or reproduction is permitted which does not comply with these terms.
*Correspondence: Wenying Zhang, a216d3lpbmdAc2luYS5jb20=