 Lin Xu1*
 Xiaoting Cai
- 1Electric Power Research Institute, State Grid Sichuan Electric Power Company, Chengdu, China
- 2School of Electric Engineering, Southwest Jiaotong University, Chengdu, China
The guidance of EV via a price-based demand response is of great significance to the security and economy of the distribution network. However, the current price-based demand response mechanisms fail to consider the spatial-temporal distribution of large-scale EVs connected to the distribution network. For tackling this challenge, this paper proposes a day-ahead economic dispatch strategy for distribution networks considering total cost price-based demand response. A two-layer model of the day-ahead economic dispatch for the distribution network is utilized to obtain the interactive calculation framework for the total cost price. The total cost price iterates between the economic dispatch model of the distribution network and the total cost price-based demand response model until no significant changes in total cost price are observed. Among them, the price-responsive load considers spatial-temporal shift of the EV charging load. Finally, simulation study case based on a modified IEEE 33-bus system is employed to demonstrate the effectiveness of this strategy for the economic operation of the distribution network.
1 Introduction
Facing the increasingly serious energy shortage and environmental pollution problems, EVs have been vigorously developed as a low-carbon and clean means of transportation (Selvam et al., 2016). The access of large-scale EVs to the distribution network brings flexible resources to the optimal operation of the distribution network, but it also brings challenges to the security and economy of the distribution network. A large-scale EV connected to the power grid has the attributes of spatiotemporal distribution. The change of spatiotemporal distribution of its charging behavior will have an obvious impact on the power flow of the distribution network. In order to help the distribution network better accept EVs, it is necessary to guide the charging and discharging behavior of EVs in time and space. The electricity price mechanism is an important means of guidance (Liu et al., 2014). At the same time, in the electricity market environment, the key to guide EVs through electricity price is to coordinate the economy of distribution network and EV users. The distribution network guides the charging period of EVs to the low-cost period and the charging place to the low-cost charging station node by formulating the electricity price with time-space attribute, so as to improve the economic benefits of the distribution network and reduce the charging cost of users. Therefore, it is necessary to propose a distribution network price pricing mechanism with spatial-temporal attribute, which guides EVs and controllable loads to respond to the demand of distribution network and realizes the win-win situation between distribution network and users.
At present, the pricing research considering the demand response of EVs and controllable loads is mainly from the perspective of improving users’ comfort and economic benefits. Liu Q. designed a pricing scheme that considers fluctuating costs. A demand response strategy for controllable loads and EV charging loads is proposed to optimize user electricity costs and stabilize power system load fluctuations (Liu et al., 2018). Ali S. proposed a user power mode scheduling method based on real-time price (RTP) signals, which aims to reduce power cost, peak-to-average ratio, and carbon emissions, and improve user comfort (Ali et al., 2021). Gazafroudi A. S. Amin Shokri. proposed a day-ahead and real-time two-stage stochastic model, and simulates smart home demand response schemes based on critical peak pricing (CPP), RTP, and time-of-use (TOU) price signals. Simulation results show that smart homes participate in the TOU price scheme with the greatest economic benefits (Gazafroudi et al., 2019). De Sá Ferreira Rafael. established a TOU price model based on secondary programming secondary constraints and stochastic optimization technology. This TOU price model can promote economic efficiency and improve system load structure (de Sá Ferreira et al., 2013). Most of the pricing methods for guiding load optimization are only considered from the time dimension. By formulating TOU prices, RTP, dynamic TOU prices, etc., the translation of the usage period of EVs and controllable loads are realized. In reality, however, EVs, as a mobility tool, can choose charging locations under the guidance of space electricity prices. Therefore, it is necessary to propose a pricing method for the distribution network that considers the flexibility of both the time and space dimensions of EVs.
Distribution location marginal price (DLMP) is a pricing method with spatiotemporal attributes, which can guide the interaction between the distribution network and various resources in the distribution network, reasonably allocate the resources of the distribution network, and improve the economic benefits of the operation of the distribution network. Mohsenzadeh. proposed a smart home management system optimization model, using DLMP to replace the time-based pricing mechanism, and incentivizing users to change their energy consumption habits through price (Mohsenzadeh and Pang, 2018). Canizes. formulated the dynamic charging price of electric vehicles based on DLMP, simulated the impact of price on EV behavior, and found that it greatly saved the cost of DSO and EV users (Canizes et al., 2019). Wei. proposed a DLMP method based on a three-phase current injection for robust convergence of optimal power flow. This method takes into account the participation of distributed generation (DG) and demand response, which enables DSO to obtain higher operational benefits (Wei et al., 2019).
However, in the above study, the calculation of DLMP is only the marginal power generating cost and does not take into account the fixed cost of power distribution. Under the incomplete electricity price signal, the DSO cannot recover the investment cost of distribution network construction, so the DSO cannot maximize its economic benefits. Wang proposed an electricity price mechanism that considers the allocation of transmission costs and rationally allocates the costs of the transmission grid based on the power flow tracking method (Wang et al., 2017). On this basis, this paper applies the method to the distribution network layer. The distribution cost based on the power flow tracking method can reflect the spatial cost of the node load of the distribution network, and the power generation cost based on the power flow tracking method can reflect the relationship between the distribution network load and the market electricity price in the time dimension. Therefore, the total cost price formed by the superposition of the distribution cost and the generation cost based on the power flow tracking method has spatiotemporal attributes.
In addition, the existing research on the optimal operation of distribution network with EVs mainly uses the dispatchable load demand response in the distribution network to improve the economics of the distribution network. Xiao. proposed a scheduling optimization model of an active distribution network considering demand response uncertainty with the minimum operating cost as the goal (Xiao et al., 2020). Li. proposed an economic dispatch method for energy storage in the distribution network to mitigate the impact on the security of the distribution network due to the proliferation of EVs and DG (Li et al., 2020). Cheng. proposed a dynamic multi-objective optimal dispatch problem to integrate with the TOU price-based demand response for optimal distribution network dispatch (Cheng et al., 2022). However, the above research ignores the economic dispatching between the load and the power supply through the interaction of electricity price.
Based on the above research and analysis, this paper proposes a day-ahead economic dispatch strategy for distribution networks considering total cost price-based demand response. Firstly, the spatial-temporal distribution model of aggregated EV load is established to determine the EV delay charging aggregation of EVs in each node; Secondly, a spatial-temporal price mechanism of distribution network is designed, and the calculation method of the total cost price of distribution network considering the spatial-temporal characteristics of EV charging load is given; Then, based on the spatial-temporal electricity price mechanism and combined with the demand response of controllable load, the day ahead economic dispatching strategy of distribution network with EVs is established. This strategy can deeply encourage users to participate in the demand response of distribution network and improve the economy of distribution network and users.
The main contributions of this paper are as follows.
a) According to the mathematical relationship between EV charging capacity and time, the charging power boundary of a single EV is obtained. Based on this, the connected EVs are aggregated into charging clusters in nodes.
b) The proposed spatiotemporal electricity price mechanism uses the power flow tracking method to calculate the total cost price. Compared with the traditional DLMP, it increases the variation of electricity price in the spatial dimension, and fully considers the spatiotemporal flexibility of EVs.
c) EVs and controllable loads respond to the demand according to the total cost price with spatiotemporal attributes, and then the distribution network optimizes the power generation resources according to the spatiotemporal distribution of demand response load. The load side and grid side continue to interact and iterate, to realize the optimal power generation and consumption distribution of distribution network, and improve the economic benefits of distribution network operators and reduce users’ electricity costs.
The paper is structured as follows. Section 2 establishes the spatiotemporal distribution model of aggregated EV load. Section 3 proposes a DSO’s electricity price mechanism with spatiotemporal guidance Section 4 gives a detailed description of the day-ahead economic dispatch strategy of the distribution network. Section 5 explains the method and process of model solving. Section 6 illustrates the effectiveness of the strategy by the simulation analysis of the IEEE 33-bus system example. Section 7 summarizes the major findings of this paper.
2 Aggregated EV Load Spatiotemporal Distribution Model
Urban areas can be divided into residential areas, work areas, and business areas according to their functional positioning. The distribution of the EV on-grid and off-grid time is closely related to the area in which it is located (Fernandez et al., 2010). According to the travel behavior characteristics of private car users, the Monte Carlo method is used to simulate the charging demand of EV users, and the spatiotemporal distribution of EV charging load is predicted. For the distribution of the EV charging sampling parameters, see Appendix Table A2.
Single EV Charging Requirements
where
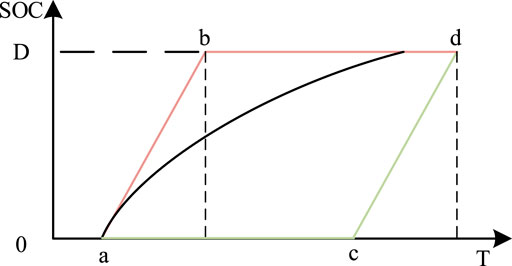
FIGURE 1. Energy boundary diagram of a single EV.
The energy boundary of aggregated EVs is obtained by superimposing the energy boundary of a single EV. Therefore, aggregated EVs charging power meets the following constraints:
where
3 Price Mechanism Considering the Spatiotemporal Characteristics of Load
3.1 Day-Ahead Pricing Framework for the DSO
Figure 2 shows the DSO to participate in the electricity market operational framework. In this paper, the DSO can not only participate in the day-ahead market on the upper transmission side as a power market entity, but also optimize the flexible resources in the dispatching area and realize its own economic operation.
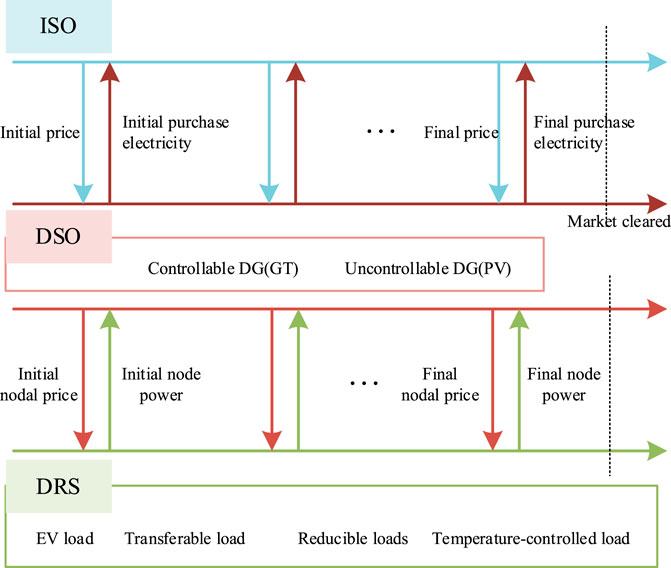
FIGURE 2. Day ahead pricing framework for the DSO.
Since the DSO does not know the electricity price information of the next trading day before the market clears, it needs to predict the electricity price based on historical data and the forecast information of the next trading day. The predicted price is used as the electricity purchase price for the DSO to purchase electricity from the independent system organization (ISO). In order to minimize its operating costs, the DSO formulates its power purchase plan, regional DG power output plan, and the initial total cost price. Under the electricity price signal provided by the DSO, the demand response system (DRS) issues instructions to various controllable devices to adjust the user’s power and reports the optimized preliminary energy demand plan in units of nodes to DSO. Based on the electricity demand plan reported by the DRS, the DSO formulates a new round of power purchase plan, DG power output plan, and total cost price. The DRS re-optimizes the user scheduling according to the new round of electricity price information given. This is repeated until the power demand plan submitted by the DRS can maximize the economic benefits of the DSO.
The electricity demand submitted by the DSO will have an impact on the market clearing price. Therefore, this paper uses a linear model of price and demand to predict market clearing prices (Huang et al., 2014; Verzijlbergh et al., 2012).
The market electricity price model is as follows:
where
3.2 Electricity Price Mechanism Considering the Spatiotemporal Distribution of Loads
The spatiotemporal distribution of load is determined by the power consumption behavior of users. The electricity consumption behavior of users is affected by the nodal price, which can be divided into two levels: time and space. In terms of time, the charging period of EVs and the use period of transferable load are transferred to the low price period. In the terms of space, low price charging pile is selected for electric vehicle charging. The charging needs of EVs are closely related to the travel needs of users. Therefore, the charging behavior of EVs is mainly located in residential areas, work areas and business areas.
The following two steps illustrate the guidance of the DSO’s electricity price mechanism on the spatiotemporal distribution of EV loads.
1) To predict the spatiotemporal distribution of aggregated EV loads
According to the load model in Section 2, the spatiotemporal distribution of EV charging load is calculated based on the urban functional area, and the electric vehicle load in each area is obtained.
2) To formulate an electricity price guidance strategy
According to the nodal price released by DSO, EVs in the same area are guided to choose charging stations with short queuing time and low electricity price at the node where they are located.
3.3 Total Cost Price
Wang proposed a cost allocation method for transmission grids based on the power flow tracking method (Wang et al., 2017). This paper applies it to the distribution network level to calculate the total cost price. The total cost price of the distribution network is composed of two parts: the cost of power generating and the cost of power distribution.
3.3.1 Generating Cost
The power resources in DSO include the power purchased from ISO and the self-built DG. Regarding the power purchase nodes and nodes of DG in the distribution network as power generation nodes. The generating cost component of the total cost price can be derived according to the power flow tracking method. The process is as follows.
The relationship between the electricity demand of any node in the distribution network and the power generating node
where
The unit generating cost of the load node
where
3.3.2 Power Distribution Cost
Power distribution cost is obtained by using the power flow tracking method, which can allocate the fixed cost of the distribution network to each user fairly and reasonably. For the line
For the line
where
According to the power flow tracing method, the contribution of the load at the period time
where
In summary, the total cost price of the load node
4 Day-Ahead Economic Dispatch Strategy For Distribution Network
In order to clarify that the total cost price mechanism of DSO can guide the temporal and spatial distribution of load, a two-level model of day-ahead economic dispatching of the distribution network is established in this section.
The DSO is responsible for the upper-level optimization model. With the goal of the lowest daily operating cost of the DSO, the power purchase plan and the distributed power output plan are determined based on the constraints of the supply and demand balance of the distribution network and the constraints of the DC power flow. Then, the time sequence flow of the distribution network is calculated, according to the power dispatch of the distribution network. The fixed cost of the distribution network is allocated to each user reasonably and fairly, and the total cost price composed of the generation cost and the distribution cost is formed.
The lower model is in charge of DRS. Based on the total cost price issued by the DSO, the goal is to minimize the user’s electricity cost to optimize the controllable load in the dispatch area.
4.1 Upper-Level Optimization Model
4.1.1 Economic Objective Function
This paper establishes the objective function with the lowest operating cost of the DSO in the dispatching period. In the power market environment, the DSO operating costs
4.1.2 Constraints
Optimal dispatch of the distribution network needs to meet various constraints:
1) Energy supply and demand balance constraints:
2) The DG power output constraints:
3) DC power flow constraints:
where
4) Total cost price constraints:
5) Demand response model constraints see the lower-level optimization model.
4.2 Lower Level Optimization Model
The DSO publishes the total cost price information to the DRS. The goal of the DRS to optimize the dispatch of controllable loads in the jurisdiction is to minimize users’ electricity cost.
where
The optimal dispatch model of the DRS is subject to the constraints controllable load (23) to (31) and the aggregated EVs charging load characteristic (3) to (5). After the DRS obtains the power consumption plan of each user, it reports to the DSO on a node basis.
In this section, controllable loads mainly include transferable load (such as washing machines, dishwashers, etc.), reducible load (such as lights, etc.), and temperature-controlled load (such as air conditioning, etc.).
4.2.1 Transferable Load
Transferable load is the device whose operating period can be transferred without interruption, and has constant power during operation. Assuming that the transferable range of the device is
where
4.2.2 Reducible Load
Reducible load refers to the device whose operating period is fixed, and its power can be changed within a certain range. Its range is
4.2.3 Temperature-Controlled Load
Temperature-controlled load is the device that determines the operating time and operating power according to changes in temperature. Taking air conditioner as an example considers that the user has a comfortable range of temperature, which can be expressed as
where
5 Solution Methodology
Total cost price is closely related to DSO’s scheduling plan and nodal load. On the premise of meeting the power demand in the area under its jurisdiction, DSO determines the DSO power purchase plan and the DG power output in the distribution network based on the lowest operating cost of the distribution network. At the same time, under the guidance of the nodal price signal, users continue to adjust electricity consumption to change the spatiotemporal distribution of nodal load, which changes the distribution of power flow and affects the change of electricity price.
Therefore, this paper proposes an iterative algorithm to construct a day-ahead economic dispatch model of the distribution network and determine the DSO power purchase plan based on the electricity market purchase price, the DG power output parameters, and nodal load data, with the goal of the lowest distribution network operating cost. As well as the controllable DG power output plan, the total cost price is calculated according to the results of the power flow. The electricity price signal is used to guide the user’s electricity consumption behavior, which achieves the best operating state of the DSO.
In summary, the iterative solution process of the day-ahead economic dispatch strategy of the distribution network that considers the total cost price-based demand response proposed in this paper is shown in Figure 3. The specific steps are as follows.
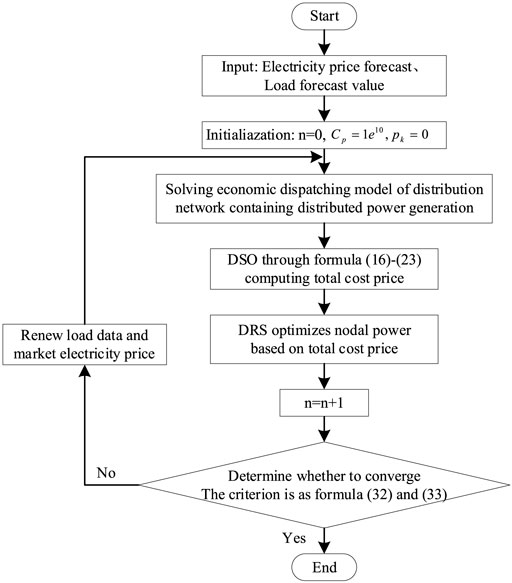
FIGURE 3. Flow chart of solution methodology.
The first step is to input the day forecast nodal load data and the forecast value of the electricity market purchase price. And initialization: Set the initial value of the DSO operating cost
The second step is to solve the economic dispatch model of the distribution network with DG and determine the DSO power purchase plan and the DG power output plan.
The third step is to calculate the total cost price. According to the power dispatch in the network, the total cost price is calculated according to Eqs 16–23.
In the fourth step, the DRS optimizes the dispatch of the controllable load in the area based on the total cost price, and then reports the power plan to the DSO based on the node.
The fifth step is to update
The iteration termination condition is set as:
where
6 Case Study
6.1 Case Introduction
In order to demonstrate the effectiveness of proposed the day-ahead economic dispatch strategy for the distribution network considering the total cost price-based demand response, the modified IEEE 33-bus system is employed to carry out the example analysis of this paper. Based on the original network structure, distributed photovoltaic (PV) and micro gas turbines (GT) have been added. The detailed parameters of DG are shown in Table 1. Distributed PV power output obeys normal distribution (Yan et al., 2018). The area is divided into residential areas, work areas, business areas, and other areas. The distribution network topology and distributed power access locations are shown in Figure 4. The electricity value predicted by DSO based on historical market data is shown in Table 2. The convergence parameters

TABLE 1. Distributed power supply parameters.
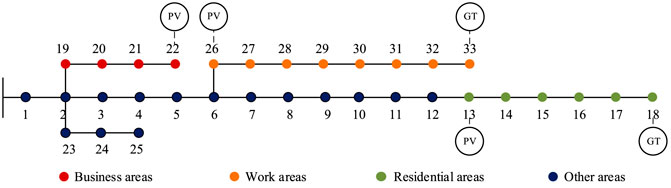
FIGURE 4. The connection of modified IEEE 33-bus system.

TABLE 2. Forecast day-ahead electricity price.
The assumptions in this paper are as follows:
1) Each node in the residential area is given the number of users
2) Each node in the work area and the business area is given the number of charging piles
3) EVs and household appliances in the system use the same parameters (Zhao et al., 2013). The power consumption characteristics and parameters of controllable load equipment and EVs between different load nodes in the same area are the same, and the power consumption characteristics and parameters of the same node are obtained by Monte Carlo sampling. The nodal load curve of each area is shown in Figure 5.
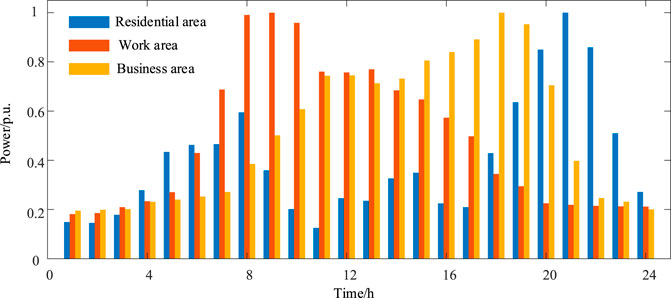
FIGURE 5. Load curve of different regions.
6.2 Total Cost Pricing Calculations
In order to illustrate the influence of DG on the distribution network’s power flow, taking time 20:00 as an example. The DG power output of node 18 and node 33 areboth 200kW, and the power flow distribution of the improved IEEE 33-bus system with DG is shown in Figure 6. This shows that the introduction of DG can change the power flow distribution of the original distribution network.

FIGURE 6. Power flow distribution of the modified IEEE 33-bus system.
The total cost price in this paper includes generating cost and power distribution cost. Among them, since the cost of power distribution is related to the location of the nodal load, the power distribution costs will increase with the increase of the distance from the power source. As shown in Figure 7, the shape of the total cost price curve from node 1 to node 17 is roughly the same, while the magnitude of the electricity price increases in a step-like manner. This is because the nodes from 1 to 17 are all powered by node 1, and the power generation cost is the same. In the case of the same power generation cost, the distribution cost of the node farther from the power supply node is higher, so the total cost price from node 1 to node 17 gradually increases.
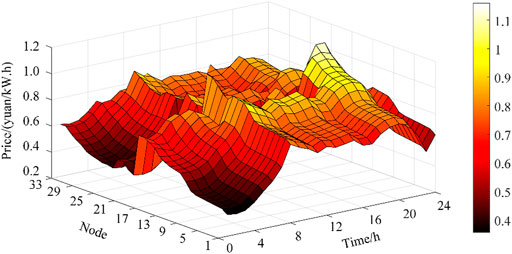
FIGURE 7. Nodal total cost price surface.
6.3 Load Guidance Results
6.3.1 Aggregated EVs Charging Power
The EVs charging load model is used to simulate the charging power of EVs in various regions. The upper and lower limits of the aggregated EVs’ energy in each region and the EV load curve after response are shown in Figure 8. The upper and lower limits are represented by blue and red solid lines respectively.
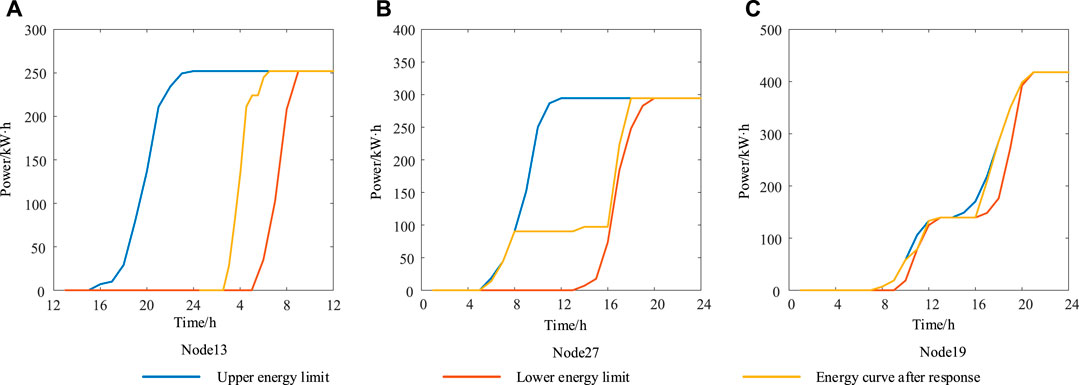
FIGURE 8. Energy curve of aggregated EVs.
Analyzing the simulation results in Figure 8, we can see the distribution of EV charging demand in various regions. For the aggregated EVs charging load in residential areas (taking node 13 as an example) and the aggregated EVs charging load in work areas (taking node 27 as an example), the elastic range of the aggregated EVs charging load is larger from 8:00 a.m. to 17:00. The main reason is the regular commuting behavior of EV users. Among them, the charging period time of EVs in residential areas has changed significantly, which is reflected in the transfer of the charging period time from 15:00 to 23:00 to 2:00 to 6:00. This is because, under the influence of the total cost price incentives, the electricity price is lower in the early morning hours, so the DRS transfers a load of EVs to this period time as much as possible to minimize the charging cost. For the aggregated EVs charging load in the business area (taking node 19 as an example), it can be seen that the elastic range of the aggregated EVs charging load is relatively small. This is because the EVs stay in the business area for a short time, and the degree of dispatch ability is low.
6.3.2 Controllable Load
The controllable load of the residential area includes transferable load, reduced load, temperature control load, and EV charging load. Under the scheduling strategy proposed in this paper, the power situation of the nodal load in the residential area before and after the electricity price guidance is shown in Figure 9.
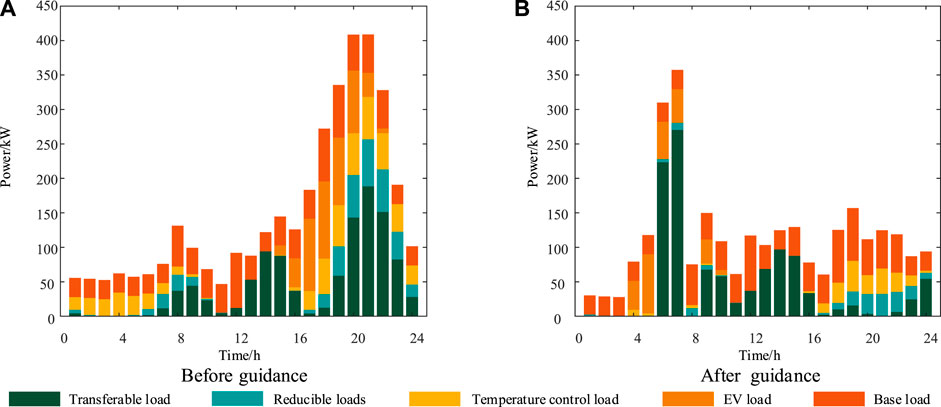
FIGURE 9. Comparisons of residential load before and after guidance.
It can be seen that the load after price guidance is reduced as a whole, because the user’s comfort is sacrificed, so that the power consumption of reducible load and temperature-controlled load is reduced. According to the comparison before and after electricity price guidance, the transferable load is transferred from 18:00 to 24:00 to 0:00 to 3:00 with lower electricity price, which plays a role in smoothing the system load curve.
6.4 Comparison of Economic Benefits of the DSO
According to the data analysis in Table 3, the daily operating cost of the DSO before and after price guidance is reduced by 10.93%. After calculation, the power distribution cost of the distribution network is 17,389.48 yuan, indicating that this strategy can realize the effective recovery of the investment and construction cost of the distribution network.
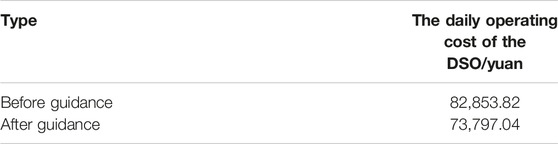
TABLE 3. Daily operating cost comparison.
It can be obtained from Table 4 that after the economic dispatch of the distribution network based on the total cost price, the user electricity cost in the entire distribution network has been reduced to varying degrees. For nodes in residential areas, work areas, and business areas that are connected to flexible loads, such as node 13, node 27, and node 19, the electricity costs can be saved by 27.96, 13.45, and 23%, respectively.
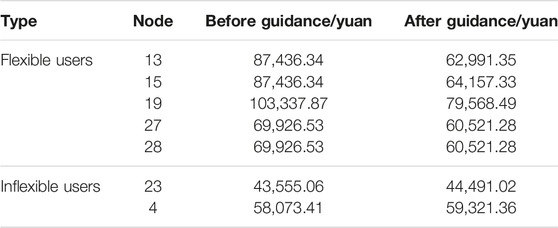
TABLE 4. Electricity cost of some nodes in the distribution network.
It can be obtained from Table 4 that for flexible users, such as nodes 15, 19, 28, after the total cost price is guided, the electricity costs are all reduced, and the costs are saved by 26.62, 23.00, and 13.45%, respectively. The reduction effect is significant. For inflexible users, such as nodes 23, and 4, since they do not participate in electricity price guidance, the electricity costs have all risen, both increasing by 2.15%.
7 Conclusion
Based on the establishment of the spatial-temporal distribution model of charging load of aggregated EVs, this paper proposes a two-level optimization model of distribution network, which combines the total cost price with spatial-temporal attribute and considers the demand response of EVs and controllable loads. The model adopts the interactive iterative solution of upper and lower levels to achieve a win-win situation between users and distribution network.
Simulation study case based on a modified IEEE 33-bus system shows that proposed electricity price mechanism can guide EVs and controllable loads to respond to the market electricity price and dispatching demand within the temporal-spatial dispatchable range The proposed two-layer model of day ahead economic dispatching can optimize the distribution of power generation and consumption of distribution network and optimize the behavior of users’ power consumption, so as to reduce the operation cost of DSO and users’ power cost.
This paper ignores the impact of the output uncertainty of renewable distributed energy on the economic dispatching of distribution network, resulting in a deviation from the actual results. For future work, it is to increase the uncertainty analysis of renewable distributed energy output.
Data Availability Statement
The datasets presented in this study can be found in online repositories. The names of the repository/repositories and accession number(s) can be found in the article/Supplementary Material.
Author Contributions
LX, WW, and XC contributed to conception and design of the study. CL organized the data. XJ performed the statistical analysis. LX and WW wrote the first draft of the manuscript. LX, WW, XC, and JY wrote sections of the manuscript. All authors contributed to manuscript revision, read, and approved the submitted version.
Funding
This work is supported by the project of “Research and development of key technologies and systems for transportation-grid integration under the background of TOD construction” (No. 52199720003A), which is sponsored by State Grid Sichuan Electric Power Research Institute.
Conflict of Interest
LX, WW, CL, and XJ were employed by the company Electric Power Research Institute, State Grid Sichuan Electric Power Company.
The remaining authors declare that the research was conducted in the absence of any commercial or financial relationships that could be construed as a potential conflict of interest.
Publisher’s Note
All claims expressed in this article are solely those of the authors and do not necessarily represent those of their affiliated organizations, or those of the publisher, the editors and the reviewers. Any product that may be evaluated in this article, or claim that may be made by its manufacturer, is not guaranteed or endorsed by the publisher.
References
Ali, S., Khan, I., Jan, S., and Hafeez, G. (2021). An Optimization Based Power Usage Scheduling Strategy Using Photovoltaic-Battery System for Demand-Side Management in Smart Grid. Energies 14 (8), 2201. doi:10.3390/en14082201
Canizes, B., Soares, J., Vale, Z., and Corchado, J. (2019). Optimal Distribution Grid Operation Using DLMP-Based Pricing for Electric Vehicle Charging Infrastructure in a Smart City. Energies 12 (4), 686. doi:10.3390/en12040686
Chen, X., Qiu, Z., Xu, Z., and Xiao, C. (2017). Strategy on Energy Saving Reconstruction of Distribution Networks Based on Life Cycle Cost. AIP Conf. Proc. 1864 (1), 020020. doi:10.1063/1.4992837
Cheng, T., Yang, Z., Dong, B., Li, B., Zhang, Y., Zeng, L., et al. (2022). Dynamic Multiobjective Optimal Dispatch of Distribution Network Considering Time of Use–Based Demand Response. J. Energ. Eng. 148 (2), 4021068. doi:10.1061/(asce)ey.1943-7897.0000808
de Sá Ferreira, R., Barroso, L. A., Lino, P. R., Carvalho, M. M., and Valenzuela, P. (2013). Time-of-use Tariff Design under Uncertainty in price-elasticities of Electricity Demand: A Stochastic Optimization Approach. IEEE T. Smart Grid. 4 (4), 2285–2295. doi:10.1109/tsg.2013.2241087
Fernandez, L. P., San Román, T. G., Cossent, R., Domingo, C. M., and Frias, P. (2010). Assessment of the Impact of Plug-In Electric Vehicles on Distribution Networks. IEEE T. Power Syst. 26 (1), 206–213. doi:10.1109/TPWRS.2010.2049133
Gazafroudi, A. S., Shafie-khah, M., Heydarian-Forushani, E., Hajizadeh, A., Heidari, A., Corchado, J. M., et al. (2019). Two-stage Stochastic Model for the price-based Domestic Energy Management Problem. Int. J. Electr. Power Energ. Syst. 112, 404–416. doi:10.1016/j.ijepes.2019.05.016
Huang, S., Wu, Q., Oren, S. S., Li, R., and Liu, Z. (2014). Distribution Locational Marginal Pricing through Quadratic Programming for Congestion Management in Distribution Networks. IEEE T. Power Syst. 30 (4), 2170–2178. doi:10.1109/TPWRS.2014.2359977
Li, C., Zhou, H., Li, J., and Dong, Z. (2020). Economic Dispatching Strategy of Distributed Energy Storage for Deferring Substation Expansion in the Distribution Network with Distributed Generation and Electric Vehicle. J. Clean. Prod. 253, 119862. doi:10.1016/j.jclepro.2019.119862
Liu, L., Yuan, L. L., and Ma, Y. M. (2014). The Research on Management Mode of Regional Distribution Network. Adv. Mater. Res. 1049-1050, 787–789. Paper presented at the Advanced Materials Research. doi:10.4028/www.scientific.net/amr.1049-1050.787
Liu, Q., Wang, R., Zhang, Y., Wu, G., and Shi, J. (2018). An Optimal and Distributed Demand Response Strategy for Energy Internet Management. Energies 11 (1), 215. doi:10.3390/en11010215
Mohsenzadeh, A., and Pang, C. (2018). Two Stage Residential Energy Management under Distribution Locational Marginal Pricing. Electric Power Syst. Res. 154, 361–372. doi:10.1016/j.epsr.2017.09.010
Muthamizh Selvam, M., Gnanadass, R., and Padhy, N. P. (2016). Initiatives and Technical Challenges in Smart Distribution Grid. Renew. Sustain. Energ. Rev. 58, 911–917. doi:10.1016/j.rser.2015.12.257
Verzijlbergh, R. A., Lukszo, Z., and Ilić, M. D. (2012). “Comparing Different EV Charging Strategies in Liberalized Power Systems,” in 2012 9th International Conference on the European Energy Market. doi:10.1109/eem.2012.6254807
Wang, J., Zhong, H., Xia, Q., and Kang, C. (2017). Optimal Planning Strategy for Distributed Energy Resources Considering Structural Transmission Cost Allocation. IEEE T. Smart Grid. 9 (5), 5236–5248. doi:10.1109/TSG.2017.2685239
Wei, J., Zhang, Y., Sahriatzadeh, F., and Srivastava, A. K. (2019). DLMP Using Three-phase Current Injection OPF with Renewables and Demand Response. IET Renew. Power Generation 13 (7), 1160–1167. doi:10.1049/iet-rpg.2018.6019
Xiao, L., Lei, X., Chen, Q., Tang, H., and Yu, J. (2020). “Optimal Dispatching Model of Active Distribution Network Considering Uncertainty of Demand Response,” in 2020 15th IEEE Conference on Industrial Electronics and Applications (ICIEA). Paper presented at the. doi:10.1109/iciea48937.2020.9248102
Xu, Z., Su, W., Hu, Z., Song, Y., and Zhang, H. (2015). A Hierarchical Framework for Coordinated Charging of Plug-In Electric Vehicles in China. IEEE T. Smart Grid 7 (1), 428–438. doi:10.1109/tsg.2014.2387436
Yan, Q., Zhang, B., and Kezunovic, M. (2018). Optimized Operational Cost Reduction for an EV Charging Station Integrated with Battery Energy Storage and PV Generation. IEEE T. Smart Grid. 10 (2), 2096–2106. doi:10.1109/tsg.2017.2788440
Zhuang Zhao, Z., Won Cheol Lee, W. C., Yoan Shin, Y., and Kyung-Bin Song, K. (2013). An Optimal Power Scheduling Method for Demand Response in home Energy Management System. IEEE Trans. Smart Grid 4 (3), 1391–1400. doi:10.1109/tsg.2013.2251018
Appendix
APPENDIX TABLE A1. Related parameters of transmission lines.

APPENDIX TABLE A2. EV sampling parameters.
Keywords: total cost price, EV loads, controllable load, economic dispatch of distribution network, spatiotemporal distribution
Citation: Xu L, Wei W, Cai X, Liu C, Jiang X and Yang J (2022) Day-Ahead Economic Dispatch Strategy for Distribution Network Considering Total Cost Price-Based Demand Response. Front. Energy Res. 10:870893. doi: 10.3389/fenrg.2022.870893
Received: 07 February 2022; Accepted: 11 April 2022;
Published: 13 May 2022.
Edited by:
Chul-Ho Lee, Texas State University, United StatesReviewed by:
Nikolaos Koltsaklis, Czech Technical University in Prague, CzechiaHongxun Hui, University of Macau, China
Copyright © 2022 Xu, Wei, Cai, Liu, Jiang and Yang. This is an open-access article distributed under the terms of the Creative Commons Attribution License (CC BY). The use, distribution or reproduction in other forums is permitted, provided the original author(s) and the copyright owner(s) are credited and that the original publication in this journal is cited, in accordance with accepted academic practice. No use, distribution or reproduction is permitted which does not comply with these terms.
*Correspondence: Lin Xu, WHUtMTkxODYxMTg3QHFxLmNvbQ==