 Longxiang Zhu
 Joseph L. Bottini3
 Luteng Zhang
- 1Key Laboratory of Low-Grade Energy Utilization Technologies and Systems (Chongqing University), Ministry of Education, Chongqing, China
- 2Postdoctoral Station of Power Engineering and Engineering Thermophysics, Chongqing University, Chongqing, China
- 3Department of Nuclear, Plasma, and Radiological Engineering, University of Illinois at Urbana-Champaign, Urbana, IL, United States
The interfacial area concentration (IAC) is of vital importance in determining the interfacial transfer terms of mass, momentum, and energy between phases in the two-fluid model. The two-group (2-G) interfacial area transport equation (IATE) dynamically models the IAC evolution of large and small bubbles, and the intergroup transfer bookkeeps the mass transferring between two groups. Different intergroup mass transfer coefficient correlations are employed in the 2-G IATE model, which include one old correlation and three new correlations previously developed by the authors. The two-group IATE is benchmarked with subcooled boiling experimental dataset. The group-1 interfacial area concentration results show that the three modified correlations improve the physically incorrect prediction by the old correlation. With the modified correlations, the 2-G IATE is foundationally capable of predicting the group-1 interfacial area concentration in subcooled boiling flow.
Introduction
The two-fluid model is now widely used to simulate two-phase flow systems like in RELAP5 (Thermal Hydraulics Group, 1998) and (TRACE (2010)). The model is formulated with two sets of conservation equations to separately consider the vapor phase and the liquid phase (Ishii and Hibiki, 2011) and the interface exists between the two phases. The interfacial area concentration, ai, plays a key role in the interfacial drag closure and the interfacial heat transfer closures in the two-fluid model, as it determines the interfacial transfer terms of mass, momentum, and energy between phases (Khan et al., 2020) (Liu et al., 2021). Figure 1 shows the diagram of the interface between the liquid and the vapor phase. The interfacial transfer terms can be written in the following form,
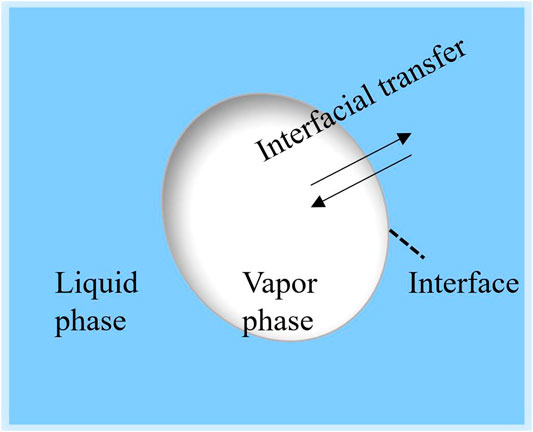
FIGURE 1. The interfacial mass, momentum, and energy transfer through the interface between liquid and vapor phase.
Many researchers (Hibiki and Ishii, 2002) developed empirical interfacial area concentration correlations, including Ishii and Mishima (1980), Zeitoun et al. 1994, Zeitoun and Shoukri (1996), and Hibiki et al. (2006). The correlations can be divided into two kinds, namely geometry-based semi-empirical correlations and empirical correlations (Zhu et al., 2021). Different correlations are used in bubbly, slug, and the following regimes because they are dependent on the flow regime. As a result, numerical instabilities can occur at the transitions between the flow regimes. However, the interfacial area transport equation (IATE) is developed to dynamically model the interfacial area concentration across the flow regimes. The successful closure of interfacial area concentration in the two-fluid model relies on the interfacial area transport equation.
Kocamustafaogullari and Ishii (1995) developed the one-group IATE based on the fluid particle number density transport equations analogous to Boltzmann’s transport equation. The one-group IATE disregards the type of bubbles and treats them equally as spherical bubbles. Hibiki et al. (2003) provided the formulation of one-group IATE for subcooled boiling flow with the bubble layer thickness model. Brooks and Hibiki (2016) proposed a complete framework of the one-dimensional one-group (1-G) IATE model for phase change flow, then Zhu et al. (2021) further validate the 1-G IATE using extensive boiling flow datasets and improved the condensation closure in the model. At low void fractions, the one-group two-fluid model is sufficient for describing cases with uniform bubble size (Hibiki and Ishii, 2000a). However, for high void fraction cases, large bubbles in cap shape or slug shape come into existence as the consequence of bubble coalescence, bubble expansion, or heating from the wall. Under the high-void-fraction circumstance, the one-group IATE does not accurately predict ai due to the spherical-shape and uniform-size assumption being applied to large bubbles (Zhu et al., 2019).
As the void fraction increases, the differences in shape, size, and number density between larger bubbles and small bubbles necessitate the separate consideration of bubbles in the two-fluid model (Hibiki and Ishii, 2000b). In order to account for the different mechanisms for heat and mass transfer of bubbles with different shapes and sizes, the two-group (2-G) IATE model is introduced in the work of Ishii and Kim (2004). Spherical and distorted bubbles are categorized as group-1 bubbles while cap and slug bubbles are categorized as group-2 bubbles in the two-group model (Hibiki and Ishii, 2000b). The separation of bubble groups thereby requires an additional set of conservation equations for the gas phase. Brooks et al. (2014) proposed the one-dimensional two-group IATE for subcooled boiling flow considering the uniform phase distribution pattern across the channel. Group-1 bubbles are averaged within a bubble layer while the group-2 bubbles span all the way across the channel.
Intergroup transfer happens between group-1 bubbles and group-2 bubbles: small bubbles can grow into large ones contributed from the coalescence, expansion, and nucleation, while the large bubbles can shrink into small ones as a result of the disintegration, condensation, and pressurization. Figure 2 shows the transfer between small and big bubbles. Intergroup transfer of the interfacial area concentration between groups is important for two-group IATE as it tracks and partitions of the gas phase into the bubble groups. This bookkeeping of bubble groups is facilitated by the intergroup mass transfer coefficient. The intergroup mass transfer correlation was first developed by Sun (2001). Zhu et al. (2020) provided a thorough review of the intergroup mass transfer coefficient and proposed three modified correlations for the term. Two analytical intergroup mass transfer coefficient correlations are also developed based on the bubble size distribution functions, including the Nukiyama-Tanasawa distribution Nukiyama and Tanasawa (1939) and the Rosin-Rammler distribution Rosin and Rammler (1933). Also, one empirical intergroup mass transfer coefficient correlation is obtained from the experimental data.
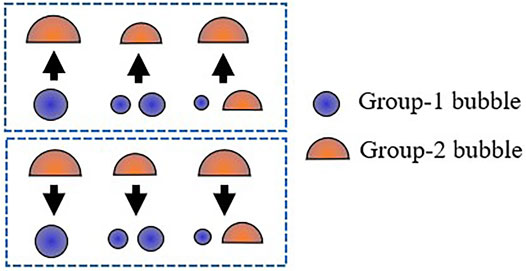
FIGURE 2. Illustration of the intergroup transfer between group-1 and group-2 bubbles.
This paper focuses on the benchmark of the 2-G IATE with subcooled boiling experimental data using different intergroup mass transfer coefficient correlations. The modeling of two-group IATE and the various correlations of intergroup mass transfer coefficient are presented in section 2. The prediction results of interfacial area concentration and the sink/source terms are presented in section 3, accompanied by the discussion about the performance of the old and three modified correlations.
Modeling
Brooks et al. (2014) proposed the one-dimensional two-group IATE for subcooled boiling flow with the consideration of bubble layer thickness model; however, only intergroup mass transfer from group-1 bubbles to group-2 bubbles was modeled. Kumar and Brooks (2018) developed the model to include the intergroup mass transfer from group-2 to group-1. Therefore, incorporating the intergroup mass transfer from both group-1 and group-2 bubble sides, the change in group ai in the one-dimensional, steady-state two-group IATE model for subcooled boiling flow is,
and
where subscripts g, 1, 2, and B denote vapor, group-1, group-2, and averaging over the bubble layer, respectively. The brackets <> and <<>> represent cross-sectional area average and void-weighted area average. The bracket <>B represent the bubble-layer average, which is calculated by the improved flat bubble layer thickness model in Zhu et al. (2022). The terms ai, z, v, and ϕ are interfacial area concentration, axial coordinate, velocity, and interfacial area concentration source/sink rate, respectively. There are nine source/sink terms in Eqs 2, 3: the wall nucleation term, the two expansion terms, the two bubble interaction terms, the two convection terms, the condensation term, and the intergroup mass transfer term. The wall nucleation term, <ϕWN,1>, and the expansion terms, <ϕEXP>, are modeled and described in Brooks et al. (2014). The bubble interaction terms, <ϕj>, and convection term, <ϕConv>, are described in Kumar and Brooks (2018). The condensation term for subcooled boiling flow, <ϕCO,1>, is modified by Zhu et al. (2019). The intergroup transfer term, <ϕΔṁ12>, is modeled by Kumar and Brooks (2018) and is written as,
where,
where,
where the terms α, ρ, η, χ, Dsm, Dc are void fraction, density, volume change rate per unit mixture volume, intergroup mass transfer coefficient, Sauter mean diameter, and critical bubble diameter at the group boundary, respectively. The subscripts V, Γ, DP, 12, and 21 denote volume change, interphase mass transfer, pressure change, group-1 to group-2, and group-2 to group-1, respectively.
In Eqs 6, 8, the interphase mass transfer rate per unit volume for group-n vapor, Γg,n, is a key term which cannot be measured directly and is hard to estimate in subcooled boiling flow with the theoretical models. However, this term can be determined based on the one-dimensional two-group mass balance equations (Ishii and Hibiki, 2011),
The intergroup mass transfer term, Δṁ12, is difficult to model in subcooled boiling flow, so it is assumed to be small relative to Γg,1 in Eq. 9. The relative magnitude of Δṁ12 to Γg,2 in Eq. 10 is inconsequential to the calculation of <ϕΔṁ12> due to the suppression using the min function in Eq. 4. Therefore, Δṁ12 is assumed to be negligible in Eqs 9, 10. Even though in some instances (e.g., when χ1 is nonzero) Δṁ12 will not be negligible relative to Γg,1, the analysis uses the same Γg,1 to isolate the effect of χ1 on <ϕΔṁ12>. More rigorous analysis to the two-group IATE can be applied once Γg,n is modeled correctly.
In Eqs. 6, 8, the intergroup mass transfer coefficient for group-n vapor, χn, is another important parameter in the multigroup formulation and needs to be modeled accurately. The group-1 intergroup mass transfer coefficient, χ1, and the group-2 intergroup mass transfer coefficient, χ2, can be related analytically (Kumar and Brooks, 2018) as χ2=(χ1·nb,1)/nb,2 where nb,n is the number density of group-n bubbles. The group-1 intergroup mass transfer coefficient was first developed by Sun et al. (2004), then Zhu et al. (2020) proposed three new correlations: an analytical correlation with Nukiyama-Tanasawa distribution, an analytical correlation with Rosin-Rammler distribution, and an empirical correlation. The correlations for the group-1 intergroup mass transfer coefficient are summarized in Table 1. In the equations, Dc* is the dimensionless critical bubble diameter which is calculated Dc* = 1.5Dc/Dsm,1. G (z,x) and G(z) are the upper incomplete Gamma function and the complete Gamma function. In addition, a constant value of 0, 1, or 0.01 has been assigned to χ1 in some works (Zhu et al., 2020).

TABLE 1. Correlations for the group-1 intergroup mass transfer coefficient.
The two analytical correlations are based on the distributions proposed by Nukiyama and Tanasawa (1939), and by Rosin and Rammler (1933). Both are single-peaked, right-skewed distributions; but the height and the location of the peak are different with the same characteristic parameter, i.e., the bubble nondimensional diameter. The factors in the power-law and exponential function of the nondimensional diameter are different in the two analytical correlations. Consequentially, in the range of Dsm,1/Dc∈[0.2,0.8], the intergroup mass transfer coefficient calculated by the analytical correlation with Nukiyama-Tanasawa distribution is larger than the correlation with Rosin-Rammler distribution. The empirical correlation is developed using an annulus condensing dataset (Kumar et al., 2019), an annulus flashing dataset (Kumar et al., 2019), an annulus boiling dataset (Bottini et al., 2020), and a pipe flashing dataset (Ooi et al., 2020). The empirical correlation predicts larger intergroup mass transfer coefficient values in the range of Dsm,1/Dc∈[0.2,0.5]; thus it better captures the data-points trend of the four datasets compared with the analytical correlations.
Results and Discussion
The subcooled boiling database by Bottini et al. (2020) is used to validate the two-group IATE model with four different group-1 intergroup mass transfer coefficient correlations: correlation Sun et al. (2004), analytical-NT correlation, analytical-RR correlation, and empirical correlation (Zhu et al., 2020). The experiment was conducted in an internally heated annulus channel with inner and outer diameters of 19.1 and 38.1 mm, respectively. The test section has a heated length of 2.85 m and an unheated length of 1.63 m. Four-sensor conductivity probes at three ports are used to measure interfacial area concentration and other two-phase parameters for group-1 and group-2 bubbles in the heated section. The conditions by Bottini et al. (2020) considered for the benchmark of two-group IATE model are listed in Table 2.

TABLE 2. Summary of conditions considered in the benchmark.from the database of Bottini et al. (2020).
Figures 3–6 present the calculation results of Run 1 in the database of Bottini et al. (2020) with two-group IATE model using the correlation Sun et al. (2004), the analytical-NT correlation, the analytical-RR correlation, and the empirical correlation (Zhu et al., 2020). The subfigure A) in each figure is the calculated group-1 intergroup mass transfer coefficients. The χ1 calculated by the correlation Sun et al. (2004) is observed to exceed the physical limit, 2, stated by Ishii and Hibiki (2011), in the lower region of the heated section where void fraction is small; thus, it is manually set to be two in the calculation. The cause of the nonphysical value is the power-law relation between χ1 and α1 in the correlation Sun et al. (2004), shown in the equation in Table 1. The χ1 calculated by the correlationSun et al. (2004) is also observed to decrease when the void fraction increases along the heated length. On the contrary, χ1 calculated by analytical-NT correlation, analytical-RR correlation, and empirical correlation (Zhu et al., 2020) increases along the heated length in the lower test section. This trend is more physically appropriate: the group-1 intergroup mass transfer coefficient should increase when more group-1 bubbles are present as χ1 evaluates the amount of group-1 bubbles transferring to group-2 bubbles. Compared to the χ1 calculated by the correlation Sun et al. (2004), χ1 calculated by the other three correlations also has a smaller range, the maximum of which is ∼0.18 for the three cases.
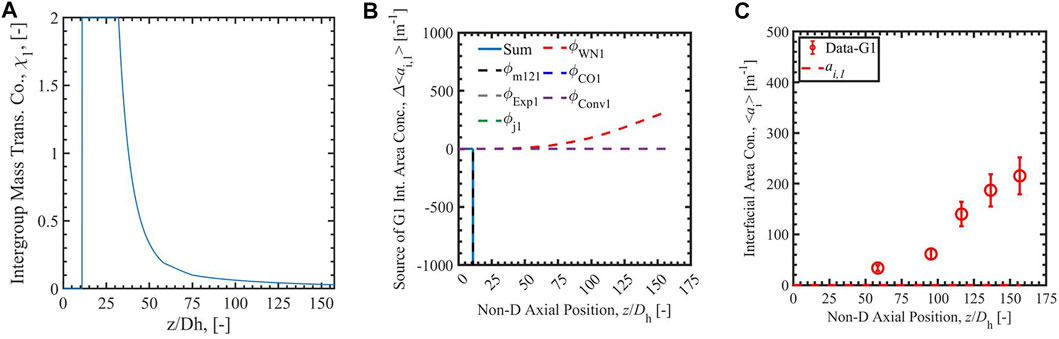
FIGURE 3. The Run 1 results of group-1 intergroup mass transfer coefficient (A), the source of group-1 interfacial area concentration (B), and the interfacial area concentration (C) calculated by correlation Sun et al. (2004).
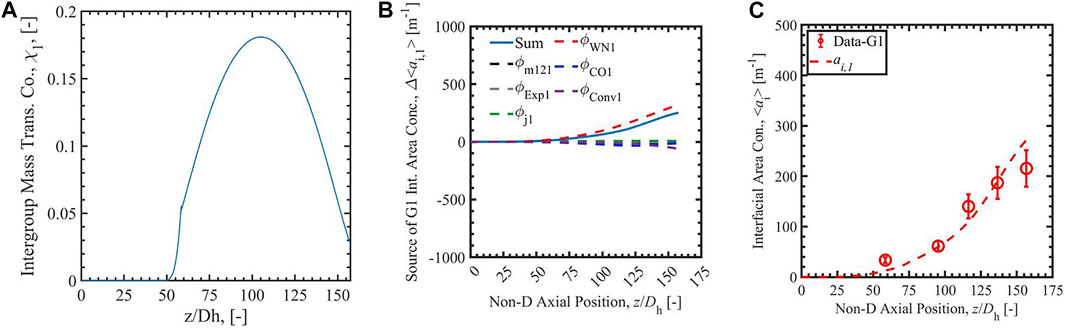
FIGURE 4. The Run 1 results of group-1 intergroup mass transfer coefficient (A), the source of group-1 interfacial area concentration (B), and the interfacial area concentration (C) calculated with analytical-NT correlation (Zhu et al., 2020).
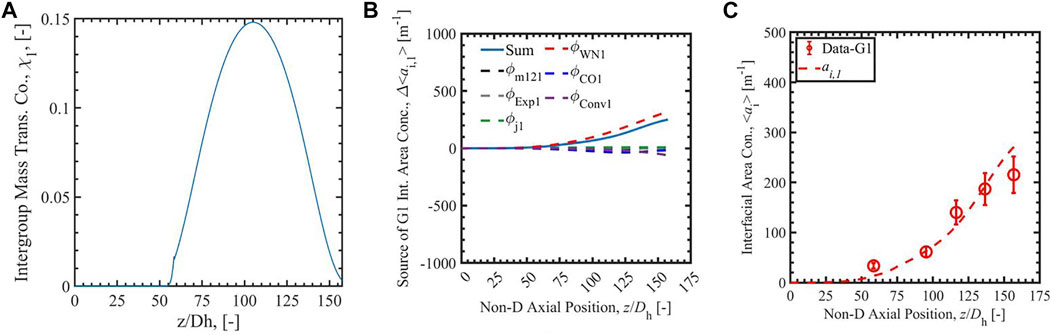
FIGURE 5. The Run 1 results of group-1 intergroup mass transfer coefficient (A), the source of group-1 interfacial area concentration (B), and the interfacial area concentration (C) calculated with analytical-RR correlation (Zhu et al., 2020).
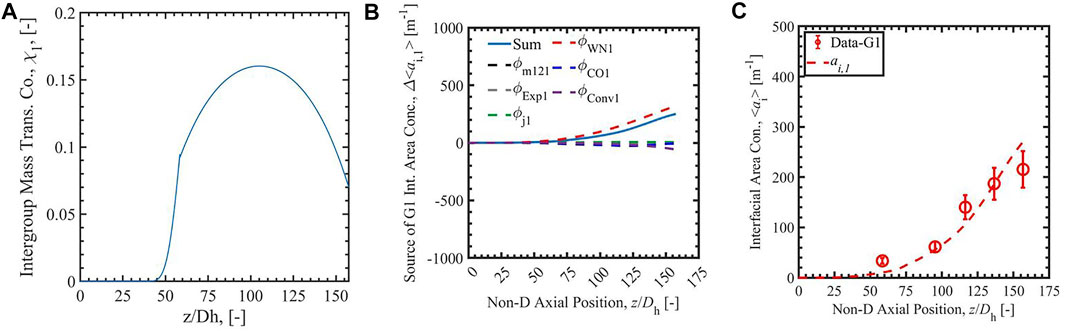
FIGURE 6. The Run 1 results of group-1 intergroup mass transfer coefficient (A), the source of group-1 interfacial area concentration (B), and the interfacial area concentration (C) calculated with empirical correlation (Zhu et al., 2020) (fourth row).
In the figures, the subfigure B) shows the source terms of group-1 interfacial area concentration: the intergroup mass transfer, wall nucleation, condensation, expansion, convection, and bubble interaction. The sum of the terms is shown with a solid blue line in the subfigures, and the intergroup mass transfer term is shown as a dashed black line. The subfigure C) is the comparison of simulated interfacial area concentration with experimental data for group-1 bubbles presented as red dots and red line. In the source term subfigures with the correlation Sun et al. (2004), the sum of the terms is negative or even infinite, dominated by a strong intergroup mass transfer term caused by the large χ1 mentioned above. The intergroup term is so large on account of the unphysically large χ1 term that any ai,1 generated by other means is immediately transferred to group-2, resulting in unphysical growth in group-2 ai while keeping ai,1 near-zero. This highlights the necessity of a new group-1 intergroup mass transfer coefficient correlation. With the new analytical-NT correlation, and analytical-RR correlation, the sums of terms calculated by 2-G IATE are positive values in the whole heated section. The calculated ai,1 is positive and increases along the heated length. The results show an improvement of the new analytical and empirical group-1 intergroup mass transfer coefficient correlations compared to the correlation Sun et al. (2004). In addition, compared with the χ1 scale by analytical correlations, the constant value of 0 or 1 should not be assumed to χ1, which give under- and over-prediction of intergroup transfer term. The constant value of 0.01 should not be assigned to the whole heated section. It overpredicts in the low void fraction section and affects the section later. Thus, the correlations which can dynamically predict χ1 are needed.
Figure 7 shows the group-1 interfacial area concentration benchmark of 2-G IATE with four group-1 intergroup mass transfer coefficient correlations, i.e., the correlation Sun et al. (2004), the analytical-NT correlation, the analytical-RR correlation, and the empirical correlation (Zhu et al., 2020). The results calculated by the correlation Sun et al. (2004) are not physically correct: the group-1 values of ai are zero as explained above, while the group-2 part is the contributor to the ai values here. However, when using the analytical-NT correlation, the analytical-RR correlation, and the empirical correlation, the 2-G IATE is foundationally capable to handle the transition to group-2 bubbles in subcooled boiling flow. A lot more works are still required to improve the two-group IATE in subcooled boiling flow, such as an accurate two-group interphase mass transfer model for Γg,n.
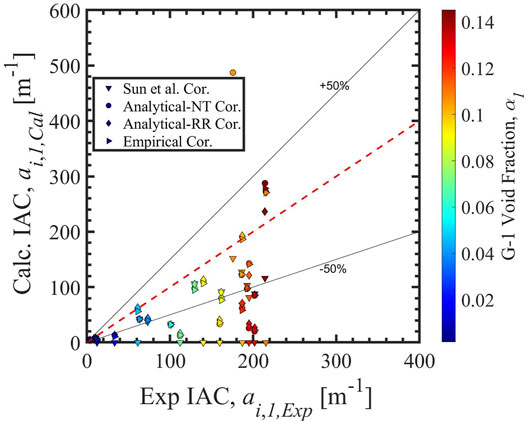
FIGURE 7. The ai,1 benchmark of 2-G IATE using four group-1 intergroup mass transfer coefficient correlations.
Conclusion
At high void fractions, the two-group (2-G) IATE model is developed to account for the different mechanisms for heat and mass transfer of bubbles with different shapes and sizes. Spherical and distorted bubbles are categorized as group-1 bubbles while cap and slug bubbles are categorized as group-2 bubbles. Intergroup transfer of the IAC between groups tracks and partitions the gas phase into the bubble groups, and the accurate modeling of the intergroup mass transfer coefficient is important for the two-group IATE.
In this paper, the 2-G IATE is benchmarked with subcooled boiling experimental data from Bottini et al. (2020). Different intergroup mass transfer coefficient correlations are employed in the 2-G IATE model, which include the correlation Sun et al. (2004), the analytical correlation with Nukiyama-Tanasawa distribution (Zhu et al., 2020), the analytical correlation with Rosin-Rammler distribution (Zhu et al., 2020), and the empirical correlation by Zhu et al. (2020). The group-1 interfacial area concentration results show that the three modified correlations improve the physically incorrect prediction by the correlation Sun et al. (2004). With the modified correlations, the 2-G IATE is foundationally capable of predicting the group-1 interfacial area concentration in subcooled boiling flow. More rigorous analysis to the two-group IATE can be applied once two-group Γg is modeled correctly. The IATE model will be coupled with system codes in the next phase to present the numerical improvement across flow regimes.
Data Availability Statement
The original contributions presented in the study are included in the article/Supplementary Material, further inquiries can be directed to the corresponding author.
Author Contributions
LoZ: conceptualization, investigation, methodology, validation, formal analysis, visualization, writing—original draft, project administration; JB: writing—review and editing; CB: methodology, writing—review and editing, supervision; LuZ: writing—review and editing.
Conflict of Interest
The authors declare that the research was conducted in the absence of any commercial or financial relationships that could be construed as a potential conflict of interest.
Publisher’s Note
All claims expressed in this article are solely those of the authors and do not necessarily represent those of their affiliated organizations, or those of the publisher, the editors and the reviewers. Any product that may be evaluated in this article, or claim that may be made by its manufacturer, is not guaranteed or endorsed by the publisher.
References
Bottini, J. L., Zhu, L., Ooi, Z. J., Zhang, T., and Brooks, C. S. (2020). Experimental Study of Boiling Flow in a Vertical Heated Annulus with Local Two-phase Measurements and Visualization. Int. J. Heat Mass Transfer 155, 119712. doi:10.1016/j.ijheatmasstransfer.2020.119712
Brooks, C. S., and Hibiki, T. (2016). Modeling and Validation of Interfacial Area Transport Equation in Subcooled Boiling Flow. J. Nucl. Sci. Techn. 53 (8), 1192–1204. doi:10.1080/00223131.2015.1096852
Brooks, C. S., Ozar, B., Hibiki, T., and Ishii, M. (2014). Interfacial Area Transport of Subcooled Boiling Flow in a Vertical Annulus. Nucl. Eng. Des. 268, 152–163. doi:10.1016/j.nucengdes.2013.04.041
Hibiki, T., Ho Lee, T., Young Lee, J., and Ishii, M. (2006). Interfacial Area Concentration in Boiling Bubbly Flow Systems. Chem. Eng. Sci. 61, 7979–7990. doi:10.1016/j.ces.2006.09.009
Hibiki, T., and Ishii, M. (2002). Interfacial Area Concentration of Bubbly Flow Systems. Chem. Eng. Sci. 57, 3967–3977. doi:10.1016/s0009-2509(02)00263-4
Hibiki, T., and Ishii, M. (2000). One-group Interfacial Area Transport of Bubbly Flows in Vertical Round Tubes. Int. J. Heat Mass Transfer 43 (15), 2711–2726. doi:10.1016/s0017-9310(99)00325-7
Hibiki, T., and Ishii, M. (2000). Two-group Interfacial Area Transport Equations at Bubbly-To-Slug Flow Transition. Nucl. Eng. Des. 202 (1), 39–76. doi:10.1016/s0029-5493(00)00286-7
Hibiki, T., Situ, R., Mi, Y., and Ishii, M. (2003). Modeling of Bubble-Layer Thickness for Formulation of One-Dimensional Interfacial Area Transport Equation in Subcooled Boiling Two-phase Flow. Int. J. Heat mass transfer 46, 1409–1423. doi:10.1016/s0017-9310(02)00418-0
Ishii, M., and Kim, S. (2004). Development of One-Group and Two-Group Interfacial Area Transport Equation. Nucl. Sci. Eng. 146, 257–273. doi:10.13182/nse01-69
Ishii, M., and Mishima, K. (1980). Study of Two-Fluid Model and Interfacial Area. No. NUREG/CR-1873. IL (USA): Argonne National Lab. ANL-80-111.
Khan, I., Wang, M., Zhang, Y., Tian, W., Su, G., and Qiu, S. (2020). Two-phase Bubbly Flow Simulation Using CFD Method: A Review of Models for Interfacial Forces. Prog. Nucl. Energ. 125, 103360. doi:10.1016/j.pnucene.2020.103360
Kocamustafaogullari, G., and Ishii, M. (1995). Foundation of the Interfacial Area Transport Equation and its Closure Relations. Int. J. Heat Mass Transfer 38 (3), 481–493. doi:10.1016/0017-9310(94)00183-v
Kumar, V., and Brooks, C. S. (2018). Inter-group Mass Transfer Modeling in the Two-Group Two-Fluid Model with Interfacial Area Transport Equation in Condensing Flow. Int. J. Heat Mass Transfer 119, 688–703. doi:10.1016/j.ijheatmasstransfer.2017.11.087
Kumar, V., Ooi, Z. J., and Brooks, C. S. (2019). Forced Convection Steam-Water Experimental Database in a Vertical Annulus with Local Measurements. Int. J. Heat Mass Transfer 137, 216–228. doi:10.1016/j.ijheatmasstransfer.2019.03.099
Liu, K., Wang, M., Gan, F., Tian, W., Qiu, S., and Su, G. H. (2021). Numerical Investigation of Flow and Heat Transfer Characteristics in Plate-type Fuel Channels of IAEA MTR Based on OpenFOAM. Prog. Nucl. Energ. 141, 103963. doi:10.1016/j.pnucene.2021.103963
Nukiyama, S., and Tanasawa, Y. (1939). An Experiment on the Atomization of Liquid : 3rd Report, on the Distribution of the Size of Droplets. Trans. Soc. Mech. Eng. Jpn. 5 (18), 131–135. doi:10.1299/kikai1938.5.131
Ooi, Z. J., Zhang, T., and Brooks, C. S. (2020). Experimental Dataset with High-Speed Visualization for Vertical Upward Steam-Water Flow with Transition from Annulus to Circular Channel. Int. J. Heat Mass Transfer 161, 120281. doi:10.1016/j.ijheatmasstransfer.2020.120281
Rosin, P., and Rammler, E. (1933). Laws Governing the Fineness of Powdered Coal. J. Inst. Fuel 7, 29–36.
Sun, X., Kim, S., Ishii, M., and Beus, S. G. (2004). Model Evaluation of Two-Group Interfacial Area Transport Equation for Confined Upward Flow. Nucl. Eng. Des. 230 (1-3), 27–47. doi:10.1016/j.nucengdes.2003.10.014
Sun, X. (2001). Two-group Interfacial Area Transport Equation for a Confined Test Section. West Lafayette: Purdue University.
Thermal Hydraulics Group (1998). RELAP5/MOD3 CODE MANUAL. Vol. I: Code Structure, System Models and Solution Methods. USA: RELAP5/MOD3.2.2 Beta.
TRACE (2010). Theory Manual Field Equations, Solution Methods, and Physical Models. U. S. Nuclear Regulatory Commission.
Zeitoun, O., and Shoukri, M. (1996). Bubble Behavior and Mean Diameter in Subcooled Flow Boiling. J. Heat Transfer 118, 110–116. doi:10.1115/1.2824023
Zeitoun, O., Shoukri, M., and Chatoorgoon, V. (1994). Measurement of Interfacial Area Concentration in Subcooled Liquid-Vapour Flow. Nucl. Eng. Des. 152, 243–255. doi:10.1016/0029-5493(94)90089-2
Zhu, L., Ooi, Z. J., Bottini, J. L., Brooks, C. S., and Shan, J. (2020). Bubble Diameter Distribution and Intergroup Mass Transfer Coefficient in Flows with Phase Change. Int. J. Heat Mass Transfer 163, 120456. doi:10.1016/j.ijheatmasstransfer.2020.120456
Zhu, L., Ooi, Z. J., and Brooks, C. S. (2019). “Current Capability of Interfacial Area Transport Approaches in Subcooled Boiling,” in 18th International Topical Meeting on Nuclear Reactor Thermal Hydraulics. NURETH.
Zhu, L., Ooi, Z. J., Brooks, C. S., and Shan, J. (2021). Modeling Sensitivity in Prediction of Interfacial Area Concentration in Boiling Flow. Prog. Nucl. Energ. 133, 103638. doi:10.1016/j.pnucene.2021.103638
Zhu, L., Zhang, T., Bottini, J. L., and Brooks, C. S. (2022). Two-dimensional Quantitative Study of Boiling Flow Evolution in Vertical Inner-Heated Annulus Channel. Int. J. Heat Mass Transfer 183, 122190. doi:10.1016/j.ijheatmasstransfer.2021.122190
Nomenclature
Greek
Superscripts
Subscripts
12 from group-1 to group-2
21 from group2 to group-1
g vapor phase
Brackets
Keywords: two-phase flow, boiling flow, IATE, two-group, intergroup transfer
Citation: Zhu L, Bottini JL, Brooks CS and Zhang L (2022) Comparison of Intergroup Mass Transfer Coefficient Correlations in Two-Group IATE for Subcooled Boiling Flow. Front. Energy Res. 10:890795. doi: 10.3389/fenrg.2022.890795
Received: 06 March 2022; Accepted: 28 March 2022;
Published: 13 April 2022.
Edited by:
Mingjun Wang, Xi’an Jiaotong University, ChinaReviewed by:
Zhaoming Meng, Harbin Engineering University, ChinaYacine Addad, Khalifa University, United Arab Emirates
Copyright © 2022 Zhu, Bottini, Brooks and Zhang. This is an open-access article distributed under the terms of the Creative Commons Attribution License (CC BY). The use, distribution or reproduction in other forums is permitted, provided the original author(s) and the copyright owner(s) are credited and that the original publication in this journal is cited, in accordance with accepted academic practice. No use, distribution or reproduction is permitted which does not comply with these terms.
*Correspondence: Longxiang Zhu, bHh6aHVAY3F1LmVkdS5jbg==