 Jonatan J. Gómez Vilchez
 Andreea Julea
 Chiara Lodi
 Alessandro Marotta
- 1European Commission, Joint Research Centre (JRC), Ispra, Italy
- 2Piksel Srl, Milan, Italy
In recognition of the contribution of navigation activities to greenhouse gas emissions, there are ongoing efforts in Europe to deploy zero- and low-emission vessel technologies. The main objective of this paper is to present an assessment of waterborne transport decarbonization in Europe by analyzing key policies and trends. In particular, the policy actions put forward by the European Union Member States and the United Kingdom between 2016 and 2018, including refueling infrastructure, the market evolution of alternatively-powered vessels and their techno-economic barriers are investigated. Our work focuses on electricity, hydrogen and natural gas. Our findings suggest that the policy and market responses to promote alternative fuel and electric vessels in Europe so far have been rather weak and lag behind the efforts exerted on road transport. Our conclusion is that, besides further research and development, more ambitious policy measures are needed to keep the prospect of waterborne transport decarbonization within reach in Europe.
1 Introduction
Almost 172 megatons of CO2 equivalent were emitted by navigation in the European Union (EU) and the United Kingdom (United Kingdom) in 2019, accounting for 18% of transport greenhouse gas (GHG) emissions. Of these, 87% corresponded to international navigation (UNFCCC, 2021). While much has been said about road transport decarbonization, the recognition of the need to green also waterborne transport has intensified only in recent times. In the European Green Deal, waterborne transport is explicitly mentioned as one of the sectors that will have to contribute towards the goal of lowering transport GHG emissions by 90% by 2050 (EC, 2019a). The White Paper stated that “the EU CO2 emissions from maritime transport should be cut by 40% (if feasible 50%) by 2050 compared to 2005 levels” (EU, 2011, p.8). A decade later, the European Climate Law set out a binding objective of climate neutrality in the EU by 2050 (EU, 2021). Given the international and economic dimension of waterborne transport, advanced technologies seem to receive the greatest support. Vessels powered by alternative fuels and electricity have been hailed as a technological solution to decarbonize waterborne transport (see Grosso et al. (2021) for other innovations and non-technological measures). Moirangthem (2016) provided an overview of the advantages and disadvantages of various alternative fuels for waterborne transport. More recently, Prussi et al. (2021) identified a series of aspects that will be impacted by alternative fuels in maritime transport, including emissions and costs. The European Commission’s Sustainable and Smart Mobility Strategy identified the lack of market ready zero-emission technologies in waterborne transport as a barrier to decarbonization (EC, 2020b). It also highlighted research and innovation partnerships such as “Clean Hydrogen” and “Zero Emission Waterborne Transport” (for example, WTP (2022)). JRC (2021) surveyed European research and innovation projects for waterborne transport. For those focusing on alternative fuels, the main options considered were electrification, hydrogen, liquefied natural gas (LNG) and liquefied petroleum gas (LPG) as a fuel. In their review of alternative fuels for maritime transport, Al-Enazi et al. (2021) concluded that the demand for clean fuels, driven by environmental regulations, will continue to grow. This driver of change was also mentioned by Lindstad et al. (2020), who identified LNG as a transitional fuel for maritime transport when combined with diesel dual fuel engines. As Ampah et al. (2021) found in their bibliometric analysis, this fuel has dominated research on alternative fuels for maritime transport, although the trend is changing in favor of methanol, ammonia and hydrogen.
With regards to inland waterways (IWWs), CCNR (2019), (p. 158) reported1 that “the most frequent alternative technology indicated by companies was diesel-electric propulsion (44%), followed by pure electric propulsion (34%), and Gas-to-Liquid (16%). LNG and hydrogen propulsion together had a share of 6%“. Concerning maritime transport, Styring et al. (2021) stressed the difficulty to defossilize this sector, a view shared by many. According to the IMO (2020), world shipping emissions totaled 1,056 million tons of CO2 in 2018. In the same year, the IMO adopted its strategy to reduce GHG emissions by at least 50% by the year 2050, compared to 2008 (IMO, 2018). Between 2010 and 2019, annual global seaborne trade grew by 32% to 11 billion tons. DNV-GL (2018) forecast world seaborne trade to reach 15.5 billion tons in 2030. The increase in maritime activity is expected to make the attainment of climate objectives more difficult. DNV-GL (2019) highlighted seven main alternative fuel options for vessels: ammonia, biofuels, electricity, hydrogen, LNG, LPG and methanol. In Europe, the proposed 2030 Climate Target Plan stressed the need for efforts in maritime transport to be scaled up, mentioning vessel efficiency improvements and fuel mix changes (EC, 2020a). More recently, the European Commission proposed the inclusion of maritime transport in the European Emissions Trading System. It also proposed the “FuelEU Maritime” initiative with the aim of facilitating the increase in the share of low-carbon and renewable fuels in the energy mix of international maritime transport (EC, 2021c).
In this paper, we report research on IWWs and maritime transport in the EU and the United Kingdom, with a focus on the market for vessels powered by non-conventional fuels and their related refueling and recharging infrastructure. Three alternative sources of energy are examined: electricity, hydrogen and LNG. The reason to restrict the analysis to these three fuels is that only they met the following two criteria: 1) they were listed in Article 2 of the Directive 2014/94/EU on the deployment of alternative fuels infrastructure (EU, 2014); and 2) sufficient information on these fuels was reported by EU Member States and the United Kingdom when fulfilling the obligations of the Directive. Beyond the scope of the study are other fuels such as ammonia, methanol and biofuels as well as scrubbers. For an analysis of these options, see Foretich et al. (2021) and Xing et al. (2021) for maritime and Breuer et al. (2022) for IWW transport.
The objective of this study is three-fold: 1) to determine alternative fuel vessel uptake in the European waterborne transport system, 2) to compare the governments’ targets on alternative fuels infrastructure deployment at inland and maritime ports in the Trans-European Network for Transport (TEN-T) Core Network, and 3) to analyze the national policies introduced to make waterborne transport more sustainable. In particular, the paper investigates the policy measures introduced in EU Member States and the United Kingdom between 2016 and 2018, as reported in the plans they submitted to the European Commission as part of the reporting exercise mandated by the Directive, the market evolution and current situation and the techno-economic hurdles that jeopardize GHG mitigation efforts.
The present study makes two main contributions to the literature: 1) it synthesizes official information on the deployment of vessels and refueling infrastructure, with a focus on electricity, natural gas and hydrogen; and 2) it identifies policy measures and research and development actions put forward by European governments. Our assessment of their measures promoting LNG is reported in this paper.
The structure of the paper is as follows: after this introduction, the materials and methodology are described in Section 2; the results are provided in Section 3; Section 4 contains the discussion. The acronyms used in this paper are listed in the Section “Glossary”.
2 Materials and Methods
We conceptualized the process of greening the European transport system as follows. Starting from an estimate of total GHG emissions from waterborne transport emissions, explicit or implicit goals for decarbonization are defined which spur policy action. Ideally, this takes into account the emission levels by vessel type and the expected beneficial contribution of each alternative fuel and electric option. Public policy measures and privately driven developments initialize the market for alternative fuel and electric powertrain options in those transport systems. Given the differences in well-to-tank, tank-to-wake and manufacturing and scrappage GHG emissions associated with the different technology options, summarized in a lifecycle assessment (LCA) value, and their mix in each country, a certain level of GHG emissions reduction is expected. The process can be closed by using this information to gauge the distance from the decarbonization goal and the need for further action, leading to iterations. Based on the conceptual scheme of the process, represented in Figure 1, we developed our methodological approach. This led us to divide our research tasks into three types of analysis: decarbonization, policy and market. As indicated in Section 4.3, the quantification of GHG emissions reductions resulting from the diffusion of vessels powered by alternative fuels was not part of the methodology applied in this study. Thus, the white arrows are not part of our methodology (see Gómez Vilchez et al. (2019) for an example in earlier work on road transport). The methodology was applied to road freight and waterborne transport and the present paper reports the results of the latter.
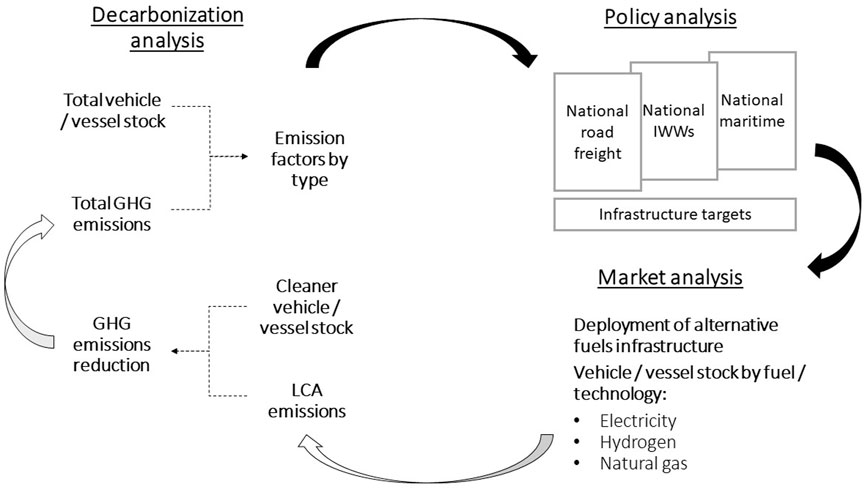
FIGURE 1. Overview of the three types of analysis conducted within the global process of greening the European transport system. Note: Infrastructure in this paper refers to shore-side electricity and LNG supply for inland waterways vessels and seagoing ships. For the results related to road freight, see Gómez Vilchez et al. (2022). Source: own work.
Two main rationales for increasing the use of alternative fuels in the European IWW and maritime sectors are decarbonization and costs. Around 90% of the 140 million tons of CO2 emissions generated by ships calling at EU and European Economic Area ports in 2018 could be traced to those above 5,000 gross tonnage (EMSA (2018) cited in EMSA/EEA (2021)). For data on CO2 emissions in the EU in 2018, by vessel type, see Figure 4.3 in EMSA/EEA (2021) and EMSA (2021).
The left chart in Figure 2 shows well-to-wake (WTW) emissions for IWW and maritime vessels between 2016 and 2018, expressed in grams of carbon dioxide-equivalent per ton-km (gCO2eq/tkm). The right chart illustrates the wide range of values depending on the nature of the vessel (inland or maritime) and the purpose for which it is used. Emissions differ also by the source of energy used to power the vessel, though information on this was scarcer (see Supplementary Figures S1, S2). The data show that the emissions levels (and implicitly energy and operational requirements) of inland waterways and maritime transport are strikingly different, which being expressed in tkm reflects also differences in average tonnage. This provides indications as to the near-term prospects of various alternative fuels options2.
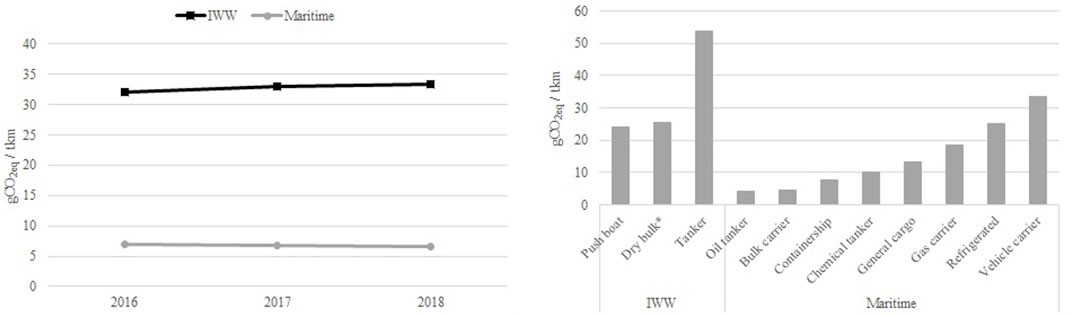
FIGURE 2. WTW GHG emission levels by type of vessel (left) and by vessel purpose in 2019 (right). Note: * means that container is included. Source: adapted from data in EEA (2020).
This brief overview of GHG emissions in waterborne transport is complemented with an estimation of climate change costs, by type of vessel. According to CE-Delft (2020), “climate change costs are defined as the costs associated with all of the effects of global warming”, which in “transport are mainly caused by CO2, N2O and CH4” (p. 74). To the extent that these costs are not internalized (i.e. borne by the agent causing them), they are treated by most economists as external costs. Figure 3 shows costs of less than 0.05 euro cents per tkm for large bulk maritime vessels to almost 0.35 euro cents per tkm (bulk for IWW and small container at 500 km for maritime). The cost of the latter goes down to 0.20 euro cents per tkm, similar to a CEMT II container for IWW, when the distance at sea reaches 3,000 km. Generally, IWW vessels’ external costs tend to be higher than for maritime vessels. However, the differences in tonnage should be taken into account when interpreting these values.
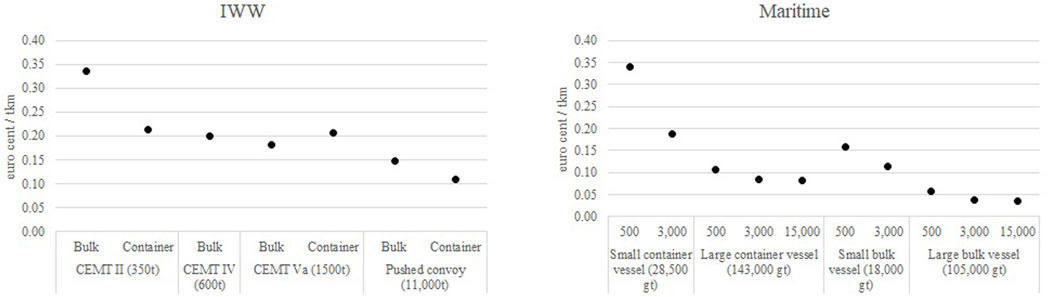
FIGURE 3. Average/marginal climate change costs for selected vessels: IWW (left) and maritime (right). Note: the numbers of the x-axis of the right chart refer to the distance at sea, measured in km. The values represent the EU27 plus United Kingdom in 2016. CEMT means “Conférence européenne des ministres des Transports.” Source: adapted from CE-Delft (2020) annexes downloaded2.
This study draws from three main sources of information that summarize our previous work on the topic over the past years. The first main material is the updated report ‘State of the art on alternative fuels transport systems in the European Union’ (EC, 2020c), which substantially expanded from Gómez Vilchez (2020). As part of this report, we co-designed a survey and processed the stakeholder replies. On waterborne transport, the number of stakeholders (ten in total) providing answers on the following alternative fuels are indicated in parenthesis: biofuels (4), electricity (4), hydrogen (5) and natural gas (5) (see the Supplementary Material). The second main material is the comprehensive assessment of the Member States’ and the United Kingdom’s National Implementation Reports (NIRs) submitted in the context of Directive 2014/94/EU ((EC, 2021a) and (EC, 2022)). When the information contained in these NIRs was insufficient, we decided to fill the gaps with data at our disposal. The first alternative data were from our assessment of the National Policy Frameworks (NPFs) (EC, 2019b). We assumed that the NIRs omitting data that had been previously reported in the NPFs, were tacitly endorsing those data. The second supplementary source of information was the European Alternative Fuels Observatory (EAFO), a publicly available portal supported by the European Commission. In both cases, we regarded these alternative data as reliable, as they represent official data previously communicated by the governments falling within the scope of reporting. In order to avoid potentially distorting results, when reliable data were not available, we opted for excluding them and flagged it. The data analyzed in this study ranges from 2016 to 2030. We also relied on an additional database for maritime transport (DNV-GL (2021) reported by EAFO (2021)).
3 Results
In this section, we highlight the key differences between inland waterways and maritime transport (by country, year and alternative fuel, depending on data availability), both in terms of vessels and refueling infrastructure and policies. However, the section starts with a brief discussion of economic aspects (cost estimates and a more detailed discussion on techno-economic barriers can be found in our previous work (EC, 2020c)).
3.1 Economic Barriers
Among the economic barriers, cost was considered the most significant one when it comes to the deployment of vessels powered by cleaner fuels. Battery performance in terms of range and cost was regarded as the major barrier to battery-powered vessels, particularly for maritime operations (EC, 2020c). The capital expenditures associated with new and retrofitted vessels based on alternative technologies can also be substantial, as the research literature and business experts suggest. However, an analysis of such cost differentials needs to be made on a case-by-case basis and is thus not reported here.
Besides vessel technology cost, higher operating costs resulting from the use of alternative fuels that are priced at a premium over conventional ones represent the other major market barrier zero- and low-emission vessels face. LNG and hydrogen have to rely on renewable sources of fuel production in order to reduce significantly emissions in the European waterborne transport system. This entails higher fuel costs at least in the short-term and can be considered their key market barrier.
Concerning infrastructure costs, economies of scale and innovation have led to reductions in the hardware cost of recharging infrastructure, though other sources of deployment cost have remained relatively stable. Port location and vessel type, together with variations in power demand, frequency and voltage, influence the cost of shore-side electricity (SSE) supply very much.
The cost of LNG and hydrogen refueling infrastructure in ports depends on capacity and is substantially high. This may limit its deployment in smaller ports, though cost reduction potential remains. With stationary bunkering being economically unattractive, other ways of supplying alternative fuels are being devised, as reported in Section 3.3.2.
3.2 Refueling and Recharging Infrastructure Targets
The NIRs chiefly reported alternative fuels infrastructure for waterborne transport for electricity and LNG. While the Directive 2014/94/EU defined “SSE supply” as “the provision of shore-side electrical power through a standardized interface to seagoing ships or inland waterway vessels at berth” and “refuelling point for LNG” as “a refuelling facility for the provision of LNG, consisting of either a fixed or mobile facility, offshore facility, or other system” (EU, 2014, p.10), including “LNG terminals, tanks, mobile containers, bunker vessels and barges” (p. 6), it was not always fully clear whether the NIR had followed this definition. It is also useful to note that the Directive gave priority to the ports of the TEN-T Core Network (Articles 3, 4 and 6). Concerning hydrogen, two NIRs explicitly communicated the following information: 1) the BG NIR mentioned the possibility of building a hydrogen refueling station at the port of Burgas; 2) at least one maritime port in the United Kingdom is considering this option. Information on other alternative fuels is much more limited (see e.g., the FI and the SE NIRs, available in EAFO (2021) for some information on biofuels and synthetic fuels). The data available in these NIRs varied significantly by country, year and type of port (inland or maritime).
Figure 4 shows actual and expected SSE supply in inland (left chart) and maritime (right chart) ports for those countries that reported targets above a certain threshold (see the note attached to the figure). Overall, it is expected that SSE supply will be more available in inland ports than in maritime ports. In both cases, a single country dominates the series (BE for inland and BG for maritime). While there seems to be almost a doubling of SSE supply in Belgian inland ports between 2016 and 2025, no fast growth in SSE supply is expected from the rest of the countries. Challenges regarding the amount of power needed to supply SSE were mentioned by e.g., the SI and FI NIRs. Article 4 of the Directive stated that SSE “shall be installed […] unless there is no demand and the costs are disproportionate to the benefits, including environmental benefits” (EU, 2014, p.12). The IE NIR reported a feasibility study that led to the lack of targets for SSE at Irish maritime ports. The United Kingdom NIR did not envisage SSE supply either.
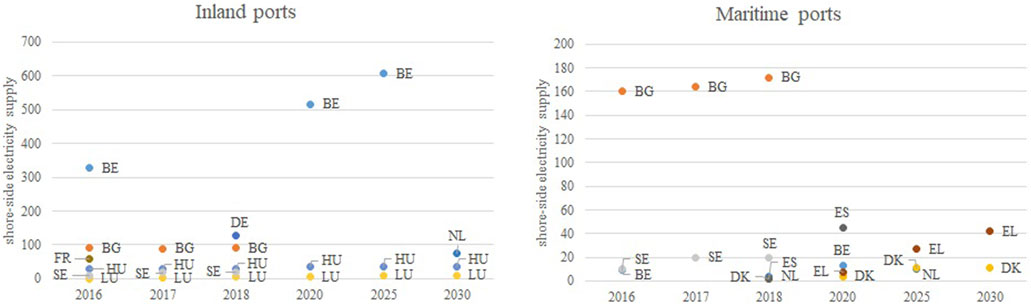
FIGURE 4. Shore-side electricity supply in selected countries based on available historical data (2016–2018) and NIR targets (2020–2030): inland (left) and maritime (right) ports. Note: only the countries with deployment of at least 10 points for the horizon considered are shown. The meaning of alternative fuel supply in waterborne transport, as reported in the NIR, may differ by country. It is not always clear whether the value reported refers to the number of ports offering supply or to the number of supply points. Source: adapted from EC (2022), based on NIR and NPF data.
Similarly, Figure 5 shows the results for LNG supply in inland ports (left chart) and maritime ports (right). As can be seen, LNG availability in inland ports is expected to grow particularly in Hungary and Netherlands. The latter, however, does not feature on the right chart (NL communicated a target of four LNG points in maritime ports for 2025). In maritime ports, the values are higher for Italy and Sweden, after steady growth, and specially Spain (albeit without growth since 2017). Overall, the number of LNG refueling points serving vessels is expected to be larger in maritime than in inland ports. For instance, while the MT NIR reports a market study on LNG bunkering that finds potential demand by 2025, LNG supply at inland ports in Sweden is not expected in this decade. In contrast to SSE, LNG infrastructure is expected to be more available in maritime ports.
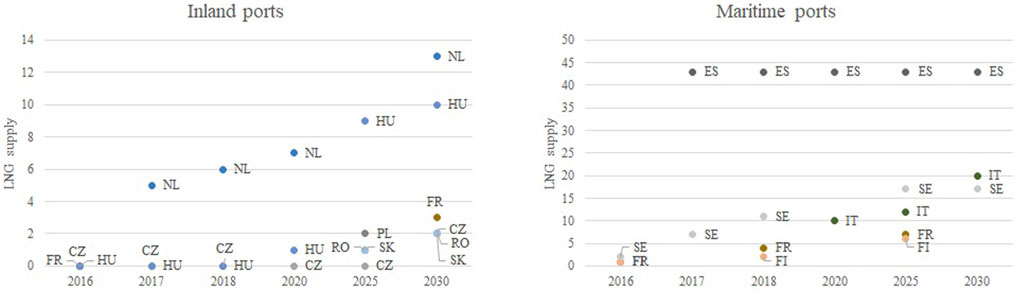
FIGURE 5. LNG infrastructure deployment in selected countries based on available historical data (2016–2018) and NIR targets (2020–2030): inland (left) and maritime (right) ports. Note: for inland ports only the countries with deployment exceeding 1 point for the horizon considered are shown. For maritime ports, the threshold value is 6 points. For Italy and unless otherwise stated in the NPF/NIR, LNG ports are understood as maritime ports. Source: adapted from EC (2022), based on NIR and NPF data.
Figure 6 shows the geographical distribution of LNG supply in inland and maritime TEN-T Core ports at the end of 2018 as well as the Member States that provided future targets. The Directive signaled 2025 as the relevant year for considering LNG infrastructure in maritime ports and 2030 for inland ports. Furthermore, the Directive gave priority to the ports of the TEN-T Core Network. As can be seen, deployment in inland ports is far from complete. Progress was made particularly in Belgian, French and Swedish maritime ports in the period 2016–2018.
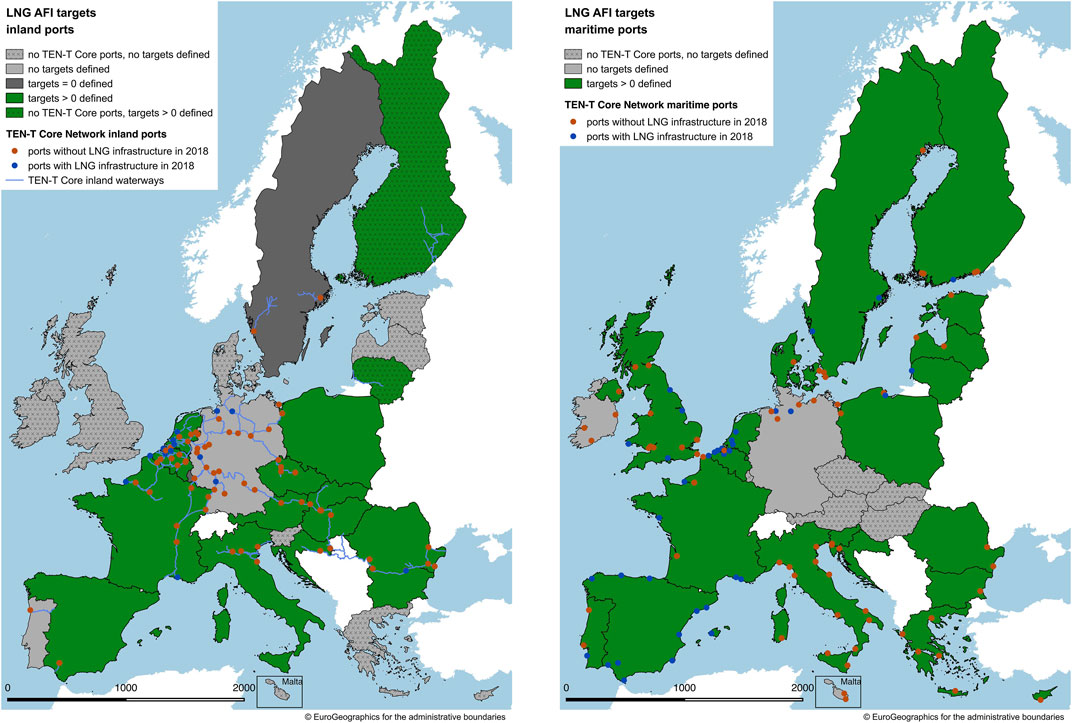
FIGURE 6. Spatial deployment of LNG supply in TEN-T Core ports at the end of 2018 and future targets: inland in 2030 (left) and maritime in 2025 (right). Source: own work based on NIR and NPF data, (EAFO, 2022) and (GIE, 2022).
3.3 Past Trends in Vessel Stock and Future Estimates
According to CCNR (2019), there were 15,041 inland vessels in Europe in 2018, of which 73% were dry cargo vessels. CCNR (2018) identified 24 new alternative fuel inland vessels in 2016. With almost 13,000 maritime vessels, the merchant fleet with flag registered in the EU27 and United Kingdom accounted for 13% of the global fleet of vessels in 2019 (UNCTAD, 2022)3. According to EMSA/EEA (2021), the number of EU-flag ships in the same year was 18,100 units. The next sub-sections report the stock of vessels, disaggregated by alternative fuel, as notified in the NIRs. A few NIRs gave information on vessels powered by other alternative fuels (for instance, the DE NIR mentioned one methanol-powered inland vessel). As indicated in Section 2, other sources complemented our analysis.
3.3.1 Electricity
Below Table 1 provides an overview. Information on electric vessels in general, and on the number of electric vessels in particular, was very scarce in the NIRs. According to the European Federation of Inland Ports (EFIP), “less than 0.5% of inland waterway vessels are hybrid/electric” (EC, 2020c, p.137). Concerning maritime vessels, DNV-GL (2021) reported 166 battery-powered units in use in 2019 (see Figure 5–20 in EC (2020c)). Global data by DNV-GL (2021) in EAFO (2021) indicates that this number grew to 225 in 2020, of which 53 vessels were pure electric, 48 plug-in hybrid and the rest hybrid.
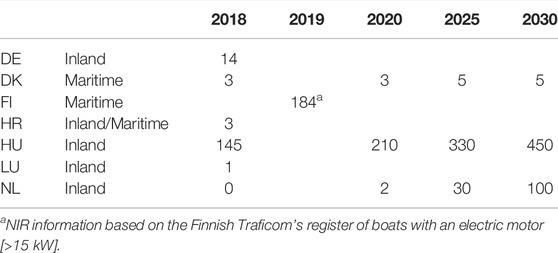
TABLE 1. Electric vessels indicated in the NIR.
3.3.2 Gas and Liquefied Powered Vessels: LNG and Hydrogen
While LNG was widely regarded by stakeholders as mature, this was not always the case for fuel cell vessels (EC, 2020c). Member States did not have the obligation to report hydrogen in their NIRs, unless they had chosen to do so in their NPFs. Information on vessels powered by hydrogen was very limited in the NIR. Two of the exceptions were the CZ NIR, which estimated 20 hydrogen-powered inland vessels by 2030, and the NL NIR (15 inland vessels by 2025 and 50 by 2030).
Based on data by DNV-GL (2021), EAFO (2021) reports that the European (excluding Norway) LNG vessel fleet (excluding bunker and inland vessels) grew from 15 in 2016 to 66 in 2020 (see Supplementary Figure S3 for information about the segments). Figure 7 shows this trend as well as the actual and expected deployment of LNG vessels in those countries that reported their data and estimates in the NIR: five for IWWs and six for maritime vessels. As can be seen, the number of LNG vessels reported for 2030 was 66% higher for inland than for maritime (125 vessels). While Netherlands accounted for the largest proportion of the former, Italy did so for the latter. As noted above, LNG may be supplied to vessels by alternative means. In the case of Germany, the NIR stressed that, though unavailable in stationary bunkering stations, LNG supply was provided at maritime ports via “truck-to-ship.” “Ship-to-ship” supply was also expected. In the Netherlands, a bunkering vessel and a pontoon are supplying LNG to maritime and inland vessels, respectively, in the ports of Amsterdam and Rotterdam.
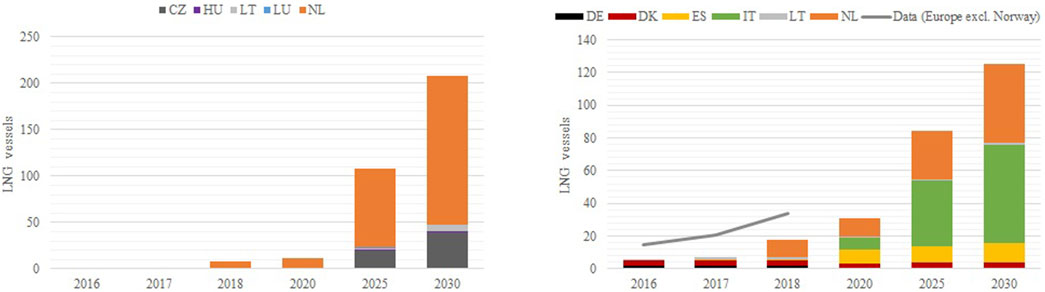
FIGURE 7. LNG vessels: inland (left) and maritime (right). Source: adapted from EC (2022), based on NIR and NPF data and estimates as well as on data by DNV-GL (2021) reported by EAFO (2021).
The expectations around LNG maritime vessels differed by countries. For instance, the United Kingdom NIR regarded LNG availability sufficient to meet the demand for fuel from maritime vessels. While uptake was expected by e.g., Belgium (despite this not being visible in Figure 7), further growth was not envisaged by e.g. Denmark. These expectations in turn influence policies.
3.4 Policy Analysis
In view of the targets reported in Section 3.1, in this section the policies identified in the NIRs to link refueling infrastructure and alternative fuel vessel uptake are analyzed. When it comes to policy measures, we rely on a methodology that leads to the assessment of the measures dedicated to the uptake of alternative fuels in waterborne transport, providing their estimated impact based on total score and comprehensiveness (refer to EC (2022) for details). This is defined for a given transport mode and alternative fuel pair. With regards to waterborne transport, the pairs identified and assessed are: LNG/water (maritime) and LNG/water (inland). Other waterborne transport pairs were identified in certain countries (see the next section), but they are not reported because the information is even more limited than for LNG.
3.4.1 Electricity
For our policy analysis in the context of this paper, we tended to focus on measures dedicated to waterborne transport. Some of them had been described in the NPFs but were no longer available in the NIRs (e.g., tax incentives for SSE in Germany and Netherlands). The NIRs also included measures that targeted a combination of transport modes. However, information on the fraction allocated to non-road transport was often unavailable. In our experience and based on the description of each measure, it is safe to assume that the budget used for waterborne transport was very low. Both electricity/water (maritime) and electricity/water (inland) pairs were clearly identified for Germany, Croatia and Netherlands. France, Ireland and Sweden contained a well-defined package of measures targeting electricity/water (maritime). Other NIRs with a few measures for one of these two pairs were Belgium, Finland, Latvia, Lithuania, Malta and Portugal. For some cases (Italy, Poland, Slovakia and Spain), it was unclear whether the policy referred to maritime or inland or both. Given the impossibility to identify solid electricity/water pairs for most of the countries, the salient policy measures are listed:
• Favorable port dues: Spain (50% reduction in the berthing fee charged to vessels docked in port when connected to the grid).
• Investments in SSE supply: Belgium (for seagoing ships as part of the “Ecology premium+” of the Flemish Region).
• Regulation: The Netherlands (mandatory use of SSE at berth by inland vessels in some municipalities).
• Tax exemption/reduction: Spain (elimination of the tax on provision of SSE for vessels at berth).
• Plans and strategies: Spain (for onshore power supply; see Power@berth (2022)).
• Vessel upgrade: Germany (subsidies for IWW transport operators, with only electric propulsion being eligible since January 2019).
Finally, a measure in the field of Research, technological development and demonstration (RTD&D), targeting solely electricity can be highlighted: a study on the applicability of smart grids to on-shore electrical connections in Spain.
3.4.2 Hydrogen
While hydrogen was mentioned in relation to waterborne transport in a few NIRs, the description of concrete policy measures, even if only planned, for this alternative fuel and transport mode was very scarce.
The only NIR with a clear hydrogen/water (maritime) pair was Germany and this included inter alia tax relief on electricity used for electrolysis to produce hydrogen and support for hydrogen refueling facilities.
RTD&D measures related to hydrogen for waterborne transport were listed in the BE NIR. The main one solely dedicated to hydrogen was the Interreg project H2SHIPS (System-Based Solutions for H2-Fuelled Water Transport in North-West Europe). This project, in which partners from Belgium, France, Germany, the Netherlands and the United Kingdom are participating, aims at demonstrating hydrogen vessel propulsion and bunkering (H2SHIPS, 2022). Another hydrogen project was the WaterstofNet, led by Belgium, which covered also waterborne transport (WaterstofNet, 2022).
Besides measures targeting solely hydrogen, this fuel was sometimes included in policies targeting more than one alternative fuel (see Section 3.4.3).
3.4.3 Natural Gas
Table 2 shows the country-specific results of the two aforementioned clusters: the FI NIR was the only one receiving, because of the policy assessment, a ‘high’ impact in both clusters. In contrast, a ‘low’ impact was the most common outcome. For a non-negligible number of NIRs, quantification of the policy measures was not possible due to insufficient information.
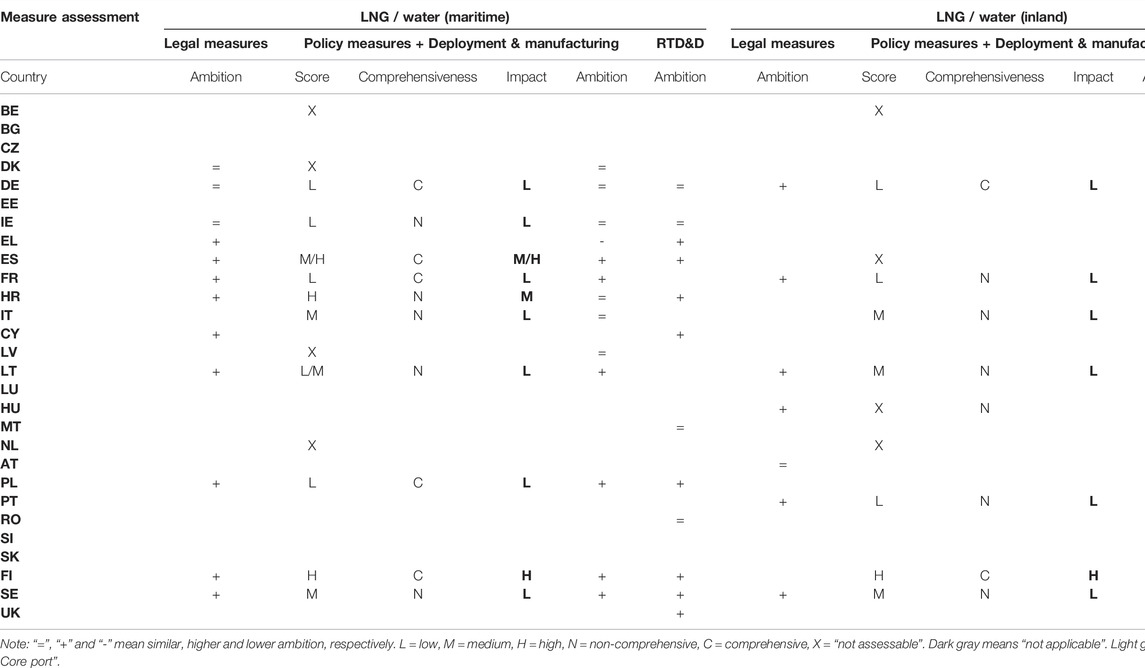
TABLE 2. Results of the measure assessment for vessels powered by LNG.
The following policy, deployment, and manufacturing support measures are of particular relevance:
• Accelerated depreciation for vessels using LNG: France (as planned for the 2020 Finance Law).
• Favorable port dues: Spain (50% reduction in the access and berthing fee for vessels and 15–40% in the port duty applicable to LNG cargo for bunkering).
• Investment premium for infrastructure: Finland4 (financial incentives for the construction of LNG infrastructure to promote natural gas and biogas use in waterborne transport) and Italy (construction of two LNG port terminals, at the ports of Livorno and Venice, as part of the GAINN4SEA project; see INEA (2022)).
• Investment premium for new vessels: Germany (for equipping new seagoing vessels).
• Retrofitting: Germany (for seagoing vessels).
• Plans and strategies: Spain (including participation in LNGHIVE (2022)). The “LNG Master Plan for Rhine-Main-Danube” was mentioned in the AT and RO NIRs.
The ES NIR also lists various private initiatives and EU-funded projects for LNG vessels and infrastructure. Besides policy measures, legal and RTD&D measures are identified. These are shown for the LNG/water clusters in Table 2. The following RTD&D action uniquely devoted to LNG can be singled out: research, development and innovation aid plan for the Spanish shipbuilding industry (15 million € over 2017–2020). Other RTD&D measures are listed in the next sub-section. Finally, the ES NIR lists four education and information measures and the RO NIR a study on the refurbishment of ships using LNG.
3.4.4 Summary of Policies Targeting Two or More Alternative Fuels
RTD&D measures related to waterborne transport dealt mainly with two or more alternative fuels, with the term ‘zero-emission’ usually covering fully electric and fuel cell vessels. The following RTD&D actions can be highlighted:
• Belgium: Implementation of Ship HYbridization (ISHY).
• Germany: “Next Generation Maritime Technology” research program for shipbuilding and marine technology” (220 million €; 2011–2017); “Maritime Research Programme/Maritime Agenda 2025” (budget undisclosed; 2018-n.d.), eventually targeting hydrogen, LNG and methanol.
• Sweden: “Shipping programme” and “Swedish Transport Administration’s industry programme Sustainable shipping”.
• The Netherlands: “Sustainable Inland Shipping subsidy.”
• United Kingdom: “Maritime Innovation Fund.”
In addition, the following policy and deployment and manufacturing support measures targeting a combination of fuels for waterborne transport were identified:
• Alternative fuels infrastructure support: Germany (for inland ports in Sachsen), France (“Zero Fumes Stopover” plan).
• Fund: Poland (the “Low-Emission Transport Fund” targeting the three alternative fuels assessed here).
• Investment premium for new vessels: Germany (for equipping inland vessels powered by alternative fuels).
• Port due discounts: The Netherlands (inland or sea harbor due discounts for vessels powered by alternative fuels in the ports of Amsterdam and Rotterdam, without detailing the amounts).
• Retrofitting: Germany (for inland vessels powered by alternative fuels), Hungary (for maritime and inland vessels powered by alternative fuels, including electricity, by 2030).
• State guarantees: Spain (for the conversion to low-emission vessels).
4 Discussion
4.1 Key Findings
To the Norwegian vessel classification society DNV-GL, it is uncertain which alternative fuel will be the dominating one in maritime transport. Based on the available information provided by the Member States, we are unable to single out the most promising alternative fuel (i.e., the one that will likely win the market) in the European waterborne transport system.
While in its report regarded as an attractive option for waterborne transport, the European Commission (EC, 2020c) expressed reservations concerning the role to be played by LNG due to its narrow contribution to GHG emissions reduction and to the uncertainty concerning biomethane long-term availability for transport. Supplementary Figure S2 seems to support the first point and we found instances of NIRs not being overly optimistic about this option.
Another interesting point concerns the co-evolution of alternative fuel vessels and alternative fuels infrastructure. Two non-exhaustive illustrative examples: 1) the CZ NIR communicated future estimates on hydrogen-powered vessels without targets for refueling infrastructure; 2) the DE NIR indicated SSE supply at three maritime ports and no electric seagoing vessels in 2018. The first case may reflect the communication of anticipated fuel demand, thereby justifying the deployment of infrastructure. The second case may be: 1) a pragmatic way of tackling the so-called chicken-and-egg problem via investing first in infrastructure; or more likely 2) due to the fact that non-fully electric vessels may also use SSE infrastructure. In our view, the interaction between vessels and infrastructure should not be neglected, although such refueling points may be used by foreign vessels.
In comparison to our assessment of road transport, the results of policy and RTD&D measures, presented in this paper, indicate that the weight of RTD&D actions in relation to policy measures, is heavier.
4.2 Conclusion
Our findings suggest that the policy and market responses to promote alternative fuel and electric vessels in Europe so far have been rather weak and lag behind the efforts exerted on road transport. Given that the rate of vessel replacement is low (see e.g. Stopford (2008)), retrofitting is expected to play an important role in greening waterborne transport. In fact, EFIP considered that electrification of the IWW vessel fleet might proceed faster if retrofitting opportunities arise (EC, 2020c). An example of fast growth is provided by the NL NIR, which communicates the ambition to increase the zero-emission (electric or fuel cell) inland vessel fleet from zero in 2018 to 150 units by 2030. For maritime transport, it is interesting to note that the DK NIR did not seem to consider LNG retrofit for vessels an option.
Further investment in RTD&D seems to be particularly required to extend the applicability of battery-powered vessels to long-range and unpredictable sailing pattern routes as well to improve the performance of fuel cells. The conclusion we draw is that, besides further RTD&D, more ambitious policy measures are needed to keep the prospect of waterborne transport decarbonization within reach in Europe.
4.3 Limitations and Further Research
We found that the NIR information concerning waterborne transport was in general scant. For example, LNG refueling infrastructure targets and LNG vessel estimates were provided by a minority of countries. When data was provided it was sometimes at overly aggregated level (e.g., without distinguishing between inland and maritime data, as in the case of the IT and SE NIRs). The case of Italy and Spain is interesting because, as seen in Figures 5, 7, the ratio of LNG maritime vessel per LNG point in 2030 is 3 and 0.28, respectively. Nonetheless, there are two points worth mentioning in this context: 1) it is unclear whether all the LNG ports counted as maritime for Italy are in fact maritime ports (recall Figure 6); 2) maritime refueling infrastructure is expected to be used not only by country-flag vessels. Furthermore, budget information per measure was often not reported in the NIR. These examples illustrate the main limitation of this study, namely clearly defined data availability. Although we strove to fill the gaps with adequate information from other sources, this approach could be exploited only to a certain extent.
As a result of the previous point, our analysis of the vessel fleet remained at a rather aggregated level. When feasible, we showed emissions values by vessel type (inland and maritime) as well as by segment, thereby highlighting important differences to be taken into account in future more disaggregated analyses.
This study did not attempt to quantify the reductions in GHG emissions that might result from the uptake of different fuels and powertrain technologies in the waterborne transport system, a complex modeling task left for future research. The first round of NIR submissions represented a missed opportunity for several countries to communicate future vessel estimates and infrastructure targets, which would perhaps have reduced the uncertainty perceived by market players and facilitate such quantification.
According to Czermański et al. (2020), p.6, “LNG does not ensure compliance with future CO2 emissions limits for longer than 11 years, which calls for urgent action to develop alternative fuel technologies”. Other alternative fuels discussed in the context of waterborne transport, such as ammonia and methanol were not listed in Article 2 of the Directive 2014/94/EU. The former was explicitly mentioned in the recent proposal for turning this Directive into a Regulation (EC, 2021b). Further research on these alternatives is also desirable.
Data Availability Statement
The datasets presented in this study can be found in online repositories. The names of the repository/repositories and accession number(s) can be found in the article/Supplementary Material.
Author Contributions
Conceptualization: AM, AJ, CL, and JGV; Data analysis and visualization: All; Writing - original draft: JGV; Writing - review & editing: AM, AJ, and CL; Supervision: AM.
Conflict of Interest
Author CL was employed by the company Piksel Srl.
The remaining authors declare that the research was conducted in the absence of any commercial or financial relationships that could be construed as a potential conflict of interest. The views expressed are purely those of the authors and may not in any circumstances be regarded as stating an official position of the European Commission.
Publisher’s Note
All claims expressed in this article are solely those of the authors and do not necessarily represent those of their affiliated organizations, or those of the publisher, the editors, and the reviewers. Any product that may be evaluated in this article, or any claim that may be made by its manufacturer, is not guaranteed or endorsed by the publisher.
Acknowledgments
We are grateful to our colleagues Alois Krasenbrink, Beatriz Acosta Iborra, Dominika Klassek-Bajorek, Matteo Prussi and Robert Loos for helping us assess the NIRs. We also thank the two reviewers and an internal JRC reviewer. We are also very grateful to our colleague Carine Nieuweling for proofreading the manuscript.
Supplementary Material
The Supplementary Material for this article can be found online at: https://www.frontiersin.org/articles/10.3389/fenrg.2022.904500/full#supplementary-material
Footnotes
1Based on answers by 55 trip navigation firms active in Europe.
2https://transport.ec.europa.eu/transport-themes/sustainable-transport/internalisation-transport-external-costs_en.
3“100 gross tons and above, excluding inland waterway vessels, fishing vessels […], military vessels, yachts, and offshore fixed and mobile platforms and barges (with the exception of FPSO—floating production, storage and offloading vessels—and drillships)” (https://unctadstat.unctad.org/wds/TableViewer/summary.aspx?ReportId=93).
4This is part of a relatively ambitious LNG plan for shipping, which includes the exploration of vessel procurement.
References
Al-Enazi, A., Okonkwo, E. C., Bicer, Y., and Al-Ansari, T. (2021). A Review of Cleaner Alternative Fuels for Maritime Transportation. Energy Rep. 7, 1962–1985. doi:10.1016/j.egyr.2021.03.036
Ampah, J. D., Yusuf, A. A., Afrane, S., Jin, C., and Liu, H. (2021). Reviewing Two Decades of Cleaner Alternative Marine Fuels: Towards IMO's Decarbonization of the Maritime Transport Sector. J. Clean. Prod. 320, 128871. doi:10.1016/j.jclepro.2021.128871
Breuer, J. L., Scholten, J., Koj, J. C., Schorn, F., Fiebrandt, M., Samsun, R. C., et al. (2022). An Overview of Promising Alternative Fuels for Road, Rail, Air, and Inland Waterway Transport in Germany. Energies 15, 1443. doi:10.3390/en15041443
CCNR (2019). Inland Navigation in Europe - Market Observation. Central Commission for the Navigation of the Rhine. Annual Report 2019. Retrieved from https://inland-navigation-market.org/wp-content/uploads/2019/09/ccnr_2019_Q2_en-min.pdf (Accessed Dec 20, 2020).
CCNR (2018). Market Report 2014-2017 - Main Features and Trends of the European Inland Waterway Transport Sector. Central Commission for the Navigation of the Rhine.
CE-Delft (2020). Handbook on the External Costs of Transport. CE Delft. Version 2019 – 1.1. Report commissioned by European Commission. Retrieved from https://op.europa.eu/en/publication-detail/-/publication/9781f65f-8448-11ea-bf12-01aa75ed71a1/language-en.
Czermański, E., Pawłowska, B., Oniszczuk-Jastrząbek, A., and Cirella, G. T. (2020). Decarbonization of Maritime Transport: Analysis of External Costs. Front. Energy Res. 8, 28. doi:10.3389/fenrg.2020.00028
DNV-GL (2021). Alternative Fuels Insight Platform (AFI). Veracity by DNV-GL. Retrieved from https://store.veracity.com/da10a663-a409-4764-be66-e7a55401275a.
DNV-GL (2019). Comparison of Alternative Marine Fuels. SEA\LNG Ltd. DNV-GL AS Maritime. Retrieved from https://sea-lng.org/wp-content/uploads/2019/09/19-09-16_Alternative-Marine-Fuels-Study_final_report.pdf.
DNV-GL (2018). Maritime Forecast to 2050 – Energy Transition Outlook 2018. DNV GL Maritime. Presentation at NAVIGATE Expo, 16th May 2018.
EAFO (2021). European Alternative Fuels Observatory (EAFO). European Commission. Retrieved from www.eafo.eu (Accessed September, 2020).
EAFO (2022). Port Infrastructure. European Alternative Fuels Observatory (EAFO). European Commission. Retrieved from https://www.eafo.eu/shipping-transport/port-infrastructure/lng/bunkering-for-ships (Accessed March 10, 2022).
EC (2019b). Assessment of the MS National Policy Frameworks for the Development of the Market as Regards Alternative Fuels in the Transport Sector and the Deployment of the Relevant Infrastructure Pursuant to Article 10(2) of Directive 2014/94/EU. Staff Working Document SWD/2019/0029. European Commission (EC). Luxembourg: Publications Office of the European Union.
EC (2020a). Communication from the Commission to the European Parliament, the Council, the European Economic and Social Committee and the Committee of the Regions Stepping up Europe’s 2030 Climate Ambition Investing in a Climate-Neutral Future for the Benefit of Our People. Communication COM/2020/562. European Commission (EC). Luxembourg: Publications Office of the European Union. Retrieved from https://eur-lex.europa.eu/legal-content/EN/TXT/?uri=CELEX:52020DC0562.
EC (2020b). Communication from the Commission to the European Parliament, the Council, the European Economic and Social Committee and the Committee of the Regions Sustainable and Smart Mobility Strategy – Putting European Transport on Track for the Future. Communication COM/2020/7. European Commission (EC). Luxembourg: Publications Office of the European Union. Retrieved from https://eur-lex.europa.eu/legal-content/EN/TXT/?uri=CELEX%3A52020DC0789.
EC (2019a). Communication from the Commission to the European Parliament, the European Council, the Council, the European Economic and Social Committee and the Committee of the Regions the European Green Deal. Communication COM(2019) 640. European Commission (EC). Luxembourg: Publications Office of the European Union. Retrieved from https://ec.europa.eu/info/sites/info/files/european-green-deal-communication_en.pdf.
EC (2021a). Detailed Assessment of the Member States Implementation Reports on the National Policy Frameworks for the Development of the Market as Regards Alternative Fuels in the Transport Sector and the Deployment of the Relevant Infrastructure. Staff Working Document SWD(2021) 49. European Commission (EC). Luxembourg: Publications Office of the European Union. Retrieved from https://eur-lex.europa.eu/legal-content/EN/TXT/?uri=CELEX%3A52021SC0049.
EC (2021b). Proposal for a Regulation of the European Parliament and of the Council on the Deployment of Alternative Fuels Infrastructure, and Repealing Directive 2014/94/EU of the European Parliament and of the Council. European Commission (EC). Luxembourg: Publications Office of the European Union. Retrieved from https://ec.europa.eu/info/sites/default/files/revision_of_the_directive_on_deployment_of_the_alternative_fuels_infrastructure_with_annex_0.pdf.
EC (2021c). Proposal for a Regulation of the European Parliament and of the Council on the Use of Renewable and Low-Carbon Fuels in Maritime Transport and Amending Directive 2009/16/EC. Communication COM(2021) 562. European Commission (EC). Luxembourg: Publications Office of the European Union. Retrieved from https://ec.europa.eu/info/sites/default/files/fueleu_maritime_-_green_european_maritime_space.pdf.
EC (2020c). State of the Art on Alternative Fuels Transport Systems in the European Union - 2020 Update. European Commission (EC). Luxembourg: Publications Office of the European Union. Retrieved from https://op.europa.eu/en/publication-detail/-/publication/fd62065c-7a0b-11ea-b75f-01aa75ed71a1.
EC (2022). Updated Detailed Assessment of the Member States Implementation Reports on the National Policy Frameworks for the Development of the Market as Regards Alternative Fuels in the Transport Sector and the Deployment of the Relevant Infrastructure. Staff Working Document SWD(2022) 33. European Commission (EC). Luxembourg: Publications Office of the European Union. Retrieved from https://transport.ec.europa.eu/system/files/2022-03/SWD_2022_33.pdf.
EEA (2020). Methodology for GHG Efficiency of Transport Modes. European Environment Agency. Final Report by Fraunhofer ISI and CE Delft.
EMSA (2018). CO2 Emission Report. Thetis-MRV. European Maritime Safety Agency. Retrieved from https://mrv.emsa.europa.eu/#public/%0Aeumrv.
EMSA (2021). CO2 Emission Report. Thetis-MRV. European Maritime Safety Agency. Retrieved from https://mrv.emsa.europa.eu/#public/emission-report.
EMSA/EEA (2021). European Maritime Transport Environmental Report 2021. Europan Maritime Safety Agency/European Environmental Agency. Retrieved from https://www.eea.europa.eu/publications/maritime-transport/.
EU (2014). Directive 2014/94/EU of the European Parliament and of the Council of 22 October 2014 on the Deployment of Alternative Fuels Infrastructure. Official Journal of the European Union. Retrieved from https://eur-lex.europa.eu/legal-content/en/TXT/?uri=CELEX%3A32014L0094.
EU (2021). Regulation (EU) 2021/1119 of the European Parliament and of the Council of 30 June 2021 Establishing the Framework for Achieving Climate Neutrality and Amending Regulations (EC) No 401/2009 and (EU) 2018/1999 (‘European Climate Law’). European Union. Retrieved from https://eur-lex.europa.eu/legal-content/EN/TXT/?uri=CELEX%3A32021R1119.
EU (2011). White Paper Roadmap to a Single European Transport Area – towards a Competitive and Resource Efficient Transport System. European Union Law. Retrieved from http://eur-lex.europa.eu/legal-content/EN/ALL/?uri=CELEX:52011DC0144.
Foretich, A., Zaimes, G. G., Hawkins, T. R., and Newes, E. (2021). Challenges and Opportunities for Alternative Fuels in the Maritime Sector. Marit. Transp. Res., 2, 100033. doi:10.1016/j.martra.2021.100033
GIE (2022). GIE Small Scale LNG Map. Gas Infrastructure Europe (GIE). Retrieved from https://www.gie.eu/publications/maps/gie-small-scale-lng-map/ (Accessed March 10, 2022).
Gómez Vilchez, J. J. (2020). “Alternative Fuels in Transport Systems: A Review on State-Of-The-Art Market Developments in the European Union,” in Proceedings of TRA2020, the 8th Transport Research Arena (Helsinki: Finnish Transport and Communications Agency Traficom). Traficom Research Reports 7/2020.
Gómez Vilchez, J. J., Julea, A., Lodi, C., and Marotta, A. (forthcoming2022). An analysis of Trends and Policies Supporting Alternative Fuels for Road Freight Transport in Europe.
Gómez Vilchez, J. J., Julea, A., Peduzzi, E., Pisoni, E., Krause, J., Siskos, P., et al. (2019). Modelling the Impacts of EU Countries' Electric Car Deployment Plans on Atmospheric Emissions and Concentrations. Eur. Transp. Res. Rev. 11, 40. doi:10.1186/s12544-019-0377-1
Grosso, M., Marques dos Santos, F. L., Gkoumas, K., Stępniak, M., and Pekár, F. (2021). The Role of Research and Innovation in Europe for the Decarbonisation of Waterborne Transport. Sustainability 13 (18), 10447. doi:10.3390/su131810447
H2SHIPS (2022). Project Summary. System-Based Solutions for H2-Fuelled Water Transport in North-West Europe (H2SHIPS). Retrieved from https://www.nweurope.eu/projects/project-search/h2ships-system-based-solutions-for-h2-fuelled-water-transport-in-north-west-europe/ (Accessed April 15, 2022).
IMO (2018). Adoption of the Initial Imo Strategy on Reduction of Ghg Emissions from Ships and Existing Imo Activity Related to Reducing Ghg Emissions in the Shipping Sector. International Maritime Organization. Retrieved from https://unfccc.int/sites/default/files/resource/250_IMO%20submission_Talanoa%20Dialogue_April%202018.pdf.
INEA (2022). GAINN4SEA - GAINN for South Europe mAritime LNG Roll-Out. Retrieved from https://ec.europa.eu/inea/en/connecting-europe-facility/cef-transport/2017-it-tm-0066-w (Accessed April 15, 2022).
JRC (2022). Transport Alternative Fuels Infrastructure Data Collection. European Commission. Joint Research Centre (JRC) Data Catalogue. Retrieved from https://data.jrc.ec.europa.eu/collection/id-00352 (Accessed May 3, 2022).
JRC (2021). Waterborne Transport in Europe - the Role of Research and Innovation in Decarbonisation. Science for Policy Report. Joint Research Centre (JRC). Luxembourg: Publications Office of the European Union. Retrieved from https://publications.jrc.ec.europa.eu/repository/handle/JRC123670.
Lindstad, E., Eskeland, G. S., Rialland, A., and Valland, A. (2020). Decarbonizing Maritime Transport: The Importance of Engine Technology and Regulations for LNG to Serve as a Transition Fuel. Sustainability 12, 8793. doi:10.3390/su12218793
LNGHIVE (2022). LNG for a Sustainable Transport. Retrieved from https://lnghive.com/lng-hive-2/?lang=en (Accessed April 15, 2022).
Moirangthem, K. (2016). Alternative Fuels for Marine and Inland Waterways: An Exploratory Study. Technical Report. Joint Research Centre (JRC). Luxembourg: Publications Office of the European Union. Retrieved from https://publications.jrc.ec.europa.eu/repository/handle/JRC100405.
Power@berth (2022). OPS Master Plan for Spanish Ports. Power@berth. Retrieved from http://poweratberth.eu/?lang=en (Accessed April 15, 2022).
Prussi, M., Scarlat, N., Acciaro, M., and Kosmas, V. (2021). Potential and Limiting Factors in the Use of Alternative Fuels in the European Maritime Sector. J. Clean. Prod. 291, 125849. doi:10.1016/j.jclepro.2021.125849
Styring, P., Duckworth, E. L., and Platt, E. G. (2021). Synthetic Fuels in a Transport Transition: Fuels to Prevent a Transport Underclass. Front. Energy Res. 9, 707867. doi:10.3389/fenrg.2021.707867
UNCTAD (2022). Maritime Transport. Statistics. United Nations Conference on Trade and Development (UNCTAD). Retrieved from https://unctadstat.unctad.org (Accessed March 10, 2022).
UNFCCC (2021). Greenhouse Gas Emissions Data. Time Series. United Nations Framework Convention on Climate Change (UNFCCC). Retrieved from http://di.unfccc.int/time_series (Accessed December 15, 2021).
WaterstofNet (2022). Catalyst for Sustainable Hydrogen Projects. WaterstofNet. Retrieved from https://www.waterstofnet.eu/en.
WTP (2022). Waterborne Technology Platform (WTP). Retrieved from https://www.waterborne.eu/about (Accessed April 15, 2022).
Xing, H., Stuart, C., Spence, S., and Chen, H. (2021). Alternative Fuel Options for Low Carbon Maritime Transportation: Pathways to 2050. J. Clean. Prod. 297, 126651. doi:10.1016/j.jclepro.2021.126651
Glossary
AT Austria
BE Belgium
BG Bulgaria
CY Cyprus
CZ Czech Republic
DE Germany
DK Denmark
EE Estonia
EL Greece
ES Spain
EU European Union
FI Finland
FR France
GHG Greenhouse gas
HR Croatia
HU Hungary
IE Ireland
IMO International Maritime Organization
IT Italy
IWW Inland waterways
LCA Lifecycle assessment
LNG Liquefied natural gas
LPG Liquefied petroleum gas
LT Lithuania
LU Luxembourg
LV Latvia
MT Malta
NIR National implementation report
NL The Netherlands
NPF National policy framework
PL Poland
PT Portugal
RO Romania
RTD&D Research, technological development and demonstration
SE Sweden
SI Slovenia
SSE Shore-side electricity
SK Slovakia
TEN-T Trans-European Network for Transport (TEN-T)
UK United Kingdom
WTW Well-to-wake
Keywords: alternative fuels, electric vessel, energy policy, freight transport, inland waterways, maritime, powertrain technologies, refueling infrastructure
Citation: Gómez Vilchez JJ, Julea A, Lodi C and Marotta A (2022) An Analysis of Trends and Policies Promoting Alternative Fuel Vessels and Their Refueling Infrastructure in Europe. Front. Energy Res. 10:904500. doi: 10.3389/fenrg.2022.904500
Received: 25 March 2022; Accepted: 20 April 2022;
Published: 27 May 2022.
Edited by:
Helena Martín, Universitat Politecnica de Catalunya, SpainReviewed by:
Basim Belgasim, Center for Solar Energy Research and Studies, LibyaOlga Alcaraz Sendra, Universitat Politecnica de Catalunya, Spain
Copyright © 2022 Gómez Vilchez, Julea, Lodi and Marotta. This is an open-access article distributed under the terms of the Creative Commons Attribution License (CC BY). The use, distribution or reproduction in other forums is permitted, provided the original author(s) and the copyright owner(s) are credited and that the original publication in this journal is cited, in accordance with accepted academic practice. No use, distribution or reproduction is permitted which does not comply with these terms.
*Correspondence: Jonatan J. Gómez Vilchez, am9uYXRhbi5nb21lei12aWxjaGV6QGVjLmV1cm9wYS5ldQ==