 Huajin Li
- School of Architecture and Civil Engineering, Chengdu University, Chengdu, China
Wind is a pollution-free renewable energy source. It has attracted increasing attention owing to the decarbonization of electricity generation. However, owing to the dynamic nature of wind speed, ensuring a stable supply of wind energy to electric grid networks is challenging. Therefore, accurate short-term forecasting of wind power prediction plays a key role for wind farm engineers. With the boom in AI technologies, deep-learning-based forecasting models have demonstrated superior performance in wind power forecasting. This paper proposes a short-term deep-learning-based interval prediction algorithm for forecasting short-term wind power generation in wind farms. The proposed approach combines the lower upper bound estimation (LUBE) method and a deep residual network (DRN). Wind farm data collected in northwestern China are selected for this empirical study. The proposed approach is compared with three benchmark short-term forecasting approaches. Extensive experiments conducted on the data collected from five wind turbines in 2021 indicate that the proposed algorithm is efficient, stable, and reliable.
1 Introduction
Wind power, a major source of renewable energy, has been widely developed worldwide to supplement and replace traditional fossil fuels (He and Kusiak 2017; Javed et al., 2020). Owing to the intermittent and stochastic nature of wind, wind power systems face challenges in terms of reliability and stability. Thus, high-quality wind power predictions are expected in practice (Long et al., 2020; Long et al., 2021).
According to a literature review, point estimation plays a dominant role in wind power prediction. Haykin (1994) experimented with multiple architectures of neural networks to explore the power of wind-turbine energy prediction. Kelouwani et al. (2004) first used a neural network and wind speed to forecast wind power based on power curves. Tascikaraoglu and Uzunoglu (2014) proposed the use of an autoregressive integrated moving average model to forecast short-term wind power. Ren et al. (2014) applied adaboost-backpropagation to improve the neural network algorithm and achieved an improved wind power prediction performance. Wu and Peng, (2017) performed short-term wind power prediction using k-means clustering with a bagging neural network. Zhang et al. (2016) adopted a probabilistic support vector machine to predict short-term wind power. Deng et al. (2020) trained deep neural networks (DNNs) to forecast short-term wind power. Li et al. (2021a) introduced a framework called ICEEMDAN to decompose wind power time-series data and discovered that the prediction performance was enhanced. Li et al. (2021b) trained a deep belief network to forecast short-term wind power and used EWMA control charts to monitor abnormal wind power prediction errors. In summary, the point-based prediction of wind power has already achieved promising performance in practice (Long et al., 2022).
High-quality wind power forecasting is expected to reduce uncertainty at various time scales (Ouyang et al., 2017; Huang et al., 2018; Tang et al., 2020). However, point estimation, which outputs a deterministic value, fails to provide sufficient consideration of the prediction uncertainty (Shen and Shen 2018; Ouyang et al., 2020). In comparison, interval prediction with a certain confidence level is gaining popularity among scholars and engineers (Shen et al., 2020). Unlike the point estimation approach, interval prediction quantifies the uncertainty of wind power and provides probabilistic estimation in the temporal domain.
Among various interval prediction methods, the interval prediction model based on the lower and upper bound estimation (LUBE) (Khosravi et al., 2010) approach has become the most popular and has attracted considerable attention. Following the LUBE architecture, a prediction algorithm with two outputs instead of a single output was utilized. The two outputs, which represent the upper and lower bounds, share the same input data vector and hidden layer. Both the loss function and training strategy are identical for both outputs (Sun et al., 2020a).
In this paper, we propose a combination of the LUBE approach with a deep residual network (DRN) for short-term wind power prediction. The DRN is first modified with two outputs that represent the upper and lower bounds of the prediction interval. The LUBE approach was then utilized to train the DRN algorithm. Here, the coverage width-based criterion (CWC) was selected as the objective function to optimize the DRN, and the Adam optimizer was adopted to optimize the CWC. Field data collected from a wind farm located in northwest China were used for the case study.
The main contributions of this paper can be concluded as follows:
• A new approach combining a DRN and the LUBE method is proposed for wind power interval prediction.
• Supervisory control and data acquisition (SCADA) data considering wind speed, wind direction, ambient temperature, air density, historic power output, gearbox bearing temperature, rotor speed, and pitch angle are utilized as inputs for power interval prediction.
The remainder of this paper is organized as follows. Section 2 introduces the DRN structure, the LUBE approach, other popular interval prediction algorithms, and evaluation metrics. Section 3 introduces the dataset and the variables used for interval prediction. Section 4 presents the computational results. Section 5 concludes the paper.
2 Methodology
2.1 Deep Residual Network
DNNs have achieved promising performances in both classification and regression tasks (Li et al., 2020; Li et al., 2022). However, in practice, gradient vanishing or explosion during the training process presents a challenge. The DRN, which incorporates the residual unit into the DNNs, is capable of offering superior performance in supervised learning tasks, such as image classification, target detection, and statistical anomaly detection (Sun et al., 2020b; Shen et al., 2021; Shen and Raksincharoensak, 2021).
According to a literature review (He et al., 2016), a single residual unit can be expressed as follows:
where
Compared with the conventional DNN architecture, the DRN has two major advantages: first, it does not experience the problem of gradient vanishing or explosion during the training process; second, the backpropagation step enables gradient progression from the deeper layer to the shallow layer. Thus, the residual characteristics enable a smooth transfer of information between the deeper and shallow layers. This guarantees successful training of the DRN in practice.
2.2 Lower Upper Bound Estimation Approach With Deep Residual Network
A common misconception in practice during interval prediction is that data follow a certain distribution (Shen et al., 2019). Although such an assumption can simplify the construction of prediction intervals (PIs), it can cause other problems concerning the possible deviation of the data from the pre-assumed distribution (Ouyang et al., 2019b; Ouyang et al., 2019c).
Khosravi et al. (2010) first proposed the LUBE approach for interval prediction in 2011. The proposed approach is based on the PI of neural networks and aims to train neural networks by minimizing the objective function of the PI. Instead of a single output for point-based estimation, the LUBE approach involves two outputs: the upper and lower boundaries of the PI. Here, the PI includes the predicted values within a certain range, along with a computed probability as the confidence level, which is based on historical data. Generally, high-quality interval prediction refers to the actual measured values that fall within the PI as much as possible, whereas the PI is as narrow as possible.
In this study, the LUBE approach was incorporated with a DRN to provide PIs for short-term wind energy. Figure 1 shows the revised version of the DRN that was applied using the LUBE approach. Figure 1A shows the general neural network architecture using the LUBE approach for interval prediction. It contains an input layer, hidden layer, and two output layers that represent both the lower and upper boundaries of the PIs. The PI denotes the interval between the two boundaries, and a correct prediction implies that the actual value falls within the PI. The hidden layers of the DRN differ from those in conventional neural networks. Instead of a layer with hidden nodes (see Figure 1B), the DRN contains residual blocks as hidden layers. As shown in Figure 1C, each residual block inputs the data into a residual function, and the output of the residual function is concatenated with the original input. It then passes through the ReLU activation function, as described in Section 2.1.
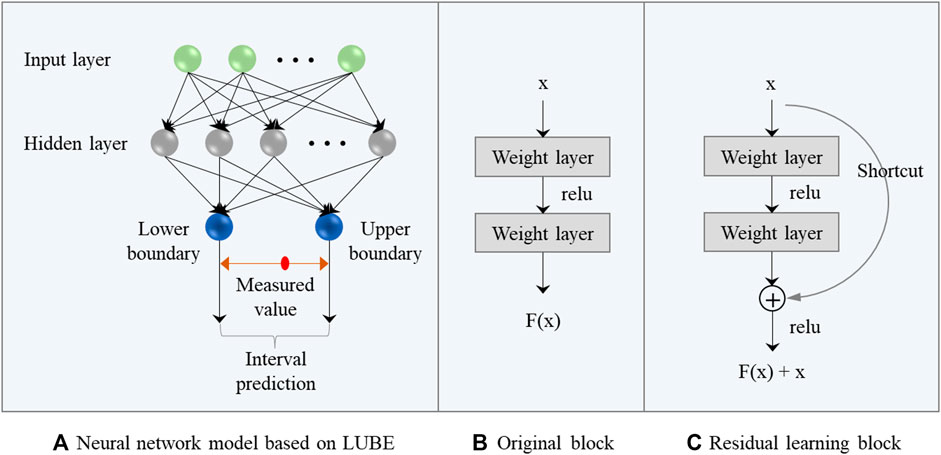
FIGURE 1. Deep residual network integrated with LUBE approach.
According to Figure 1, the main advantage of the proposed method that uses a DRN and the LUBE approach for short-term wind power forecasting is evident: it simplifies the process of PI construction. The LUBE approach uses a feed-forward strategy to estimate the lower and upper boundaries of the PI. By outputting two point forests that represent the two boundaries, the actual short-term wind power is expected to fall within the PI.
2.3 Other Interval Prediction Algorithms
Besides the DRN, there are other popular benchmark interval prediction algorithms, such as artificial neural networks (ANN), extreme learning machines (ELM), and kernel extreme learning machines (KELM). They achieved promising results in other time-series interval prediction tasks and were also selected and trained in this study for comparative analysis against the proposed DRN using the same LUBE approach.
The ANN is a nonparametric supervised learning analytic algorithm, that is, widely used for classification and regression tasks (Li et al., 2018). It is capable of performing high-quality predictions, as it is modeled after the processes of learning in a cognitive system. The ANN can accurately and effectively extract patterns from the dataset and construct mapping relationships between inputs and outputs. A typical ANN architecture contains an input layer, one or more hidden layers, and an output layer. The output of each neuron inside the layers is based on the neuron of the previous layer and its associated weights, which can be expressed by Eq. 2:
where
An ELM is a novel single-hidden-layer feedforward neural network (SLFN) proposed by Huang et al. (2018). It randomly initializes the linking weights and biases, and contains a limited number of hidden neurons defined by the users. With only one hidden layer, the ELM is capable of obtaining unique optimal output weights using only a one-step calculation, and thus obtains a high training speed. For a given dataset with input
where
where
KELM is an improved version of the ELM and has a higher generalization capacity and less chance of overfitting (Iosifidis et al., 2015). Compared with the vanilla ELM, it introduces a kernel function
where
2.4 Objective Function and Evaluation Metrics
Once the PIs are constructed, it is essential to evaluate the quality of their output from interval prediction algorithms. In general, interval prediction algorithms aim to predict an interval that encompasses predicted points under a certain confidence level (Ouyang et al., 2019a). Thus, the prevailing two dimensions, i.e., the coverage rate and interval width, are key quantitative metrics for the quality evaluation of the constructed PIs.
First, the PI coverage probability (PICP) (Khosravi et al., 2011) was utilized to measure the coverage rate. The PICP can be computed using Eq. 7:
where
Second, the PI normalized average width (PINAW) (Kavousi-Fard et al., 2015) was introduced in this study to evaluate the PI width. The PINAW can be computed as follows:
where
In addition, the coverage width-based criterion (CWC) (Taormina and Chau, 2015), which considers both the PI width and coverage, was computed in this study. The computation of the CWC can be achieved using Eq. 9.
where the parameters
3 Dataset Summary
Field data were collected from a wind farm located in northwestern China in 2021. The wind farm contains more than 200 wind turbines, all of which have a rated power of 16 MW. To manage the wind turbines, the wind farm installed a standard SCADA system, which is principally used for performance monitoring. The SCADA system provides a considerable amount of data collected at a 10-min resolution. In total, more than 100 variables were collected by the SCADA system in real time, and they varied widely in terms of scale and type. The top eight SCADA variables related to wind power were selected in this study and are summarized in Table 1.

TABLE 1. SCADA variables utilized in this study.
According to Table 1, eight prevailing SCADA variables were utilized as inputs for the interval prediction task in this study. Half of the selected variables were environmental factors and the others were either the electrical or mechanical characteristics of the wind turbine measured. The selected variables overlap with those used by the majority of related studies, confirming the validity of the selection.
4 Experimental Results
To perform short-term wind power forecasting, experiments were conducted to train the DRN following the LUBE approach. In this study, the entire day dataset was utilized as the training dataset and the 10-min following wind power as the target output. The CWC was selected as the objective function, and the Adam optimizer tuned the hyperparameters of the DRN.
Figure 2 displays the training process of the DRN together with those of three other benchmark interval forecasting algorithms: ANN, ELM, and KELM. All the tested interval forecasting algorithms were trained using the LUBE approach, as described in Section 2.2. In total, 100 training epochs were set for all the interval forecasting algorithms. It can be observed that using DRN, the CWC converges around the first 20 epochs, which is significantly higher than the CWC from other interval prediction algorithms. This demonstrates the superiority of the proposed interval prediction approach using the DRN.
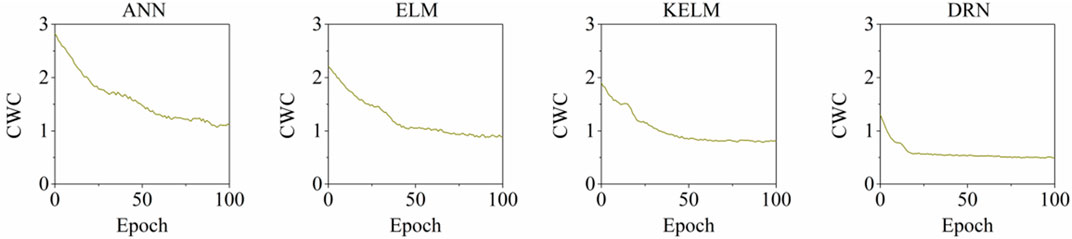
FIGURE 2. Changes of CWC at different training epochs.
In addition, this study also explored the relationship between the prediction horizon and CWC. Here, as see Figure 3, instead of single 10-min ahead power forecasting, we also tested the interval prediction performance of multiple horizons from 20-min ahead to 200-min ahead. Intuitively, the CWC for all the algorithms escalates as the prediction horizon increases. Comparatively, the CWC values of DRN escalate slower than those of the other algorithms, which confirms its outperformance in interval prediction tasks in longer prediction horizons.
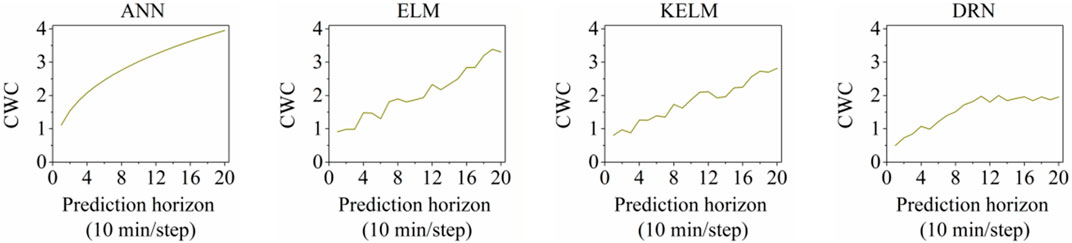
FIGURE 3. Changes of CWC at different prediction horizons.
Finally, 10-min ahead short-term wind power forecasting was performed on the test dataset, as presented in Figure 4, which includes the interval forecasting outcome from a whole day in four different seasons. The PIs denote the 95% confidence interval within which the actual power falls, and the target represents the measured wind power according to the SCADA system. A summary of interval forecasting on the test data is provided in Table 2.
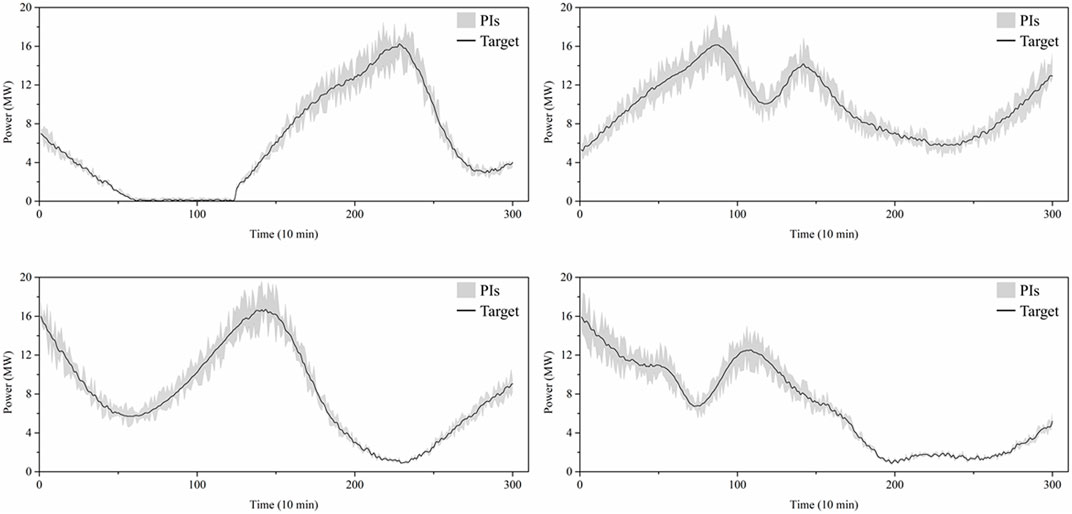
FIGURE 4. Constructed PIs and actual target wind power of the test dataset.
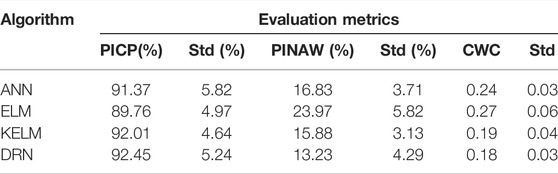
TABLE 2. Summary of the interval prediction performance.
As summarized in Table 2, all the tested algorithms in this study were trained using the LUBE approach and examined using the same test dataset. The proposed DRN produced the highest PICP and the lowest PINAW and CWC values. All evaluation metrics were computed as mean and standard deviation. The computational results confirmed the superiority of the proposed approach.
5 Conclusion
In this paper, we propose an interval prediction approach that provides probabilistic short-term wind turbine power generation. SCADA data at 10-min resolution were collected from a wind farm in northwestern China for the case studies. A DRN integrated with the LUBE approach was proposed in a short-term interval forecasting framework. A comparative analysis was performed with three other popular interval prediction algorithms. The computational results confirmed that the interval prediction error of the short-term wind power increased as the prediction horizon became more distant. The proposed approach using a DRN produced the best results for power interval prediction. The application of this model requires the development of new wind turbine control approaches.
Data Availability Statement
The original contributions presented in the study are included in the article/Supplementary Material, further inquiries can be directed to the corresponding author.
Author Contributions
HL conceptualized the study, contributed to the study methodology, data curation, software and formal analysis, and wrote the manuscript.
Funding
This research is supported by the “Miaozi project” of scientific and technological innovation in Sichuan Province, China (Grant No. 2021090) and the Opening fund of State Key Laboratory of Geohazard Prevention and Geoenvironment Protection (Chengdu University of Technology) (Grant No. SKLGP 2021K014).
Conflict of Interest
The author declares that the research was conducted in the absence of any commercial or financial relationships that could be construed as a potential conflict of interest.
Publisher’s Note
All claims expressed in this article are solely those of the authors and do not necessarily represent those of their affiliated organizations, or those of the publisher, the editors and the reviewers. Any product that may be evaluated in this article, or claim that may be made by its manufacturer, is not guaranteed or endorsed by the publisher.
Reference
Deng, X., Shao, H., Hu, C., Jiang, D., and Jiang, Y. (2020). Wind Power Forecasting Methods Based on Deep Learning: A Survey. Comput. Model. Eng. Sci. 122 (1), 273–301. doi:10.32604/cmes.2020.08768
Haykin, S. (1994). Neural Networks: A Comprehensive Foundation, 2. Prentice Hall PTR: United States, 41.
He, K., Zhang, X., Ren, S., and Sun, J. (2016). “Deep Residual Learning for Image Recognition,” in Proceedings of the IEEE Conference on Computer Vision and Pattern Recognition, Las Vegas, NV, United States, June 27–June 30, 2016 (IEEE), 770–778. doi:10.1109/cvpr.2016.90
He, Y., and Kusiak, A. (2017). Performance Assessment of Wind Turbines: Data-Derived Quantitative Metrics. IEEE Trans. Sustain. Energy 9 (1), 65–73. doi:10.1109/TSTE.2017.2715061
Huang, H., Liu, F., Zha, X., Xiong, X., Ouyang, T., Liu, W., et al. (2018). Robust Bad Data Detection Method for Microgrid Using Improved ELM and DBSCAN Algorithm. J. Energy Eng. 144 (3), 04018026. doi:10.1061/(asce)ey.1943-7897.0000544
Iosifidis, A., Tefas, A., and Pitas, I. (2015). On the Kernel Extreme Learning Machine Classifier. Pattern Recognit. Lett. 54, 11–17. doi:10.1016/j.patrec.2014.12.003
Javed, M. S., Ma, T., Jurasz, J., and Amin, M. Y. (2020). Solar and Wind Power Generation Systems with Pumped Hydro Storage: Review and Future Perspectives. Renew. Energy 148, 176–192. doi:10.1016/j.renene.2019.11.157
Kelouwani, S., and Agbossou, K. (2004). Nonlinear Model Identification of Wind Turbine With a Neural Network. IEEE Trans. Energy Convers. 19 (3), 607–612.
Kavousi-Fard, A., Khosravi, A., and Nahavandi, S. (2015). A New Fuzzy-Based Combined Prediction Interval for Wind Power Forecasting. IEEE Trans. Power Syst. 31 (1), 18–26.doi:10.1109/TPWRS.2015.2393880
Khosravi, A., Nahavandi, S., Creighton, D., and Atiya, A. F. (2010). Lower Upper Bound Estimation Method for Construction of Neural Network-Based Prediction Intervals. IEEE Trans. Neural Netw. 22 (3), 337–346. doi:10.1109/TNN.2010.2096824
Khosravi, A., Mazloumi, E., Nahavandi, S., Creighton, D., and Van Lint, J. W. C. (2011). Prediction Intervals to Account for Uncertainties in Travel Time Prediction. IEEE Trans. Intell. Transp. Syst. 12 (2), 537–547. doi:10.1109/tits.2011.2106209
Li, H., Deng, J., Feng, P., Pu, C., Arachchige, D. D. K., and Cheng, Q. (2021a). Short-Term Nacelle Orientation Forecasting Using Bilinear Transformation and ICEEMDAN Framework. Front. Energy Res. 9, 780928. doi:10.3389/fenrg.2021.780928
Li, H., Deng, J., Yuan, S., Feng, P., and Arachchige, D. D. K. (2021b). Monitoring and Identifying Wind Turbine Generator Bearing Faults Using Deep Belief Network and EWMA Control Charts. Front. Energy Res. 9, 799039. doi:10.3389/fenrg.2021.799039
Li, H., He, Y., Xu, Q., Deng, j., Li, W., and Wei, Y. (2022). Detection and Segmentation of Loess Landslides via Satellite Images: a Two-phase Framework. Landslides 19, 673–686. doi:10.1007/s10346-021-01789-0
Li, H., Xu, Q., He, Y., and Deng, J. (2018). Prediction of Landslide Displacement with an Ensemble-Based Extreme Learning Machine and Copula Models. Landslides 15 (10), 2047–2059. doi:10.1007/s10346-018-1020-2
Li, H., Xu, Q., He, Y., Fan, X., and Li, S. (2020). Modeling and Predicting Reservoir Landslide Displacement with Deep Belief Network and EWMA Control Charts: a Case Study in Three Gorges Reservoir. Landslides 17 (3), 693–707. doi:10.1007/s10346-019-01312-6
Long, H., Li, P., and Gu, W. (2020). A Data-Driven Evolutionary Algorithm for Wind Farm Layout Optimization. Energy 208, 118310. doi:10.1016/j.energy.2020.118310
Long, H., Xu, S., and Gu, W. (2022). An Abnormal Wind Turbine Data Cleaning Algorithm Based on Color Space Conversion and Image Feature Detection. Appl. Energy 311, 118594. doi:10.1016/j.apenergy.2022.118594
Long, H., Zhang, C., Geng, R., Wu, Z., and Gu, W. (2021). A Combination Interval Prediction Model Based on Biased Convex Cost Function and Auto-Encoder in Solar Power Prediction. IEEE Trans. Sustain. Energy 12 (3), 1561–1570. doi:10.1109/tste.2021.3054125
Ouyang, T., Pedrycz, W., and Pizzi, N. J. (2019c). Rule-based Modeling with DBSCAN-Based Information Granules. IEEE Trans. Cybern. 51 (7), 3653–3663. doi:10.1109/TCYB.2019.2902603
Ouyang, T., Pedrycz, W., Reyes-Galaviz, O. F., and Pizzi, N. J. (2019b). Granular Description of Data Structures: A Two-phase Design. IEEE Trans. Cybern. 51 (4), 1902–1912. doi:10.1109/TCYB.2018.2887115
Ouyang, T., He, Y., Li, H., Sun, Z., and Baek, S. (2019a). Modeling and Forecasting Short-Term Power Load with Copula Model and Deep Belief Network. IEEE Trans. Emerg. Top. Comput. Intell. 3 (2), 127–136. doi:10.1109/tetci.2018.2880511
Ouyang, T., Huang, H., He, Y., and Tang, Z. (2020). Chaotic Wind Power Time Series Prediction via Switching Data-Driven Modes. Renew. Energy 145, 270–281. doi:10.1016/j.renene.2019.06.047
Ouyang, T., Kusiak, A., and He, Y. (2017). Modeling Wind-Turbine Power Curve: A Data Partitioning and Mining Approach. Renew. Energy 102, 1–8. doi:10.1016/j.renene.2016.10.032
Ren, Y., Qiu, X., and Suganthan, P. N. (2014). “Empirical Mode Decomposition Based Adaboost-Backpropagation Neural Network Method for Wind Speed Forecasting,” in 2014 IEEE Symposium on Computational Intelligence in Ensemble Learning (CIEL), Orlando, FL, United States, December 09–December 12, 2014 (IEEE), 1–6.
Shen, X., Ouyang, T., Yang, N., and Zhuang, J. (2021). Sample-Based Neural Approximation Approach for Probabilistic Constrained Programs. IEEE Trans. Neural Netw. Learn. Syst.. doi:10.1109/tnnls.2021.3102323
Shen, X., Ouyang, T., Zhang, Y., and Zhang, X. (2020). Computing Probabilistic Bounds on State Trajectories for Uncertain Systems. IEEE Trans. Emerg. Top. Comput. Intell.. doi:10.1109/tetci.2020.3019040
Shen, X., and Raksincharoensak, P. (2021). Pedestrian-aware Statistical Risk Assessment. IEEE Trans. Intelligent Transp. Syst.. doi:10.1109/tits.2021.3074522
Shen, X., and Shen, T. (2018). Chance-constrained Optimization for Torque Tracking Control with Improving Fuel Economy in Spark-Ignition Engines. SICE J. Control, Meas. Syst. Integration 11 (4), 365–371. doi:10.9746/jcmsi.11.365
Shen, X., Zhuang, J., and Zhang, X. (2019). Approximate Uncertain Program. IEEE Access 7, 182357–182365. doi:10.1109/access.2019.2958621
Sun, Z., He, Y., Gritsenko, A., Lendasse, A., and Baek, S. (2020a). Embedded Spectral Descriptors: Learning the Point-wise Correspondence Metric via Siamese Neural Networks. J. Comput. Des. Eng. 7 (1), 18–29. doi:10.1093/jcde/qwaa003
Sun, Z., Rooke, E., Charton, J., He, Y., Lu, J., and Baek, S. (2020b). Zernet: Convolutional Neural Networks on Arbitrary Surfaces via Zernike Local Tangent Space Estimation. Comput. Graph. Forum 39 (6), 204–216. doi:10.1111/cgf.14012
Tang, Z., Li, Y., Chai, X., Zhang, H., and Cao, S. (2020). Adaptive Nonlinear Model Predictive Control of Nox Emissions under Load Constraints in Power Plant Boilers. J. Chem. Eng. Jpn. 53 (1), 36–44. doi:10.1252/jcej.19we142
Taormina, R., and Chau, K.-W. (2015). ANN-based Interval Forecasting of Streamflow Discharges Using the LUBE Method and MOFIPS. Eng. Appl. Artif. Intell. 45, 429–440. doi:10.1016/j.engappai.2015.07.019
Tascikaraoglu, A., and Uzunoglu, M. (2014). A Review of Combined Approaches for Prediction of Short-Term Wind Speed and Power. Renew. Sustain. Energy Rev. 34, 243–254. doi:10.1016/j.rser.2014.03.033
Wu, W., and Peng, M. (2017). A Data Mining Approach Combining $K$ -Means Clustering with Bagging Neural Network for Short-Term Wind Power Forecasting. IEEE Internet Things J. 4 (4), 979–986. doi:10.1109/jiot.2017.2677578
Keywords: SCADA data, wind power, deep residual networks, LUBE approach, interval prediction
Citation: Li H (2022) SCADA Data Based Wind Power Interval Prediction Using LUBE-Based Deep Residual Networks. Front. Energy Res. 10:920837. doi: 10.3389/fenrg.2022.920837
Received: 15 April 2022; Accepted: 27 April 2022;
Published: 12 May 2022.
Edited by:
Xun Shen, Tokyo Institute of Technology, JapanReviewed by:
Huan Long, Southeast University, ChinaZhenhao Tang, School of Automatic Engineering.Northeast Electric Power University, China
Copyright © 2022 Li. This is an open-access article distributed under the terms of the Creative Commons Attribution License (CC BY). The use, distribution or reproduction in other forums is permitted, provided the original author(s) and the copyright owner(s) are credited and that the original publication in this journal is cited, in accordance with accepted academic practice. No use, distribution or reproduction is permitted which does not comply with these terms.
*Correspondence: Huajin Li, bGlodWFqaW5AY2R1LmVkdS5jbg==