 Nadya Noorfatima
 Yunjeong Choi
 Jaesung Jung
- Power System Laboratory, Department of Energy Systems Research, Ajou University, Suwon, South Korea
Community-based peer-to-peer (P2P) energy trading is applied to manage local market transactions to maximize the social welfare of the community. However, the increasing number of distributed energy resources in distribution systems affects the performance of community-operators in P2P energy trading. Hence, this study develops a community-based P2P energy trading mechanism to ensure fair profit allocation and reduce computation cost, even with numerous participants. To achieve this, the P2P participants were aggregated into smaller groups using the K-means clustering method, allowing the community manager to perform market transactions in a hierarchical manner. In the hierarchical P2P market, social welfare maximization is performed in the higher layer and profit distribution in the lower layer. Furthermore, the Z-bus network cost allocation method was applied to determine the network usage cost and was thus considered as a parameter to ensure fair profit allocation based on the Shapley value. The proposed method was simulated in South Korean P2P energy trading at various market scales. The results showed an improvement in the proposed method compared with conventional single-layer community-based P2P energy trading.
1 Introduction
The modern trend of power systems has shifted from centralized to decentralized operation. Some private companies are allowed to provide market services to accommodate customers who want to sell or buy electricity directly to each other, known as peer-to-peer (P2P) energy trading. Over time, the P2P energy trading method has been developed to suit the needs of customers who prefer trading without full involvement. Hence, community-based P2P energy trading with a community manager is employed, which allows the advanced involvement of prosumers and consumers. In this method, the community manager determines the combination of sellers and buyers by optimizing the social welfare of the local community. Furthermore, because the method is independent of centralized market operation, the market regulation of community-based P2P energy trading can be adjusted based on the conditions of the local market.
In this regard, community-based P2P energy trading should be a reliable method for anticipating the surge in the growth of distributed energy resource (DER) installations in the local grid. Currently, the growth of commercial photovoltaics (PV) and residential PV is predicted to increase up to 9 GW under normal conditions and 21 GW under accelerated conditions in the next 3 years worldwide (International Energy Agency, 2020). However, with the increasingly crowded system, it is challenging for community managers to maintain reliable market operations, including social welfare optimization and profit attribution, which is performed simultaneously in a single layer (Heo et al., 2021). This is because, along with a larger system, the computation cost performed in a single layer is high and requires extensive computation time. The solution to this issue to segregate larger systems into smaller subsystems using a clustering method. K-means clustering provides optimal clustering with a relatively simple implementation and thus can be scaled up to large datasets (Kanungo et al., 2002). In this case, community-based P2P energy trading is performed in a bi-layer manner, where the community manager determines the matching capacity based on aggregated prosumers and consumers in the higher layer, and thus the profit will be distributed to members of each cluster in lower layer. In addition, in the bi-layer community-based P2P energy trading, all types of customers can participate in the market despite of their different profiles through discriminative pricing in higher layer and uniform pricing in lower layer.
A drawback of a segregated market is the emergence of a uniform trading profile among the members of each group. Uniform trading profiles, especially in terms of price, complicate the diversification process to provide optimal profit distribution. In addition, even within similar price ranges, an imbalance will occur in market, shifting larger market power towards larger customers, which are capable of supplying or buying more capacities. Azim et al. (2020) elaborates the impact of P2P energy trading on power losses, which could diversify the allocation of members on each group. In this paper, the determination of members on each cluster considers the network usage cost, which initially is translated from loss allocation. Z-bus network cost allocation (NCA) is a mathematically proven method that is more preferable than the existing NUC allocation method because of its capability to determine the contributions of each peer in network usage by considering network constraints (Conejo et al., 2007). Determining the contribution of each peer through the network usage cost by using Z-bus NCA method gives additional consideration to profit distribution and provides an appropriate network usage compensation allocation method.
However, the drawback of the Z-Bus NCA method is that it requires a power-flow solution, thus making the calculation model nonlinear and complex. Therefore, it is not possible to involve the NUC calculation in social welfare optimization for determining the matched capacity between participants. Hence, to simplify the calculation, the NUC from the Z-bus NCA method is formulated as a weighting factor. To incorporate P2P energy trading, the weighting factor determination requires proper representation of rational economic behavior, which in this case game theory concept is considered. The cooperative game theory and non-cooperative game theory approaches being implemented in P2P energy trading have been studied in (Acuña et al., 2018; Li et al., 2022). Nevertheless, the aims of community-based P2P is to emphasize the coalition formation among participants as grand as possible. Hence, this study considers cooperative game theory rather than non-cooperative approach. In addition, among cooperative game theory methods, Shapley Value (SV) is considered as the most stable marginal contributions of agents in terms of forming grand coalition (Sweta et al., 2022). By using SV as the foundation of determining weighting factor, the possibility of unfair treatment between participants will be reduced. Since SV has a computational issue when calculating a large number of participants, thus SV computation will be modified in this study.
This paper aims to fulfill the above research gaps, thereby contributes the following to the P2P energy systems research.
1) This study proposes the development of community-based P2P energy trading using the Z-bus NCA method. The proposed method aims to improve community-based P2P in terms of accommodating more market participants by reducing computational burden through bi-layer manner.
2) This study incorporates network condition into the trading process through implementation of weighting factor in the objective function. The weighting factor is calculated as SV, which is determined as NUC calculated from Z-bus NCA method.
3) To accelerate the computational process, this study modifies the SV calculation by decomposing market participants into smaller groups. This modification refers to the axioms of the SV, so that contribution of each peer towards the whole system can be calculated even if it is done in a local group.
4) Compared to the conventional single-layer community-based P2P energy trading, the proposed bi-layer method shows some improvements: reduce computation time of the market clearing, distribute profit more fairly, and increase profit among peers.
The remainder of the paper is organized as follows. Section 2 and Section 3 elaborate on the operator-oriented model as a representation of community-based P2P and the proposed market mechanism modification, respectively. Subsequently, several test cases in Section 4 are used to validate the proposed modification of the market mechanism and to verify the improvement compared with the current operator-oriented model. The conclusion and scope of future research are presented in Section 5.
2 Community-Based Peer-to-Peer Energy Model
In community-based P2P energy models, the local market operator manages the electricity trading of agents. The local market operator acts as an aggregator that communicates with each peer or entity involved in P2P energy trading. This model determines the energy import/export of peers or the operating state of the devices among peers based on the information gathered from their peers. The advantages of community-based P2P energy trading are that the social welfare of the optimal system model can be obtained by a single authority and the aggregator can manage energy generation and demand patterns, resulting in less uncertainty.
Heo et al. (2021) proposed an operator-oriented P2P model, where participants perform transactions and share profits with each other through a platform that is managed by an operator. An operator-oriented P2P model was constructed based on the concept of a community-based P2P energy trading mechanism. In this model, it is assumed that participants do not have a forecasting system to make decisions on their own. Therefore, on behalf of the participants, the operator provided a forecasting service to estimate the loading and generation profiles of each participant. Briefly, the operator-oriented P2P model is constructed using two main procedures: trading price determination and the matching process (Nojavan and Zare, 2020).
The trading price is determined by the marginal buying and selling prices of consumers and prosumers, respectively. The marginal buying price indicates the maximum threshold that determines whether the consumer will participate in P2P energy trading. A progressive electricity tariff is adopted to calculate the marginal buying price, which can be modified based on the trading profile of the previous month. Furthermore, the marginal selling price represents the minimum threshold at which prosumers sell their energy through P2P energy trading. The marginal selling price is determined from the net-metering scheme and progressive electricity tariff for commercial and residential PV owners, respectively.
The matching process constructs all the possible coalitions between potential consumers and prosumers. All possible coalitions are obtained through an optimization algorithm, which is constructed by the single-layer objective function and inequality constraints. The objective function of the original operator-oriented P2P model is calculated as follows:
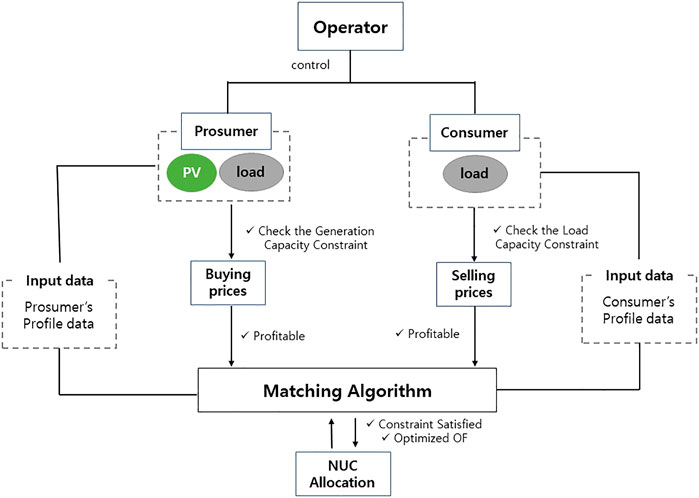
FIGURE 1. Operator-oriented P2P market mechanism.
3 Proposed Community-Based Operator-Oriented Peer-to-Peer Energy Model Development
Optimizing social welfare for the entire system is a challenge for the community-based P2P energy model. In this case, the local market operator determines the marginal market price of each market participant based on transaction capacity and expected network utility cost. The Z-bus network cost allocation method distributes the network usage cost to participants based on compensation, which is equivalent to the network utility cost. Furthermore, to maintain proper profit attribution, cooperative game theory was applied to community-based P2P using the SV.
3.1 Z-Bus Network Cost Allocation
The Z-Bus NCA method allocates NUC to network-linked resources by considering the impedance matrix through line parameters and currents flowing through the line together (Delberis et al., 2009). This particular method has several characteristics, such as 1) no prior proportion to split transmission costs between generators and loads, 2) provides an appropriate mathematical behavior, 3) the NUC results have a proximity effect with respect to line parameters, and 4) allows calculation in the counter-flow direction. The first characteristic, no prior proportion of split transmission costs between generators and loads, allocates contributions simultaneously between prosumers and consumers. Hence, the proportion of all prosumers to all consumers will not be equally distributed.
In addition, the second characteristic of Z-Bus NCA method is providing appropriate mathematical behavior. The Z-Bus NCA method was developed by deriving physical parameters to obtain network usage due to power flow through a line as a function of the generator or function of load equivalent to current sources (Conejo et al., 2001). Therefore, the NUC results will be calculated in a separate manner, thus preventing cross-subsidies between prosumers and consumers. Furthermore, this method provides the proximity effect reflected in the NUC results with respect to the line parameters. For example, a particular generation or load can be imposed with a significantly different NUC. Finally, the Z-Bus NCA method allows counterflow direction under the condition of non-symmetrical electrical distance assumption, which causes different proportions between currents with the same and opposite directions. The NUC calculation using the Z-bus NCA method was formulated as follows:
First, the admittance matrix is calculated to determine the current flow in each line,
where
where
3.2 Shapley Value
In cooperative game theory, the SV concept is introduced to determine the fair attribution of either gain or cost to all possible coalitions (Veeramsetty, 2021). The fair attribution of SV is defined as the average of all marginal contributions of each actor in the game. SV represents the average marginal contribution by calculating the marginal contribution of an agent based on all the possible joining orders. A possible joining order is defined as a permutation of the total number of agents in a coalition. SV is calculated using the following equation (Maleki et al., 2020).
where
It is widely known that cooperative game theory using SV results in intensive computation, especially for a large coalition. Therefore, to ease the computational process, SV has several propositions (Azuatalam et al., 2019):
• Additivity means that, for any two additive games, a solution can be given to all players. That is, an additive solution that assigns payoffs to the players in the combined game is equal to the sum of players’ payoffs in the combined game, that is, the sum of their payoffs in the two separate games. Mathematically, the additivity proposition can be rewritten as
• Symmetrical shows that equal payments are made to symmetric players, where exchanging any player between coalitions will not change the corresponding worth of coalition. This axiom can be rewritten as follows:
• Efficiency means that the sum of attributions must be equal to the total gain of grand coalition
• Dummy shows that any player who has no contribution to any coalition has a zero payoff (
SV is the only pay-off attribution mechanism that simultaneously exhibits these four characteristics (Algaba et al., 2019). In terms of fair profit attribution, community-based P2P energy trading should be operated by satisfying these four proportions. The aims of community-based P2P energy trading are to optimize benefits for all stakeholders and encourage more local electricity customers to participate. Hence, the SV can be an appropriate payoff distribution scheme to be applied to community-based P2P energy trading. In this study, the SV will be calculated in smaller aggregated peers by considering peers’ contributions with respect to the global objective function, which will be explained in the following section. Regarding this, the peers will be gathered into groups by using a clustering method.
3.3 Clustering
Clustering is the process of dividing entire datasets into smaller groups, which are known as clusters, based on certain characteristics of the data points. Clustering is applied in community-based P2P energy trading to reduce the computing load by aggregating customers with similar features. Because the market is designed to accommodate as many market participants as possible, K-means clustering is applied to aggregate customers with similarities in features. The K-means clustering method is a clustering analysis with an iterative algorithm (Li and Wu, 2012).
K-means clustering groups similar data points and determines the basic patterns of the clusters by considering a fixed number of clusters, which is determined a priori. Assume that there is a set
where
The principle of K-means clustering computation is Lloyd’s algorithm, also known as the Voronoi iteration or relaxation (Xu et al., 2020). In the initial step of processing the learning data, the K-means algorithm in data clustering begins with the first group of randomly selected centroids. Thus, the first group of randomly selected centroids is assumed as the beginning point of every cluster. Then, the algorithm performs repetitive computations to satisfy the objective function by optimizing the positions of the centroids, and thus stops when there is no change in the centroid value (Fränti and Sieranoja, 2019). In this study, the K-means clustering considers the trading profile of P2P energy trading participants to determine the groups of peers, which will be explained in detail in the following section.
3.4 Proposed Development of Community-Based Peer-to-Peer Energy Trading
This section presents the measures of the developed community-based P2P energy trading. To operate in the local energy market, the expected buying and selling prices of consumers and prosumers are determined, respectively. The buying and selling prices of customers are derived from the purchase electricity tariff, and thus, shows the features of the datasets. To enhance the capability of community-based P2P energy trading to accommodate large markets with many participants, the market operator aggregates customers with similar trading prices.
Trading prices consist of selling and buying prices. The selling price represents the marginal price, which equals the compensation for losing the opportunity cost to self-consume generation capacity. In general, there are four types of sellers: residential, commercial, industrial, and standalone. The selling marginal price for each seller type is as follows:
3.4.1 Residential Prosumer
The trading price for a residential prosumer is represented by a progressive pricing mechanism or block rate pricing method. Thus, the trading price can be rewritten as follows:
3.4.2 Commercial Prosumer
For commercial prosumers, the trading price is determined by referring to time-of-use (TOU) pricing for commercial customers. The trading price for commercial prosumer is expressed as follows:
3.4.3 Industrial Prosumer
Similarly, the selling marginal price for industrial prosumer is equal to the TOU price for the industrial customers. The trading price can be rewritten as follows:
3.4.4 Stand-Alone Distributed Energy Resource
It is assumed that the stand-alone DER is part of the decentralized electricity market, which is operated by an independent system operator. Hence, the selling marginal price of the stand-alone DER can be represented as equal to the system marginal price (SMP). The trading price of the standalone DER is calculated as follows:
Furthermore, for economic reasons, electricity customers should participate in P2P energy trading to gain by transacting in lower electricity tariffs. In this case, the buying price of each consumer is defined as the marginal price if the customers buy electricity from the utility company. Consumers are considered to include residential, commercial, and industrial consumers. The marginal price of each buyer type is identified as follows:
3.4.5 Residential consumer
Similar to the residential prosumer, the buying marginal price of the residential consumer is determined using the block rate pricing method. Hence, we formulate the trading price as follows:
3.4.6 Commercial consumer
The marginal buying price of commercial consumers is represented equally by the electricity tariff if a commercial consumer buys electricity from the grid. Thus, the trading prices of commercial consumers can be rewritten as follows:
3.4.7 Industrial consumer
Industrial consumers are charged TOU prices if they buy electricity from the grid. In this case, the marginal buying price for determining the trading price is formulated as follows:
As can be seen in trading price determination, a few participants may have similar trading prices due to their types. However, in actual conditions, an agent may have different contributions to obtaining a grand coalition because of the network usage cost. In this case, SV is calculated to represent the marginal contribution of each market participant with respect to NUC. On the other hand, because the Z-bus NCA method requires a power flow solution, which is acknowledged as a nonlinear calculation, it will be insufficient to include NUC directly in the market clearing process. Therefore, NUC is represented as a weighting factor, which is determined by referring to the SV formula.
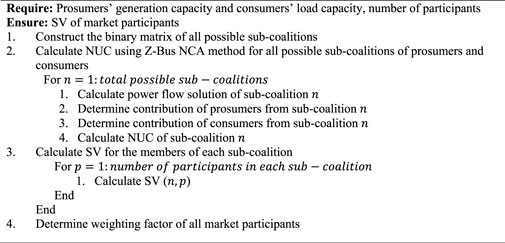
Furthermore, to address the challenge of the intensive calculation of SV, this work compromises with the axioms of SV, which are explained in Section 3.2. In the proposed method, there are several steps to calculate SV: creating sub-coalitions, forming predetermined possible sub-coalitions, and calculating the SV of the grand coalition. Sub-coalitions are small groups containing few prosumers and consumers that are treated separately. By disintegrating the grand coalition into smaller groups, the effort required to calculate the marginal contribution of all possible coalitions would also be reduced. This action is supported by the fact that SV has a proportion of additivity. To form sub-coalitions, all possible sub-coalitions are initially determined based on 2^n binary possible combinations. To maintain convenience in the SV calculation, the members of each sub-coalition will be limited. After all members of all sub-coalitions have their SV determined, the weighting factor of a grand coalition is calculated using the following formula:
where
Algorithm 1. SV calculation
Furthermore, the same method was applied to improve the computation process to perform the market-clearing process by aggregating prosumers and consumers. In this case, smaller groups were determined through a clustering process. The K-means clustering method selects the members of each group of prosumers or consumers based on the trading price. By combining participants with similar trading profiles, the market-clearing process is streamlined, such that the trading price is uniform and trading capacity is defined as the total trading capacity of all members of the cluster.Thus, the objective function of the market-clearing process is to maximize the profit of all clusters. In addition, to ensure that the optimal coalitions are fairly determined, a weighted factor is involved in the objective function. The utilization of weighting factor emphasizes the contribution of each cluster with respect to the network constraints and social welfare maximization. In addition, the well-determined weighting factor may help the optimization process of a large-scale system. Therefore, the objective function is calculated as follows:
where

FIGURE 2. Flowchart of modified operator-oriented P2P model.
4 Case Study: Community-Based Peer-to-Peer Energy Trading
This study aims to improve the performance of the market mechanism based on the concept of community-based P2P energy trading to accommodate the growing number of participants. Hence, this section presents comparisons between the existing community-based P2P energy trading through operator-oriented model approach and the proposed approach. To verify the results, three network configurations with varied sizes and numbers of participants were used. All numerical experiments were performed on an Intel i7-10700 CPU with 16 cores and 16 GB of memory.
Three types of consumers: industrial, commercial, and residential, four types of prosumers: industrial, commercial, residential, and stand-alone PV were implemented for each network configuration. Every participant had different features, such as location, generation and/or consumption capacity, and trading price. Regarding location, prosumers and consumers were located randomly in every network configuration, which will be explained in the following subsections. For the consumption capacity, Figure 3A shows the normalized load patterns during the day. In addition, the South Korean trading case was chosen for an actual case simulation. The actual time-varying PV generation data for 22 May 2020, were obtained from PVWatts (National Renewable Energy Laboratory, 2021). The normalized generation profile is shown in Figure 3B.
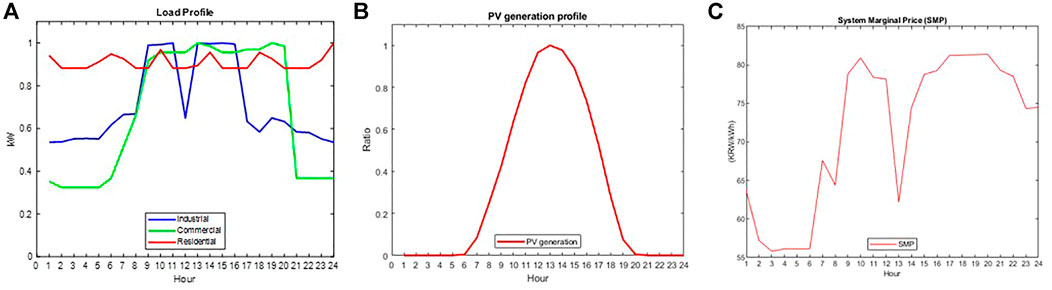
FIGURE 3. (A) Load profiles of P2P participants in a day; (B) Generation profile of various prosumer categories in a day; (C) SMP pattern in a day.
Furthermore, operator-oriented P2P energy trading was simulated based on the South Korean case. Thus, residential consumers’ bid price was calculated using block rate pricing; and commercial and industrial consumers used the TOU price for their electricity tariffs obtained from the Korea Electric Power Corporation, as shown in Table 1 (Korea Electricity Company, 2022).

TABLE 1. Electricity tariff Structure.
In addition, the other type of customer, such stand-alone PV, is compensated by SMP dynamic price when they supply electricity to the grid, which was obtained from Korea Power Exchange and is presented in Figure 3C (KPX, 2018). To determine the total network usage cost, the network cost was determined as volumetric cost, 3.13 KRW/kWh (KEPCO, 2019).
Furthermore, to demonstrate the comparative analysis of the original and proposed methods, three test problems were applied. The first case uses an IEEE distribution network with 18 buses for community-based P2P energy trading (Grady et al., 1992). The second simulates community-based P2P energy trading with a larger market by using the IEEE 69 buses distribution network, as in (Das, 2008). The third proposes the development of community-based P2P energy trading in a distribution system with 141 buses with the network configuration (Khodr et al., 2008). All simulations were performed with an equal number of prosumers and consumers.
4.1 Case 1: 18 Bus
The IEEE 18 bus was chosen to evaluate the performance of both the original and proposed community-based P2P energy trading approaches in a relatively smaller system. As shown in Figure 4, there are eight prosumers in total, and for simplicity, the load location is not presented. With fewer participants, the operator can easily converge into the optimal trading results using both mechanisms. A comparison of the original and proposed methods in terms of the allocated trading capacity is shown in Figure 5. According to the graph, the proposed method allocates a higher matched capacity in total than the original method. In this case, more customers could participate in P2P energy trading using the proposed mechanism.
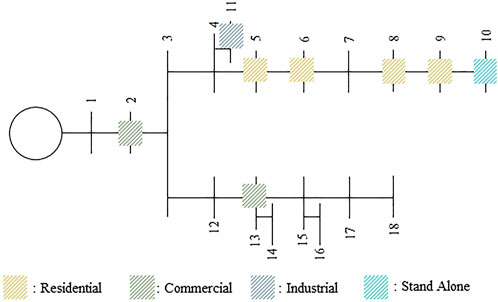
FIGURE 4. Configuration of 18-bus distribution system with prosumer.
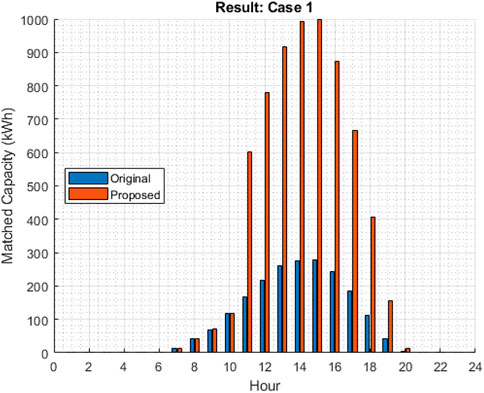
FIGURE 5. Matched capacity results comparison from Case 1.
Additionally, the proposed method allocates higher profits to customers as shown in Table 2. With the higher profit offered by the proposed method, there is a higher chance of customers participating in community-based P2P energy trading. However, it is also important to evaluate fairness in terms of profit allocation between prosumers and consumers. Regarding this, the correlation coefficient evaluates the profit distribution with respect to two variables: profit of prosumers and profit of consumers. Figure 6 shows the correlation matrix of profit incurred by consumers and prosumers for both the original and proposed methods.
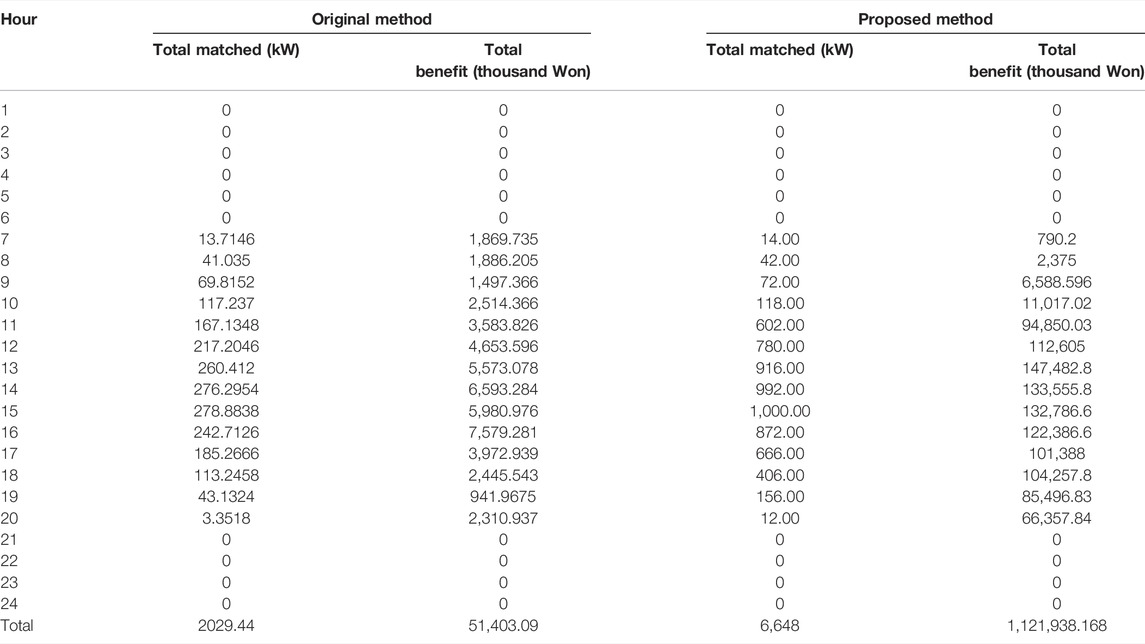
TABLE 2. Comparison of results of original and proposed methods: Case 1.

FIGURE 6. Correlation coefficient of the (A) original method and (B) proposed method in 18 buses scenario.
The original method has a correlation coefficient of allocated profits between prosumers and consumers, with a value of 0.03 (Figure 6A). According to the figure, the original method results low positive correlation and illustrate the relationship of profit allocated between prosumers and consumers with positive linear line. It means that profit of prosumers moves lower with respect to the profit of consumers, which moves relatively higher. This illustrated relationship represents the fair profit distribution between prosumers and consumers.
Compared to the original method, the proposed method yielded a higher correlation with a value of −0.13 (Figure 6B). This value means that the relationship between profit allocated towards prosumers and consumers can be represented as a negative linear line, which is steeper line compared to the original method result. The higher correlation coefficient value means the proposed method allocates more profit towards consumers, which indicates less fair towards prosumers. Furthermore, the proposed bi-layer method shows faster computational process with total computation time requires 0.93 and 11.91 s, while the original single-layer method requires 3.89 and 44.32 s for 1 hour and a day transaction simulation, respectively.
4.2 Case 2: 69 Bus
In this case study, a larger system was used to compare the performances of the original and proposed methods. Figure 7 shows the distributions of various types of prosumers in the 69 buses. In the larger system, the proposed method found converged optimal trading results much faster than the original method. In addition, the proposed method determined a higher capacity between participants than the original method, as shown in Figure 8.
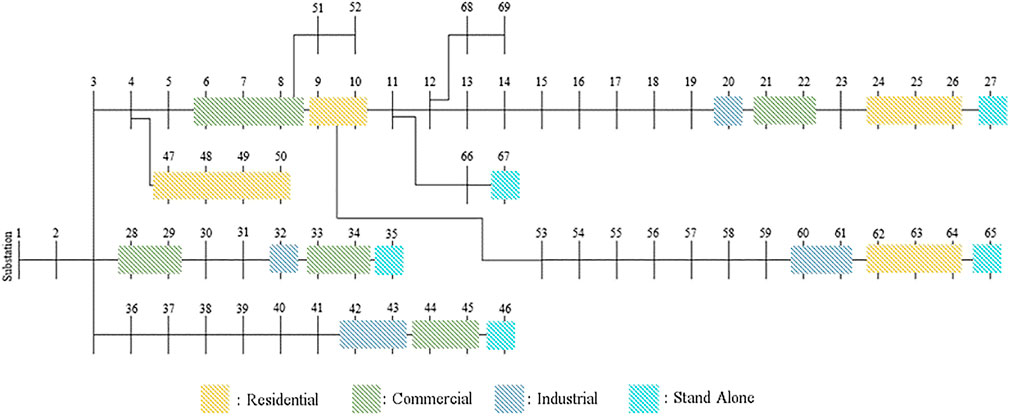
FIGURE 7. Configuration of 69-bus distribution system with prosumer.
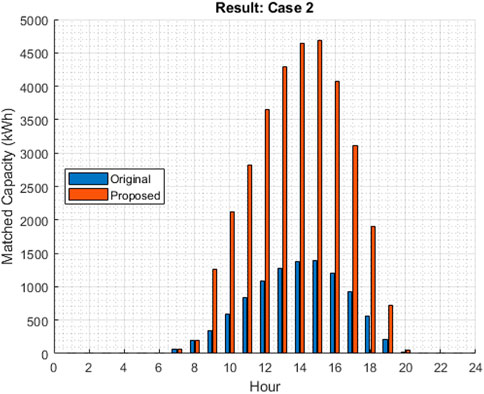
FIGURE 8. Matched capacity between original and proposed method in 69-bus network.
In correlation with the matching capacity results, the profit allocated using the proposed method was higher. A comparison of the original and proposed methods in terms of profit allocation is presented in Table 3.
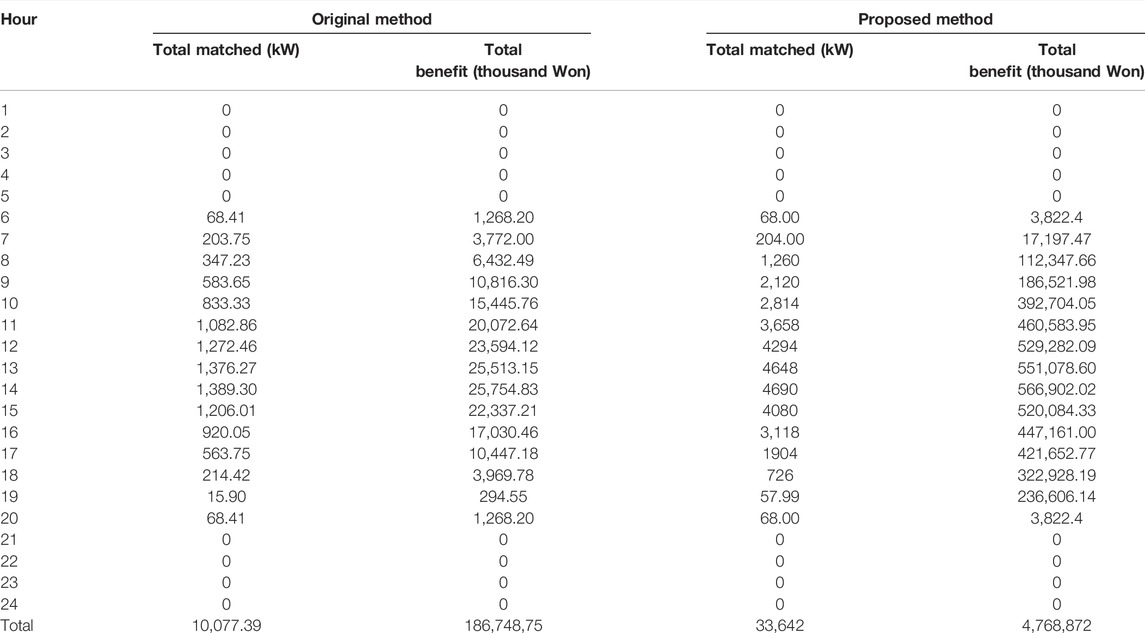
TABLE 3. Comparison of results of original and proposed methods: Case 2.
The proposed method allocated higher profits than the original method because of the different behaviors in allocating NUC to the participants. As shown in Figure 9A, the original method uses the Z-bus NUC method after the matching algorithm process and allocate more NUC. This is because the matched prosumer and consumer may be allocated to a distant location because the NUC allocation was not considered directly during the optimization process.
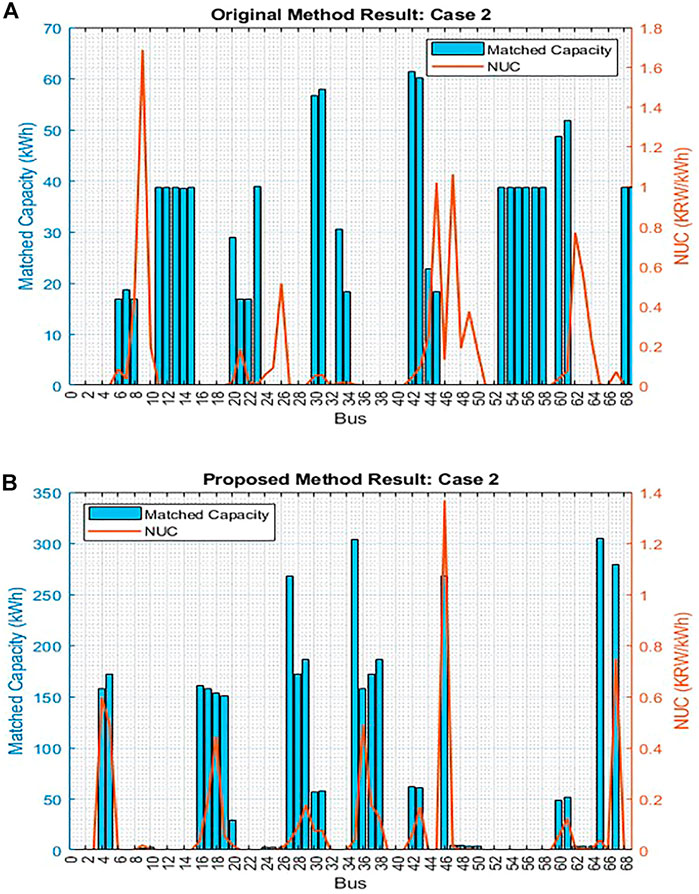
FIGURE 9. Matched capacity of NUC allocation using the (A) original method and (B) proposed method.
However, the proposed method allowed the NUC to be allocated by the Z-bus NCA method at a relatively lower price, thus increasing the profit. As shown in Figure 9B, even the NUC results can effectively modulate the optimization result by allocating a higher matched capacity to the lower NUC between buses 46 and 67.
Furthermore, the proposed method maintained the fair profit distribution among prosumers and consumers, that results the correlation coefficient maintained at −0.16 (Figure 10B). Meanwhile, the original method has a correlation coefficient with the value of −0.23 when applied in 69-bus scenario compared to the 18-bus distribution network. This higher negative value shows the profit is highly distributed towards consumers compared to the prosumers. In addition, the proposed bi-layer method requires 11.94 and 82.93 s for a single hour and a day transaction simulation, respectively. Meanwhile, the original single-layer method requires approximately no less than 50 min to simulate 69-bus scenario for a single-hour simulation.
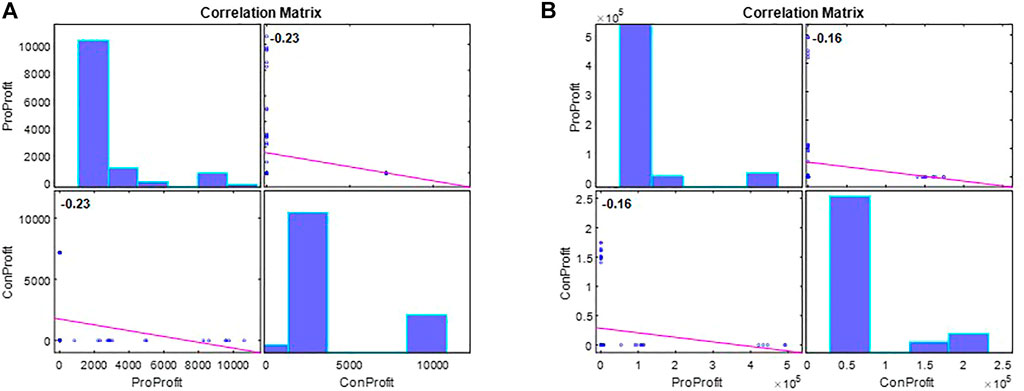
FIGURE 10. Correlation coefficient of the (A) original method and (B) proposed method in 69 buses scenario.
4.3 Case 3: 141 Buses
In the third case, community-based P2P energy trading was applied to a distribution network with 141 buses. Figure 11 shows the locations of the various types of prosumers. Within a large system, there are more market participants, and thus, higher network usage costs. This case aims to demonstrate the ability of the proposed method to determine the converged optimum method. Using the same computer specifications, the original method yielded no result owing to specification incompatibility. However, using the proposed method, optimal results were obtained, although the process was slower than the previous two cases, which requires 28.10 s for an hour and 408.034 s for a day trading simulation. The matching results of the proposed method are shown in Figure 12A.
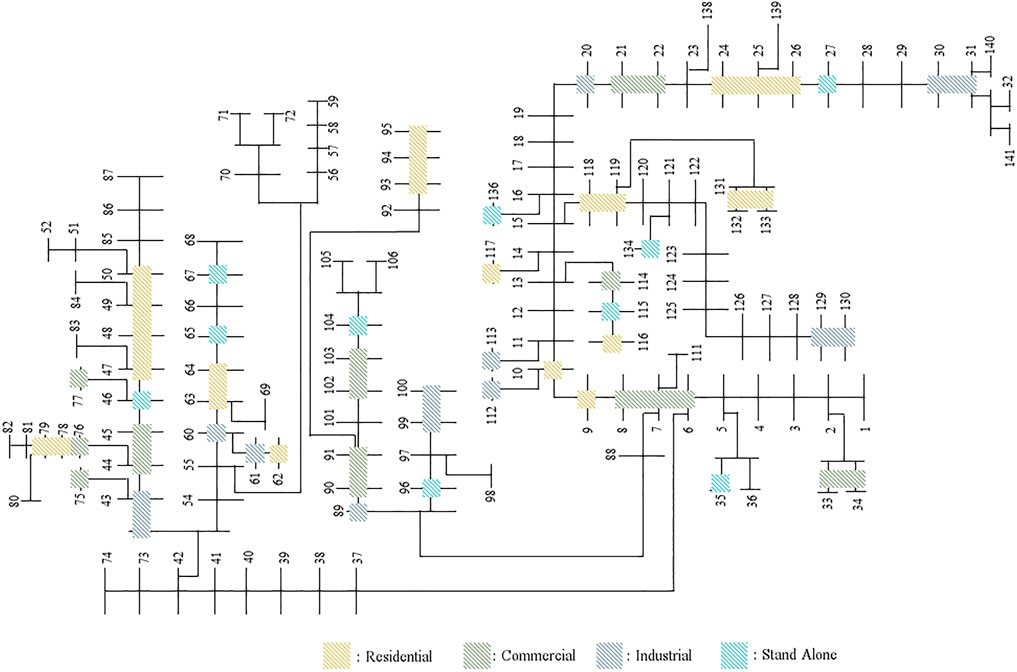
FIGURE 11. Configuration of 141-bus distribution system with prosumers.
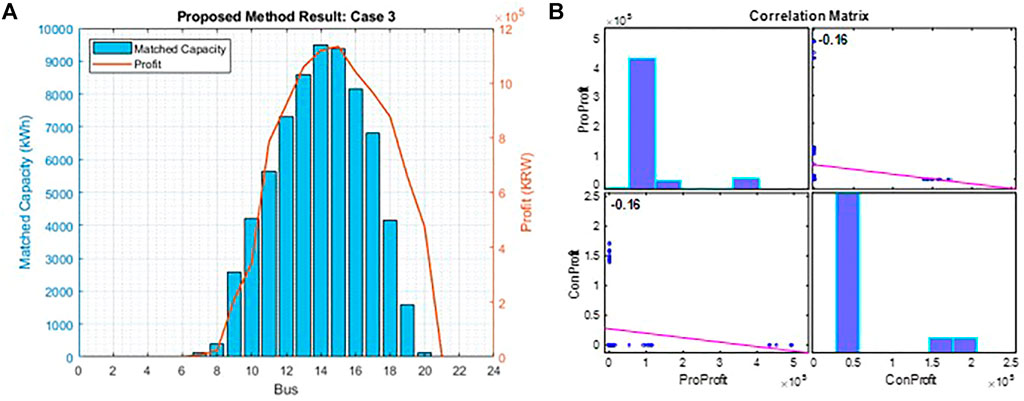
FIGURE 12. (A) Matched capacity results and (B) correlation coefficient of the proposed method for Case 3.
The proposed method maintained the fairness level, as indicated by the correlation coefficient value. Figure 12B shows that the correlation coefficient resulting from the comparison between the profits of prosumers and consumers was maintained at −0.16. In this case, the negative linear line is used to represent the relationship between profit of prosumers and profit of consumers, which can be interpreted as relatively higher profit distribution towards consumers. This condition demonstrates that the proposed method has a stable profit allocation, regardless of market size.
5 Conclusion
To compete with the massive integration of renewable sources into distribution systems, community-based P2P energy trading should find a way to accommodate more participants by maintaining profitable transactions. Among P2P models, operator-oriented P2P energy trading can accommodate various types of participants by providing multiple market-clearing prices for each transaction. However, with the current market mechanism, there is a risk of unbalanced competition owing to the growing number of participants. To overcome this issue, in this study, a modification of the market mechanism was proposed by applying the Z-bus NCA method and SV to ensure more balanced competition among peers, thus providing more profitable transactions for a larger market. Using three different scenarios, it was determined that the proposed method had superior results than the original method in terms of efficient computation process, total matched capacity, total benefit of all participants, and fairness level between different market sizes. Therefore, the proposed method is suitable for the application of P2P energy trading in a distribution system to increase the number of participants.
Data Availability Statement
The datasets presented in this study can be found in online repositories. The names of the repository/repositories and accession number(s) can be found in the article/Supplementary Material.
Author Contributions
NN: Conceptualization, Methodology, Software, Validation, Formal analysis, Investigation, Writing—Original Draft, Writing—Review and Editing, Visualization; YC: Methodology, Software, Formal analysis, Resources, Data Curation, Visualization SL: Validation, Formal analysis, Resources, Data Curation, Visualization; JJ: Conceptualization, Investigation, Writing—Original Draft, Writing—Review and Editing, Supervision, Project administration, Funding acquisition
Funding
This work was supported by the Korea Institute of Energy Technology Evaluation and Planning (KETEP) and the Ministry of Trade, Industry & Energy (MOTIE) of the Republic of Korea No. (20191210301820). This work was supported by “Human resources program in energy technology of the Korea institute of energy technology evaluation and planning (KETEP), granted financial resource from the Ministry of Trade, Industry & Energy, Republic of Korea No. (20194030202370).
Conflict of Interest
The authors declare that the research was conducted in the absence of any commercial or financial relationships that could be construed as a potential conflict of interest.
Publisher’s Note
All claims expressed in this article are solely those of the authors and do not necessarily represent those of their affiliated organizations, or those of the publisher, the editors and the reviewers. Any product that may be evaluated in this article, or claim that may be made by its manufacturer, is not guaranteed or endorsed by the publisher.
References
Acuña, L. G., Ríos, D. R., Arboleda, C. P., and Ponzón, E. G. (2018). Cooperation Model in the Electricity Energy Market Using Bi-level Optimization and Shapley Value. Operations Res. Perspect. 5, 161–168. doi:10.1016/j.orp.2018.07.003
Algaba, E., Fragnelli, V., and Sánchez-Soriano, J. (2019). Handbook of the Shapley Value. Florida: CRC Press.
Azim, M. I., Tushar, W., and Saha, T. K. (2020). Investigating the Impact of P2P Trading on Power Losses in Grid-Connected Networks with Prosumers. Appl. Energy 263, 114687. doi:10.1016/j.apenergy.2020.114687
Azuatalam, D., Chapman, A. C., and Verbič, G. (2019). Shapley Value Analysis of Distribution Network Cost-Causality Pricing. IEEE Milan PowerTech, 1–6. doi:10.1109/PTC.2019.8810968
Conejo, A. J., Contreras, J., Lima, D. A., and Padilha-Feltrin, A. (2007). Z-Bus Transmission Network Cost Allocation. IEEE Trans. Power Syst. 22 (1), 342–349. doi:10.1109/TPWRS.2006.889138
Conejo, A. J., Galiana, F. D., and Kockar, I. (2001). Z-Bus Loss Allocation. IEEE Trans. Power Syst. 16 (1), 105–110. doi:10.1109/59.910787
Das, D. (2008). Optimal Placement of Capacitors in Radial Distribution System Using a Fuzzy-GA Method. Int. J. Electr. Power Energy Syst. 30 (67), 361–367. doi:10.1016/j.ijepes.2007.08.004
Delberis, A. L., Antonio, P., and Javier, C. (2009). An Overview on Network Cost Allocation Methods. Electr. Power Syst. Res. 79 (5), 750–758. doi:10.1016/j.epsr.2008.10.005
Fränti, P., and Sieranoja, S. (2019). How Much Can K-Means Be Improved by Using Better Initialization and Repeats? Pattern Recognit. 93, 95–112. doi:10.1016/j.patcog.2019.04.014
Grady, W. M., Samotyj, M. J., and Noyola, A. H. (1992). The Application of Network Objective Functions for Actively Minimizing the Impact of Voltage Harmonics in Power Systems. IEEE Trans. Power Deliv. 7 (3), 1379–1386. doi:10.1109/61.141855
Heo, K., Kong, J., Oh, S., and Jung, J. (2021). Development of Operator-Oriented Peer-To-Peer Energy Trading Model for Integration into the Existing Distribution System. Int. J. Electr. Power & Energy Syst. 125, 106488. doi:10.1016/j.ijepes.2020.106488
International Energy Agency (2020). Renewables 2020: Analysis and Forecast to 2025. Available at: https://www.iea.org/reports/renewables-2020/solar-pv (Accessed March 4, 2022).
Kanungo, T., Mount, D. M., Netanyahu, N. S., Piatko, C. D., Silverman, R., and Wu, A. Y. (2002). An Efficient K-Means Clustering Algorithm: Analysis and Implementation. IEEE Trans. Pattern Anal. Mach. Intell. 24 (7), 881–892. doi:10.1109/TPAMI.2002.1017616
KEPCO (2019). Regulations on the Use of Electrical Equipment Exclusively for Transmission and Distribution. Naju: KEPCO.
Khodr, H. M., Olsina, F. G., Jesus, P. M. D. O.-D., and Yusta, J. M. (2008). Maximum Savings Approach for Location and Sizing of Capacitors in Distribution Systems. Electr. Power Syst. Res. 78 (7), 1192–1203. doi:10.1016/j.epsr.2007.10.002
Korea Electricity Company (KEPCO) (2022). International Electricity Tariff. Available at: http://cyber.kepco.co.kr/ckepco/front/jsp/CY/H/C/CYHCHP00301.jsp (Accessed March 4, 2022).
Li, X., Li, C., Liu, X., Chen, G., and Dong, Z. Y. (2022). Two-stage Community Energy Trading under End-Edge-Cloud Orchestration. IEEE Internet Things J., 1. doi:10.1109/JIOT.2022.3140336
Li, Y., and Wu, H. (2012). A Clustering Method Based on K-Means Algorithm. Phys. Procedia 25, 1104–1109. doi:10.1016/j.phpro.2012.03.206
Maleki, S., Rahwan, T., Ghosh, S., Malibari, A., Alghazzawi, D., Rogers, A., et al. (2020). The Shapley Value for a Fair Division of Group Discounts for Coordinating Cooling Loads. PLoS ONE 15 (1), e0227049. doi:10.1371/journal.pone.0227049
National Renewable Energy Laboratory (2021). PV Watts Calculator. Available at: https://pvwatts.nrel.gov/pvwatts.php (Accessed October 28, 2021).
Nojavan, S., and Zare, K. (2020). Electricity Markets: New Players and Pricing Uncertainties. New York: Springer International Publishing.
Sweta, M., Maeve, D., Subhasis, T., Barry, H., and John, B. (2022). A Priority-Based Approach for Peer-To-Peer Energy Trading Using Cooperative Game Theory in Local Energy Community. Int. J. Electr. Power & Energy Syst. 137, 107865. doi:10.1016/j.ijepes.2021.107865
Veeramsetty, V. (2021). Shapley Value Cooperative Game Theory-Based Locational Marginal Price Computation for Loss and Emission Reduction. Prot. Control Mod. Power Syst. 6, 33. doi:10.1186/s41601-021-00211-0
Keywords: community-based, peer-to-peer energy trading, market mechanism, network cost allocation, fair profit distribution
Citation: Noorfatima N, Choi Y, Lee S and Jung J (2022) Development of Community-Based Peer-to-Peer Energy Trading Mechanism Using Z-Bus Network Cost Allocation. Front. Energy Res. 10:920885. doi: 10.3389/fenrg.2022.920885
Received: 15 April 2022; Accepted: 20 June 2022;
Published: 11 July 2022.
Edited by:
Chaojie Li, University of New South Wales, AustraliaReviewed by:
Mao Tan, Xiangtan University, ChinaJueyou Li, Chongqing Normal University, China
Xiangyu Li, University of New South Wales, Australia
Copyright © 2022 Noorfatima, Choi, Lee and Jung. This is an open-access article distributed under the terms of the Creative Commons Attribution License (CC BY). The use, distribution or reproduction in other forums is permitted, provided the original author(s) and the copyright owner(s) are credited and that the original publication in this journal is cited, in accordance with accepted academic practice. No use, distribution or reproduction is permitted which does not comply with these terms.
*Correspondence: Jaesung Jung, amp1bmdAYWpvdS5hYy5rcg==