 Miqueas Diaz-Maya
 Marco Ulloa
 Rodolfo Silva
- 1Instituto Politecnico Nacional, CICATA-Altamira, Altamira, Mexico
- 2Instituto de Ingenieria, Universidad Nacional Autónoma de México, Mexico City, Mexico
The wave power in the Gulf of Mexico was analyzed, using 42 years (1979–2020) of simulated data, with ERA-5 winds to force the WAVEWATCH III wave model. The model was successfully validated with three NDBC buoys, 42,055, 42,001 and 42,002. Comparison of significant wave heights obtained from the Jason-2, Cryosat-2, and Saral satellites showed good mean correlation coefficients and root mean squares. The spatial distribution of wave power was studied, as well as its seasonal variability. The region studied has moderate availability of wave power with marked seasonality. A multi-criteria MCA approach, including both sea state and wave energy converters (WECs), was then applied. Nine virtual sites were selected for the study and the AAHPA device gave best results in 7 virtual sites and the Wavestar device in the remaining two. The technology of these two devices, a system of oscillating buoys, is the most viable technology for the Gulf of Mexico.
Introduction
The availability of energy is an important factor in the development of any country’s economy and in the welfare of its people. However, the unsustainable use of energy resources impacts the environment, human health, and economic progress (Pérez-Denicia et al., 2017). In 2020 in Mexico, most energy was generated from oil 59.8%, followed by natural gas at 23.2%, renewable energy 10.5%, coal 3.6%, and nuclear 2.0%. Of the renewable sources geothermic energy, solar and wind accounted for 3.4%, hydroelectric 1.3% and biomass 5.7% (SENER, 2020). As the demand for electricity in Mexico continues to grow, our commitment to try to decrease the amount of energy produced from fossil fuels is becoming vital, and therefore all the available clean energy resources must be considered. Marine energy from waves, currents, tides, thermal gradient and salinity gradient must be assessed. Among these, wave energy has greatest potential (Soerensen and Weinstein, 2008), partly because it is more predictable than other renewables, such as wind or solar (Kamranzad and Hadadpour, 2020).
Global assessments of the annual mean wave power estimate maximum values in the Gulf of Mexico (GoM) to be 5–10 kW/m (Cornett, 2008; Mørk et al., 2010; Gunn and Stock-Williams, 2012; Rusu and Rusu, 2021). In water depths of over 40 m, Guillou and Chapalain (Guillou and Chapalain, 2020) found an annual mean power of less than 8 kW/m in the GoM, which coincides with that of Appendini et al. (Appendini et al., 2015). Off the Mexican coast in the GoM, Félix et al. (Felix et al., 2018) found that the multi annual wave energy potential excluding storms, is 18.0 MW, with 24.2 MW, including storms (Hs = 4 m). More specifically, Hernández-Fontes et al. (Hernández-Fontes et al., 2019) stated that the wave power availability for a wave power threshold of over 5 kW/m is available 60–70% of the time off the states of Quintana Roo and Tamaulipas. It should be pointed out that numerical results of Hernández-Fontes et al. (Hernández-Fontes et al., 2019) were not validated with wave measurements.
The GoM has significant urban and industrial development, and thus a substantial base of electricity consumers, as well as almost 1900 oil platforms that require an electricity supply (Bureau of Safety and Environmental Enforcement, 2020). However, the GoM is not considered to offer steady wave power for energy harnessing, due to hurricane risk and the variability of the potential resource (annual index exceeding 1.0) (Cornett, 2008; Guillou and Chapalain, 2020). Guiberteau et al. (Guiberteau et al., 2015), however, suggested that the Power Buoy and Pelamis wave energy converters (WECs), are capable of adapting to the variability and to capture wave energy to provide some electricity to the oil platforms in the GoM. Haces-Fernández et al. (Haces-Fernandez et al., 2018) also suggests that the combination of Pelamis and wind power is a good option.
In the present quest for sustainable energy resources, the adaptation of WEC technologies for low-medium wave power regions has become a topic of research. If these regions cannot supply electricity to large centers of consumption, then perhaps the wave energy harvested can meet local needs. This study explores various WEC technologies for harnessing wave energy in the GoM, at sites associated with oil exploration and exploitation. A multi-criteria analysis was used to select the most viable WEC technology. The WAVEWATCH III wave model (WW3) was used, validated with National Buoy Date Center (NDBC) data and satellite altimetry data. The results obtained for 1979–2020 (42 years) allowed us to study interannual variations in wave parameters in the deep waters of the GoM. A numerical characterization of the wave power was carried out, and site selection and WECs were evaluated.
Materials and methods Section of this paper describes the implementation and methodology of the model. In Results and discussion Section the model validation, the wave power analysis and the analysis of the different WECs using the multi-criteria approach (MCA, also known as MCA factor) are shown.
Materials and methods
This section is divided into three stages: the implementation and validation of the WW3 model for 1979–2020 is described, a brief description of the wave power in the GoM is given and, finally, the analysis of WECs at various sites is presented, using the MCA.
Study area
The GoM is a semi-enclosed sea (Figure 1) with moderate waves, reaching significant wave heights of about 1 m (Ojeda et al., 2017). The extreme waves generated in the GoM are primarily due to frontal systems, tropical cyclones and winds with southern and southeastern components known as “Suradas”. The cold fronts in the area can lead to abrupt temperature changes (up to 20°C in 24 h) and rainfall of 200
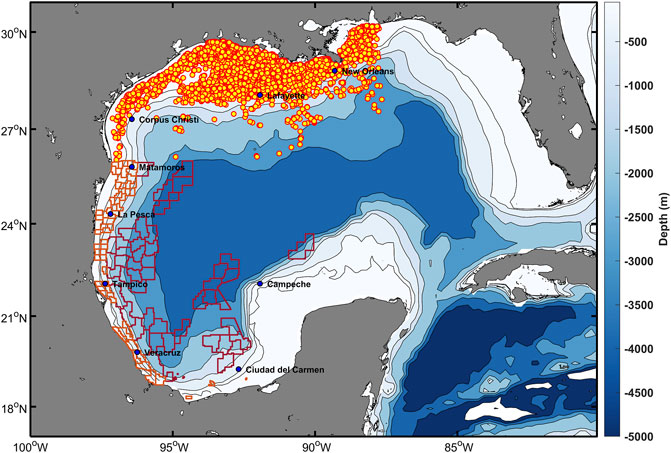
FIGURE 1. Study area, showing US offshore oil platforms (yellow dots) and oil exploitation areas in the GoM (Comisión Nacional de Hidrocarburos, CNH) in both shallow and deep water (orange and red respectively), and virtual sites (blue dots).
Numerical model
The analysis undertaken here relies on hindcast data from the WW3 version 6.07 [WAVEWATCH III Development Group (WW3DG, 2019)], a third-generation wave model forced with reanalysis winds from 1979 to 2020. This model solves the random phase spectral action density balance equation for wavenumber-direction spectra (Massel, 1996). The output wave parameters of the model are the significant wave height, peak period and peak directions recorded with a time resolution of one hour.
Model set up
The WW3 model for the GoM is built on a structured mesh with a resolution of 0.1875°. The wave spectrum was discretized in 24 uniformly distributed directions and 29 frequencies distributed in a logarithmic mesh covering the interval of 0.06623–0.9551 Hz, with a frequency increase factor set at 1.1. Bathymetric and obstacle grids have a resolution of 15 arc-seconds from the GEBCO database [GEBCO Compilation Group (GEBCO, 2021)]. Coastline and island data are from the high-resolution GSHHS model database (Wessel and Smith, 1996). The wind forcing is from ERA5 (Copernicus Climate Change Service (C3S), 2017) from the European Center for Mid-Range Climate Forecasting (ECMWF). This dataset, covering the period from1979 to 2020, has temporal and spatial resolutions of one hour and 0.28°, respectively. The source term package ST4 by Ardhuin et al. (Ardhuin et al., 2010) was used to improve the duplication of wave parameters (Kalourazi et al., 2021). The time steps for the global, spatial, intra-spectral propagation and the source term integration are 1800 s, 900 s, 1350 s and 15 s.
Validation
Validation of the WW3 model was carried out by comparing the model predictions against altimetry (Jason-2, Cryosat-2 and Saral satellites) and buoy data from the NOAA Deep Sea National Buoy Date Center (NDBC) (Figure 2). The satellite data are from the Sea State project (Piollé et al., 2020) of the IFREMER-Climate Change Initiative (CCI). The WW3 results were interpolated linearly over spatial and temporal scales based on the positions of satellite trajectory observations for the periods: 01/01/2009–31/12/2017, Jason-2, 01/01/2011–31/12/2017, Cryosat-2, and 01/01/2014–31/12/2018, Saral. The altimeter data is the “along track” type, implying that when there are no altimeter data, there is no data from the model in some time periods. In the case of NDBC buoys, validation was performed according to hourly data for the significant wave height (
where N is the number of available observations, the overbar indicates a mean value,
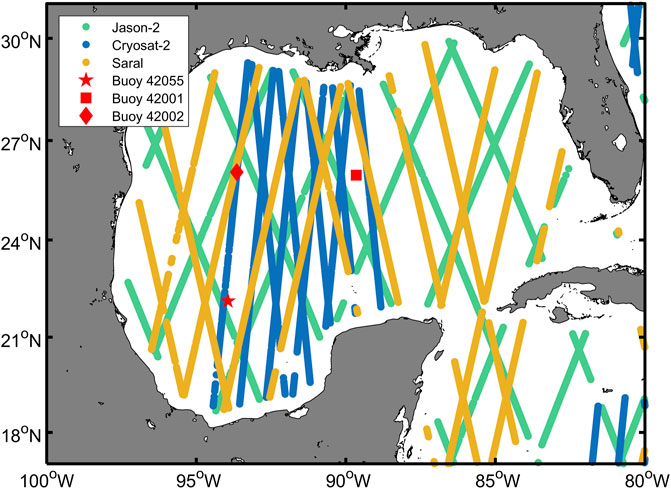
FIGURE 2. Satellite trajectories from 1st to 10th of January 2015 and NDBC buoy positions.
Wave energy resource assessment
Following model validation, a total of 42 years from 1979 to 2020 was simulated. The wave power density (
where
Characteristics of the selected WECs
Seven different WECs were selected for this work: Pelamis, OE Buoy, Oceantec, Langlee, Wavestar, Oyster and AAHPA. These WECs operate using different principles. Table 1 presents the main characteristics of these WECs: power rating, operating principle and power matrix resolution. The manufacturers of the WECs specify these performance characteristics in terms of a power matrix. This gives a representation of the WEC response in terms of average power output, using the two sea state parameters (
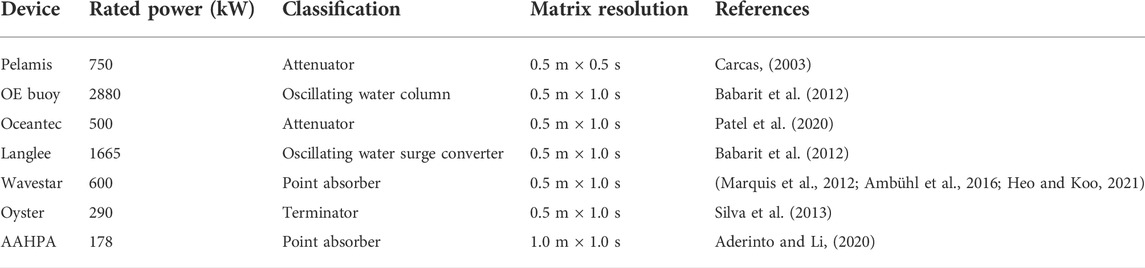
TABLE 1. Main characteristics of the WECs selected.
Pelamis device
The Pelamis is a WEC consisting of a series of semi-submerged cylindrical sections, connected by hinged joints. It resists the wave-induced movement of the joints by means of hydraulic rams that pump oil at high pressure from motors running electric generators (Carcas, 2003). In 2008, 3 Pelamis devices were tested in Agucadoura (Portugal). In 2009–2010 another trial was carried out in the United Kingdom with a second generation device and another was installed in 2012 by Scottish Power. In 2014, the company went into receivership and the intellectual property was transferred to the Scottish government body: Wave Energy Scotland (EMEC, 2022).
OE buoy device
The OE Buoy is an oscillating water column device, developed by Ocean Energy Ltd., Ireland. It has a semi-submerged open chamber below the sea surface with an air pocket held above the water column. The airflow is converted into electrical energy as the column is oscillated by incoming waves that pass the air through a two-way turbine (Babarit et al., 2012). In its early stages, a 1:50 scale model of the device was tested in Ireland, and later, a 1:15 scale model was successfully tested in France, followed by ocean trials. In 2011, a 28-tonne 1:4 scale model was installed in Galway Bay, Ireland, providing energy production data (Lavelle and Kofoed, 2011; Ocean Energy Ireland, 2017).
Oceantec device
The WEC Oceantec is an attenuator device. It extracts energy from the waves in a gyroscopic device, using the relative inertial motion caused by the waves. This motion powers an electrical generator through a series of transformation stages. The gyroscopic device is housed within a structure, or hull, that stays aligned with the wave front, giving a pitch movement. The structure containing the absorber element and the other elements is vessel-shaped and can be scaled in size, to suit the wave conditions at a given site. The mooring system consists of four lines that allow the WEC to cope with the incident wave and maximizes the absorption of directional wave energy (Patel et al., 2020). Tests were carried out in 2008, off the north coast of Spain (Salcedo et al., 2009).
Langlee device
This oscillating wave surge converter extracts kinetic energy from the orbital motion of water particles excited by waves, through a series of hinged flaps located just below the water surface. It has a series of pairs of flaps that are placed symmetrically opposite each other, mounted on a semi-submerged, floating steel frame. At suitable wavelengths, the symmetry helps to minimize the forces acting on the structure and moorings, while the flaps must complement each other to extract the maximum amount of energy (Babarit et al., 2012). The device was developed by Langlee Wave Power, based in Norway. In 2012 they conducted scale model tests at the Plataforma Oceánica de Canarias (PLOCAN) facility (Langlee Wave Power AS, 2013).
Wavestar device
The Wavestar device is a point absorber. It is essentially a group of floats that rise and fall with the movement of the waves. A hydraulic system transfers this movement, converting it into the rotational motion of an electric generator. The Wavestar can be installed on shore, inland, or in shallow waters, or it can be adapted for deep waters, and can work in combination with at least one wind turbine (Marquis et al., 2012). In extreme events that threaten the system, the bridge is raised to a safe height, as are the arms (Drew et al., 2009; Aderinto and Li, 2019). The Wavestar system was developed in Denmark in 2000 and in 2004 a 1:40 scale model was tested in the wave tank at Aalborg University to verify the performance of the concept and document the energy data obtained. In 2005, a 1:10 scale model was constructed for ocean testing at Nissum Bredning, a coastal lagoon in Denmark where the swell size is approximately 1:10, compared to the North Sea. The device was successfully installed in 2006, accumulating 15,000 operational hours and withstanding over 15 storms with no damage to the system (WaveStar, 2019). In 2010, a 1:2 scale model was installed at a depth of 6 m. There were two versions of this 110 kW-capacity device, with different numbers of floats. The power matrix used in this research corresponds to the 20-float version with a nominal power of 600 kW.
OYSTER device
The Oyster is a device of oscillating fins fixed to the bottom. The floating hinged flipper moves back and forth with the movement of the waves, and the two hydraulic pistons pump water at high pressure to a shore-based hydroelectric station that drives an electricity-producing generator (Silva et al., 2013). The Oyster device was developed in Scotland from 2005 by the Aquamarine Power company. The first full-scale device was tested in Orkney, Scotland, and the first Oyster was installed with the help of the European Marine Energy Centre (EMEC) in 2009 (Cameron et al., 2010).
AAHPA device
The AAHPA device was designed for the wave conditions in South Texas (GoM). It consists of a cylindrical buoy that oscillates vertically through a fixed, solid frame during its interaction with the waves. The cylinder is hollow, with an inlet and an outlet that have one-way valves near to the submerged base of the device. The valves open at a certain critical wave period and close when the wave period falls to less than this. This allows resonance at two different wave frequencies. It does not have a specific mechanism for converting mechanical wave energy into electrical energy, and it is known as a self-adjusting WEC because it changes its inertia by ballasting and deballasting with seawater. As yet, this device is only a conceptual design; no tests have been performed yet.
The devices selected were designed for areas of high energy, so it is not possible to harness their full rated power. However, by studying sites with less energy important information can be gleaned for future technological development. For example, the design loads of the WEC is reduced and its probabilities of survival are increased. In addition, installation, commissioning and maintenance are simpler, safer and less costly than at higher power sites. In areas with low power, the annual variation of sea wave energy is generally lower, while the tidal range is low (as in the GoM), facilitating the installation, operation and maintenance of these WECs (Foteinis, 2022).
Multi-criteria approach
The multi-criteria approach (MCA) index was introduced by (Kamranzad and Hadadpour, 2020) and later modified by (Kamranzad et al., 2021). It is used to compare energy extraction using different WECs at specific sites. The calculation of the index involves different variables: the exploitable energy at the site (
The total and exploitable wave energy per unit area (
where t is the total hours per year (8760 h),
Accessibility refers to the percentage of time that marine conditions are favorable for the operation and maintenance of WEC activities offshore. The wave height threshold taken into account is that of Lavidas et al. (Lavidas et al., 2018), ranging from 1.5 to 4 m with increments of 0.5 m. Availability is calculated according to the percentage of time that the wave resource is favorable to WEC operations. As a result of Lavidas et al. (Lavidas et al., 2018), we are considering WECs suitable for high and low resources in terms of a wave height cut-in
The performance of each WEC at the different sites is assessed in relation to energy production (
where,
Energy production of a WEC at a given site is estimated from Eq. 7, which uses the power matrix of a device with the sea state matrix. The values of Table 3 were estimated by multiplying the expected energy production of each interval of the power matrix by the expected number of hours/year of occurrence of that interval. For this purpose, the wave climate data were represented using a sea state matrix with the same resolution (i.e. same size of height and period intervals) as the power matrix of each WEC, to show the different wave conditions at each of the sites. The annual energy production was then calculated by summing the records for each year, and finally, the average annual production was estimated by taking the 42-years average of the dataset. Energy production was calculated on a monthly and an annual basis. The general characteristics of the WECs selected are described in Table 1 and the power matrices of the WECs were obtained from the references consulted. It is important to note that the power matrix used for the AAHPA device is approximate, derived from the results of the work of (Aderinto and Li, 2020).
The variability of the wave resource follows the monthly variability index (MV) provided by (Cornett, 2008).
where
Combination of all the above factors constitutes the multi-criteria factor for the selection of a wave energy harvesting site (Kamranzad et al., 2021),
where annual values of
Results and discussion
Validation
The results obtained from the WW3 model were successfully validated in terms of 10 years daily means of
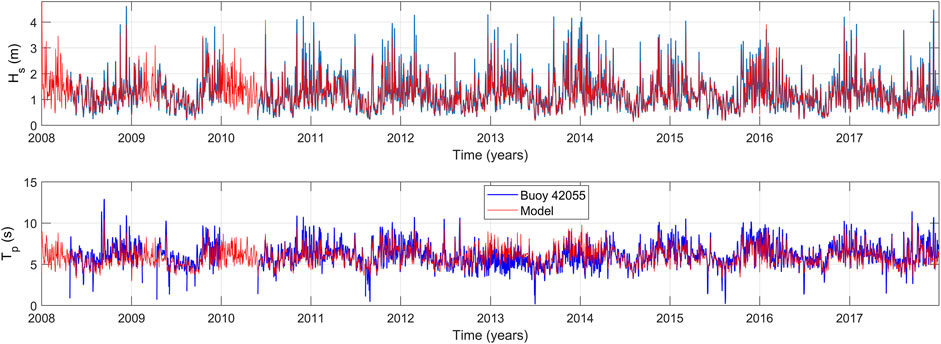
FIGURE 3. Comparison between simulated and observed wave parameters from NDBC buoy 42,055 for 2008–2017.
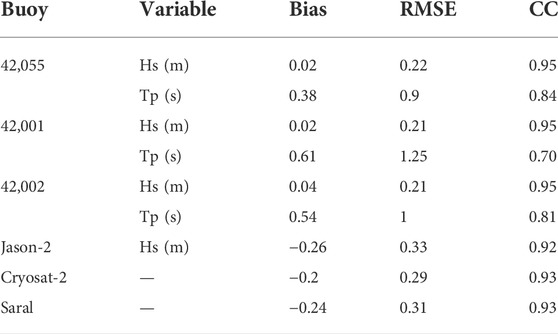
TABLE 2. Validation metrics based on NDBC buoys and satellite data.
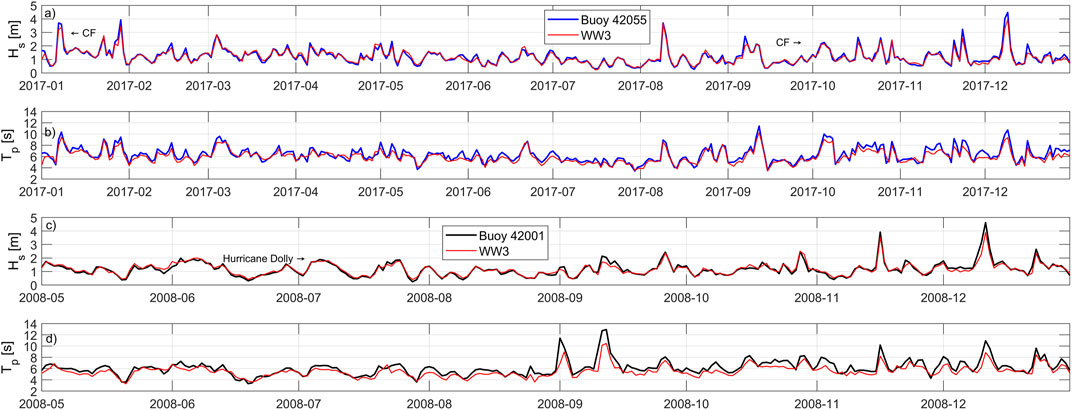
FIGURE 4. Time series of modelled and measured (buoys 42,055 and 42,001) significant wave heights and peak periods.
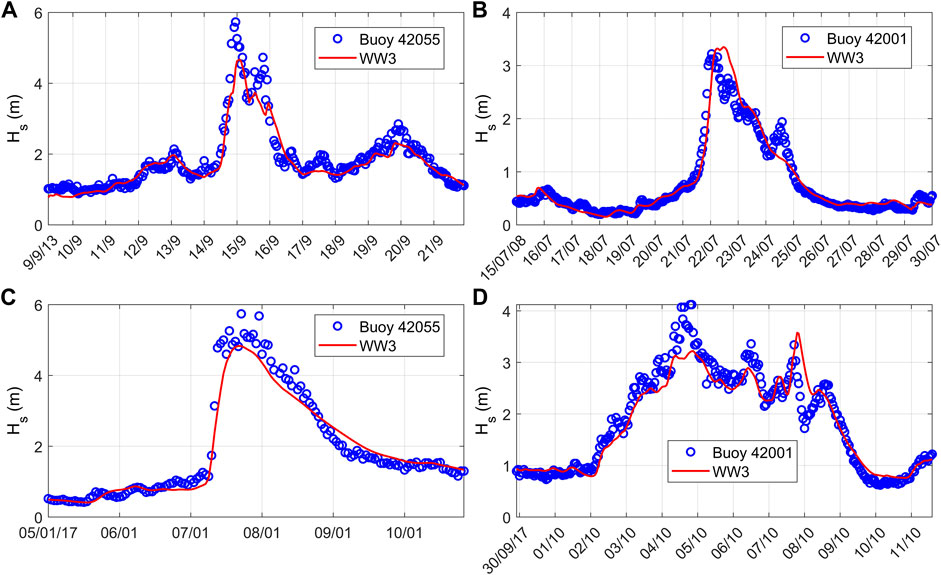
FIGURE 5. Comparison of the modelled significant wave heights and measured time series for selected extreme events: (A) Hurricane Ingrid (September 2013); (B) Hurricane Dolly (July 2008); (C) Cold front, January 2017; and (D) Cold front, October 2017.
Figure 6 shows the comparison of the time series of
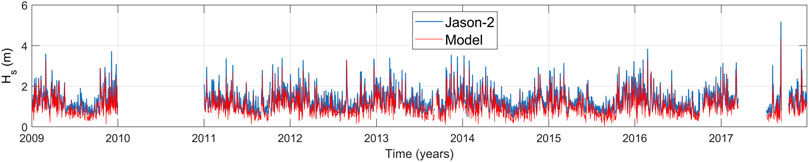
FIGURE 6. Time series of modelled and measured significant wave heights from the Jason-2 satellite.
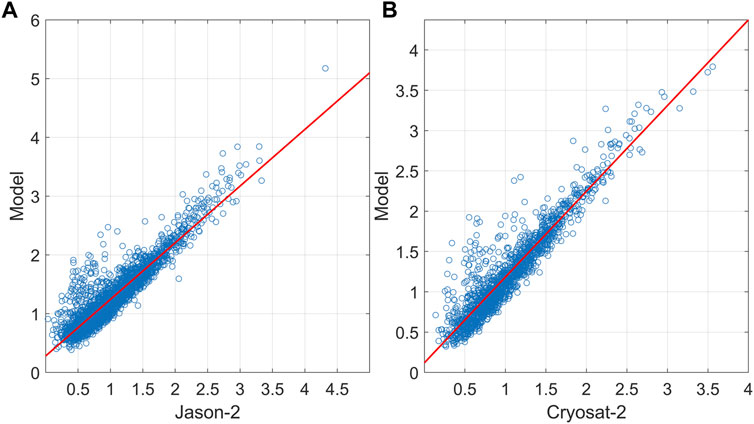
FIGURE 7. Scatter plots of the significant wave heights of modelled and satellite data: (A) Jason-2; (B) Cryosat-2.
Wave power spatial distribution and wave climate characteristics
In this section the results of the theoretical wave power in the GoM, that is, the spatial distribution of the mean wave power, the percentiles of the wave power and the seasonality of the mean wave power are described.
In general, mean wave power in the GoM is low. It is seen in Figure 8 that the highest mean wave power is off the west coast of the GoM (>5 kW/m). Data from the virtual buoys, shown in Figure 1, shows that in deep water the mean wave power is about 2–5 kW/m, while closer to the coast, the mean wave power is less than 2 kW/m.
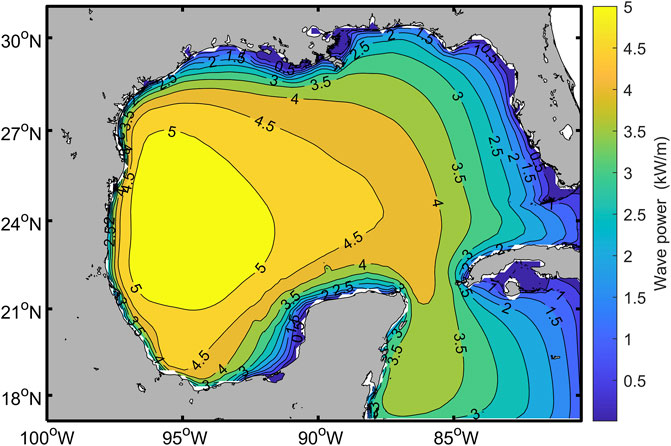
FIGURE 8. Spatial distribution of mean wave power.
Figure 9 depicts the 25th, 50th, 75th and 99th percentiles of wave power for the 42-years interval. The maximum values for all percentiles are in the northwest of the GoM, at approximately the same position as the wave power mean maximums. The latter coincides with the results of Haces-Fernández et al. (Haces-Fernandez et al., 2018) and Félix et al. (Felix et al., 2018) who identified the west of the GoM as promising for the harnessing of wave energy for electricity. Nevertheless, with the exception of the 99th percentile, maximum values are found on the coast of Veracruz. The 50th percentile, the median, does not exceed 3 kW/m in the entire GoM. For the 75th percentile, the same distribution occurs with maximum values in the west of the GoM. However, maximum values can reach 6 kW/m. Regarding the 99th percentile, the observed values are between 10 and 55 kW/m, with a maximum of 55 kW/m in the southwest of the GoM.
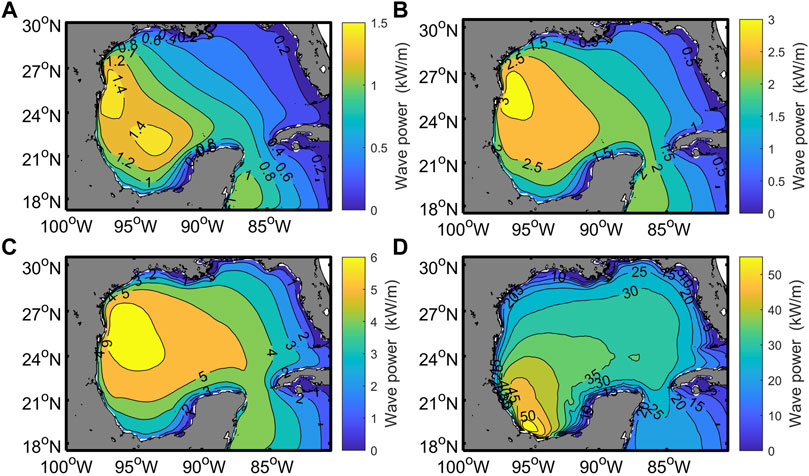
FIGURE 9. Wave power (kW/m) percentile maps: (A) 25th; (B) 50th; (C) 75th; and (D) 99th. Note the scale in the colour bands is different.
The mean wave power for each season of the year was also calculated, based on the 42-year period (Figure 10). The season with the highest wave power is winter, with an average of 6 kW/m and maximum values in excess of 8 kW/m. In autumn and spring, the mean wave power is 4 kW/m with maximum values of 5.5 kW/m. The least energetic season is the summer with a mean of 2 kW/m and minimum values of up to 0.5 kW/m. The findings reported here agree with those of Félix et al. (Felix et al., 2018) and the global trend (Cornett, 2008; Gunn and Stock-Williams, 2012).
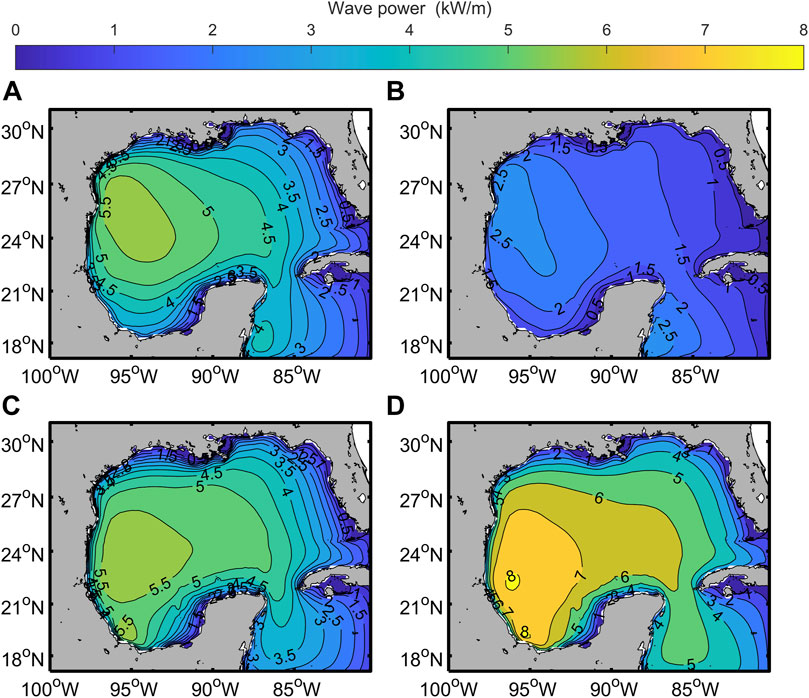
FIGURE 10. Seasonal mean wave power maps: (A) spring; (B) summer; (C) autumn; and (D) winter.
MCA factor
The results of the MCA factor, shown in this section encompass essential aspects for estimating long-term energy potential for possible WEC devices and sites. The MCA factor includes aspects such as total and exploitable wave energy at the site, accessibility, availability, annual energy production, monthly variability, as well as extreme values. The results shown are for 9 sites in the GoM, selected for their proximity to oil activity (Figure 1) where electricity generated from wave energy would make a considerable contribution to the carbon footprint. Nearby locations to these platforms areas were used to aid identification: New Orleans (New), Lafayette (Laf), Corpus Christi (Cor), Matamoros (Mat), La Pesca (Pes), Tampico (Tam), Veracruz (Ver), Ciudad del Carmen (Car) and Campeche (Cam).
The annual exploitable energy (
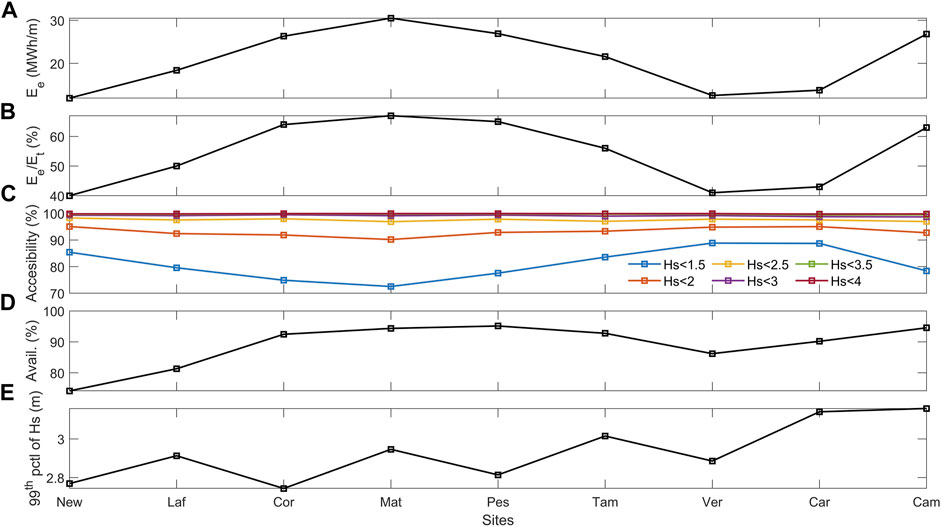
FIGURE 11. (A) Annual Exploitable energy; (B) percentage of the ratio of exploitable energy to total energy; (C) annual accessibility; (D) annual availability; and (E) 99th percentile values of
Another factor considered in the MCA is accessibility, defined as the percentage of time in which it is possible to operate a device at a given site, or perform maintenance operations. This parameter is determined according to
Figure 11D shows the availability values, indicating the percentage of time when the wave resource favors the operation of the WEC devices. Availability is greater than 74% at all sites. The highest and lowest values are at La Pesca and Lafayette, respectively. The values for these sites are high compared to the annual availability value reported of 55.21% in the Gulf of Oman (Kamranzad and Hadadpour, 2020) and various sites in the Indian Ocean (Amrutha and Sanil Kumar, 2022), which range from 50% to about 97%. The
Table 3 shows the annual energy production (
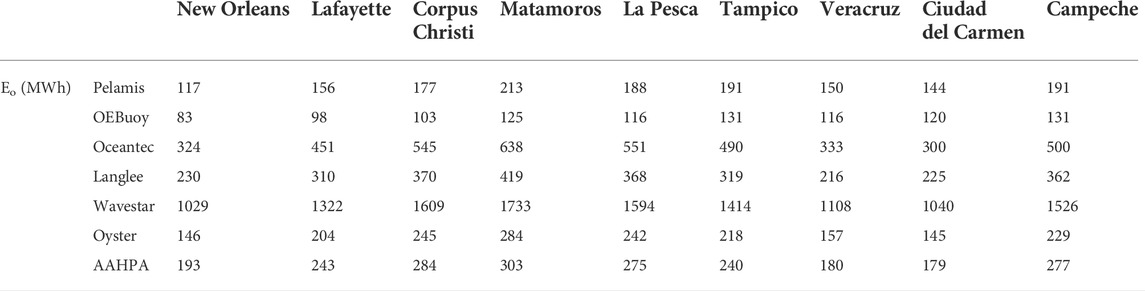
TABLE 3. Annual energy production at each site in the GoM.
In addition to the annual energy production (
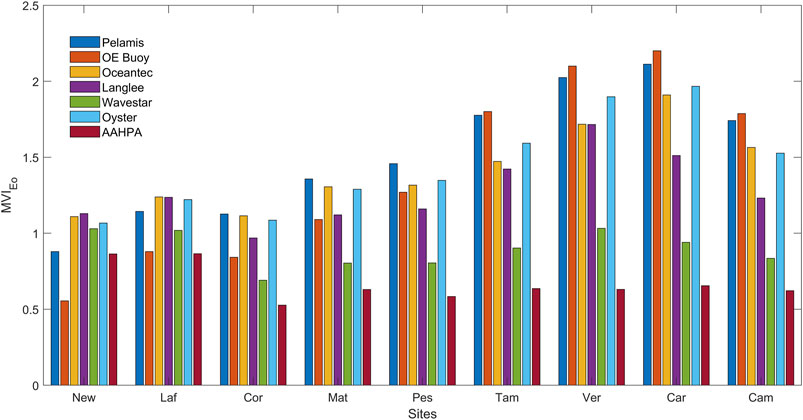
FIGURE 12. Monthly variability of
The MCA factor was calculated for all sites (Figure 13), allowing comparison of the performance of the WECs at each study site. For 7 sites, the AAHPA is the most suitable WEC, followed by the Wavestar at the other two sites. Corpus Christi site and the sites in Tamaulipas have the highest values of the MCA factor.
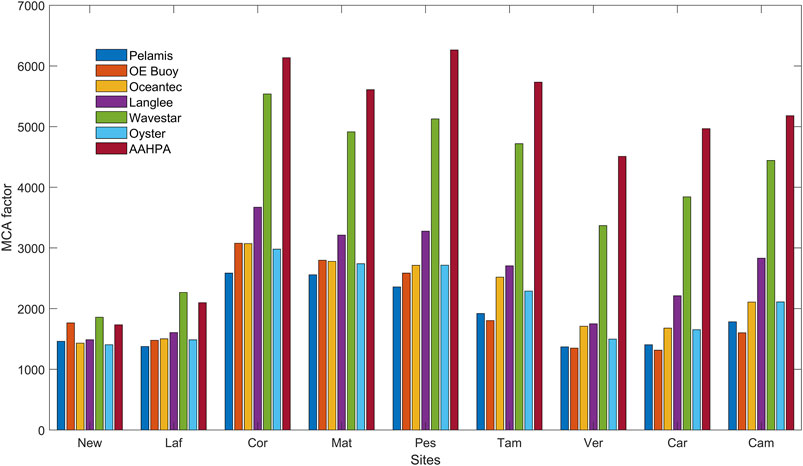
FIGURE 13. Multi-Criteria-Approach factor of different WECs for the 9 sites.
The Wavestar WEC is described as a point absorber (Marquis et al., 2012; Ambühl et al., 2016; Heo and Koo, 2021), oscillating body system or wave activated system (Chen et al., 2018; Curto et al., 2021), or attenuator (Amrutha and Sanil Kumar, 2022). It is essentially a group of floats whose operation does not depend on the direction of the waves, ascending and descending with the upward and downward motion of the waves. This device is small in size, compared to the wavelength, with smaller horizontal dimensions than the vertical. It can float on the sea surface or below the water, relying on the pressure differential (Drew et al., 2009; Aderinto and Li, 2019; Farrok et al., 2020). It is promising as a WEC prototype, capable of changing the inertia of the oscillating body using seawater as ballast and de-ballasting to achieve resonance with two different wave frequencies (Aderinto and Li, 2020).
In areas with a high wave climate, the movements of WECs are limited in storms, to ensure their survival (Stuhlmeier and Xu, 2018); they do not generate electricity. However, in low-energy areas, such as GoM, storm survival is not a major issue (Lavidas, 2019). However, existing types of WECs would only fully function during relatively infrequent high-energy storms and waves (Foteinis et al., 2017), since low-energy waves could not drive them. The reason for this is that the power matrix of the European WECs cannot be used to capacity with the average sea state of the GoM. The range of significant heights and energy periods obtained for the sea state matrix was 0<
The power matrices of the converters evaluated in this research: Pelamis, OE Buoy, Oceantec, Langlee, WaveStar, Oyster and AAHPA, are added as a Supplementary Material.
Conclusion
From analysis of wave power in the GoM, using simulated data from the WW3 numerical model with ERA-5 wind-forcing, good mean correlation coefficients and root mean squares were found when compared to the significant heights obtained from the Jason-2, Cryosat-2, and Saral satellites. While the WW3 model tends to underestimate storms, such as atmospheric frontal systems and hurricanes, the mean wave power was found to be 4 kW/m (variation coefficient 2), indicating unstable wave conditions. The month with the highest mean wave power was January (5.5 kW/m) and the lowest was July (2.5 kW/m). Winter was the most energetic season in the GoM, and summer the least. The monthly and seasonal variability in wave power was moderate.
Using the multi-criteria approach, AAHPA and Wavestar technology were found to be the most viable WEC devices at most of the GoM sites evaluated in this study. The functioning of these two WECs work uses an oscillating buoy. For the offshore sites assessed, Corpus Christi, Matamoros, La Pesca, and Tampico had the highest MCA values. A farm of submerged, wave activated devices would seem to be the most feasible alternative. These could provide electricity for nearby oil rigs, e.g., lighting, communications and impressed current cathodic protection to prevent underwater corrosion. Other possible end-uses could be the supply of electricity to power the electric motors used by fleets of fishing vessels, either via supply stations or by electricity repositories. For nearshore sites, oscillating buoys are probably suitable, offering similar services. In addition to these end-uses of the electricity generated by wave power, water desalination plants in the area could also benefit from more sustainably produced energy.
The provision of electricity from the harnessing of wave power to isolated and socially marginalized communities around the 9 sites assessed would also be a possible goal. As of now, there are no wave powered energy generating plants in the GoM, as indeed is the case in the rest of the world.
If we are to meet the commitments made in the various internationally signed treaties to produce more energy from sustainable, clean sources, and to reduce our dependency on fossil fuels, every potential avenue must be evaluated. We believe that there is a future for marine energy, particularly wave powered electricity generation in the GoM. Nevertheless, substantial wave-to-wire simulations and economic assessments are still required to improve the attractiveness of such projects. Investigation into capital and operational expenditures, as well as levelized cost of energy studies are vital to assure commercial success.
The GoM, in common with many other places in the world, has not been considered suitable for wave energy harvesting as it does not have high energy potential. Existing European WECs do not work efficiently with the low energy waves of the GoM, and would have to be adapted, elevating costs and thus becoming less attractive to potential investors. However, this study shows that for areas with prevailing wave periods of 5–8 s, floating buoy systems are viable, technically and economically in the near future.
Data availability statement
The raw data supporting the conclusion of this article will be made available by the authors, without undue reservation.
Author contributions
MD-M.: conceptualization, methodology, software, validation, formal analysis, investigation, writing—original draft preparation, visualization. MU: conceptualization, methodology, formal analysis, investigation, writing—original draft preparation, writing—review and editing, supervision, funding acquisition. RS: conceptualization, formal analysis, writing—review and editing, supervision, funding acquisition.
Funding
This research was funded by the Fondo de Sustentabilidad CONACYT-SENER (Consejo Nacional de Ciencia y Tecnología-Secretaría de Energía) through the Centro Mexicano de Innovación en Energías del Océano (CEMIE-Océano), Grant Number 249795.
Acknowledgments
MD-M is grateful for the support provided by the CONACyT doctoral scholarship.
Conflict of interest
The authors declare that the research was conducted in the absence of any commercial or financial relationships that could be construed as a potential conflict of interest.
Publisher’s note
All claims expressed in this article are solely those of the authors and do not necessarily represent those of their affiliated organizations, or those of the publisher, the editors and the reviewers. Any product that may be evaluated in this article, or claim that may be made by its manufacturer, is not guaranteed or endorsed by the publisher.
Supplementary material
The Supplementary Material for this article can be found online at: https://www.frontiersin.org/articles/10.3389/fenrg.2022.929625/full#supplementary-material
References
Aderinto, T., and Li, H. (2020). Conceptual design and simulation of a self-adjustable heaving point Absorber based wave energy converter. Energies 13 (8), 1997. doi:10.3390/en13081997
Aderinto, T., and Li, H. (2019). Review on power performance and efficiency of wave energy converters. Energies 12 (22), 4329. doi:10.3390/en12224329
Ambühl, S., Kramer, M., and Dalsgaard Sørensen, J. (2016). Structural reliability of plain bearings for wave energy converter applications. Energies 9 (2), 118. doi:10.3390/en9020118
Amrutha, M. M., and Sanil Kumar, V. (2022). Evaluation of a few wave energy converters for the Indian shelf seas based on available wave power. Ocean. Eng. 244, 110360. doi:10.1016/j.oceaneng.2021.110360
Appendini, C. M., Torres-Freyermuth, A., Salles, P., López-González, J., and Mendoza, E. T. (2014). Wave climate and trends for the Gulf of Mexico: A 30-yr wave hindcast. J. Clim. 27 (4), 1619–1632. doi:10.1175/JCLI-D-13-00206.1
Appendini, C. M., Urbano-Latorre, C. P., Figueroa, B., Dagua-Paz, C. J., Torres-Freyermuth, A., and Salles, P. (2015). Wave energy potential assessment in the Caribbean Low Level Jet using wave hindcast information. Appl. Energy 137, 375–384. doi:10.1016/j.apenergy.2014.10.038
Ardhuin, F., Rogers, E., Babanin, A. V., Filipot, J.-F., Magne, R., Roland, A., et al. (2010). Semiempirical dissipation source functions for ocean waves. Part I: Definition, calibration, and validation. J. Phys. Oceanogr. 40 (9), 1917–1941. doi:10.1175/2010jpo4324.1
Babarit, A., Hals, J., Muliawan, M. J., Kurniawan, A., Moan, T., and Krokstad, J. (2012). Numerical benchmarking study of a selection of wave energy converters. Renew. Energy 41, 44–63. doi:10.1016/j.renene.2011.10.002
Bureau of Safety and Environmental Enforcement (2019). How many platforms are in the Gulf of Mexico? [Online]. Available at: https://www.bsee.gov/faqs/how-many-platforms-are-in-the-gulf-of-mexico.
Cameron, L., Doherty, R., Henry, A., Doherty, K., Van’t Hoff, J., Kaye, D., et al. (2010). “Design of the next generation of the Oyster wave energy converter,” in 3rd international conference on ocean energy (Spain: ICOE Bilbao), 1e12.
Carcas, M. C. (2003). The OPD Pelamis WEC: Current status and onward programme (2002). Int. J. Ambient Energy 24 (1), 21–28. doi:10.1080/01430750.2003.9674899
Centro Nacional de Prevención de desastres (CENAPRED) (2019). Vientos del sur, surada. [Online]. Available at: https://www.gob.mx/cenapred/articulos/vientos-del-sur-surada (Accessed February 17, 2022).
Chen, W.-x., Gao, F., and Meng, X.-d. (2018). Oscillating body design for A 3-DOF wave energy converter. China Ocean. Eng. 32 (4), 453–460. doi:10.1007/s13344-018-0047-4
CONAGUA, S. (2019). Reporte del Clima en México. reporte anual[Online]. Available at: https://smn.conagua.gob.mx/tools/DATA/Climatolog%C3%ADa/Diagn%C3%B3stico%20Atmosf%C3%A9rico/Reporte%20del%20Clima%20en%20M%C3%A9xico/Anual2019.pdf.
Copernicus Climate Change Service (C3S) (2019). “ERA5: Fifth generation of ECMWF atmospheric reanalyzes of the global cli-mate,” in Copernicus climate change Service climate data store (CDS). [Online]. Available at: https://cds.climate.copernicus.eu/cdsapp#!/home.
Cornett, A. M. (2008). “A global wave energy resource assessment,” in The eighteenth international offshore and polar engineering conference. ISOPE-I-08-370.
Curto, D., Franzitta, V., and Guercio, A. (2021). sea wave energy. A review of the current technologies and perspectives. Energies 14 (20), 6604. doi:10.3390/en14206604
Drew, B., Plummer, A. R., and Sahinkaya, M. N. (2009). A review of wave energy converter technology. Proc. Institution Mech. Eng. Part A J. Power Energy 223 (8), 887–902. doi:10.1243/09576509JPE782
EMEC (2022). Pelamis wave power. [Online]. Available at: www.emec.org.uk/about-us/wave-clients/pelamis-wave-power (Accessed 07 15, 2022).
Farrok, O., Ahmed, K., Tahlil, A. D., Farah, M. M., Kiran, M. R., and Islam, M. R. (2020). Electrical power generation from the oceanic wave for sustainable advancement in renewable energy technologies. Sustainability 12 (6), 2178. doi:10.3390/su12062178
Felix, A., Mendoza, E., Chávez, V., Silva, R., and Rivillas-Ospina, G. (2018). Wave and wind energy potential including extreme events: A case study of Mexico. J. Coast. Res. 85 (1), 1336–1340. doi:10.2112/SI85-268.1
Foteinis, S., Hancock, J., Mazarakis, N., Tsoutsos, T., and Synolakis, C. E. (2017). A comparative analysis of wave power in the nearshore by WAM estimates and in-situ (AWAC) measurements. The case study of Varkiza, Athens, Greece. Energy 138, 500–508. doi:10.1016/j.energy.2017.07.061
Foteinis, S. (2022). Wave energy converters in low energy seas: Current state and opportunities. Renew. Sustain. Energy Rev. 162, 112448. doi:10.1016/j.rser.2022.112448
GEBCO Compilation Group (GEBCO) (2021). GEBCO 2021 grid. [Online]. Available at: https://www.gebco.net/data_and_products/gridded_bathymetry_data/.
Guiberteau, K., Lee, J., Liu, Y., Dou, Y., and Kozman, T. A. (2015). Wave energy converters and design considerations for Gulf of Mexico. Distributed Generation Altern. Energy J. 30 (4), 55–76. doi:10.1080/21563306.2015.11667613
Guillou, N., and Chapalain, G. (2020). Assessment of wave power variability and exploitation with a long-term hindcast database. Renew. Energy 154, 1272–1282. doi:10.1016/j.renene.2020.03.076
Guillou, N. (2020). Estimating wave energy flux from significant wave height and peak period. Renew. Energy 155, 1383–1393. doi:10.1016/j.renene.2020.03.124
Gunn, K., and Stock-Williams, C. (2012). Quantifying the global wave power resource. Renew. Energy 44, 296–304. doi:10.1016/j.renene.2012.01.101
Haces-Fernandez, F., Li, H., and Ramirez, D. (2018). Assessment of the potential of energy extracted from waves and wind to supply offshore oil platforms operating in the Gulf of Mexico. Energies 11 (5), 1084. doi:10.3390/en11051084
Heo, S., and Koo, W. (2021). Dynamic response analysis of a wavestar-type wave energy converter using augmented formulation in Korean nearshore areas. Processes 9 (10), 1721. doi:10.3390/pr9101721
Hernández-Fontes, J. V., Felix, A., Mendoza, E., Cueto, Y. R., and Silva, R. (2019). On the marine energy resources of Mexico. J. Mar. Sci. Eng. 7 (6), 191. doi:10.3390/jmse7060191
Kalourazi, M. Y., Siadatmousavi, S. M., Yeganeh-Bakhtiary, A., and Jose, F. (2021). WAVEWATCH-III source terms evaluation for optimizing hurricane wave modeling: A case study of hurricane ivan. Oceanologia 63 (2), 194–213. doi:10.1016/j.oceano.2020.12.001
Kamranzad, B., and Hadadpour, S. (2020). A multi-criteria approach for selection of wave energy converter/location. Energy 204, 117924. doi:10.1016/j.energy.2020.117924
Kamranzad, B., Lin, P., and Iglesias, G. (2021). Combining methodologies on the impact of inter and intra-annual variation of wave energy on selection of suitable location and technology. Renew. Energy 172, 697–713. doi:10.1016/j.renene.2021.03.062
Langlee Wave Power AS (2013). Langlee: Innovation for a better solution. [Online]. Available at: www.langleewp.com/?q=langlee-story (Accessed 07 15, 2022).
Lavelle, J., and Kofoed, J. P. (2011). Power production analysis of the OE buoy WEC for the cores project. Department of Civil Engineering, Aalborg University. Technical reports No. 119.
Lavidas, G., Agarwal, A., and Venugopal, V. (2018). Availability and accessibility for offshore operations in the mediterranean sea. J. Waterw. Port. Coast. Ocean. Eng. 144 (6), 05018006. doi:10.1061/(ASCE)WW.1943-5460.0000467
Lavidas, G. (2019). Energy and socio-economic benefits from the development of wave energy in Greece. Renew. Energy 132, 1290–1300. doi:10.1016/j.renene.2018.09.007
Marquis, L., Kramer, M., Kringelum, J., Chozas, J. F., and Helstrup, N. E. (2012). “Introduction of wavestar wave energy converters at the Danish offshore wind power plant horns rev 2,” in Paper presented at 4th international conference on Ocean Energy Dublin, Ireland. Available at: http://www.icoe2012dublin.com/ICOE_2012/papers.html.
Massel, S. R. (1996). “Ocean surface waves: their physics and prediction,” in Advanced Series on OceanEngineering. World Scientific 11, 491.
Mørk, G., Barstow, S., Kabuth, A., and Pontes, M. T. (2010). “Assessing the global wave energy potential,” in 29th International Conference on Ocean, Offshore Mechanics and Arctic Engineering, 447–454.
Ocean Energy Ireland (2017). Design – build – test: The Ocean Energy philosophy. [Online]. Available at: www.oceanenergy.ie/oetechnology1/development (Accessed 07 15, 2022).
Ojeda, E., Appendini, C. M., and Mendoza, E. T. (2017). Storm-wave trends in Mexican waters of the Gulf of Mexico and caribbean sea. Nat. Hazards Earth Syst. Sci. 17 (8), 1305–1317. doi:10.5194/nhess-17-1305-2017
Patel, R. P., Nagababu, G., Arun Kumar, S. V. V., Seemanth, M., and Kachhwaha, S. S. (2020). Wave resource assessment and wave energy exploitation along the Indian coast. Ocean. Eng. 217, 107834. doi:10.1016/j.oceaneng.2020.107834
Pérez, E. P., Magaña, V., Caetano, E., and Kusunoki, S. (2014). Cold surge activity over the Gulf of Mexico in a warmer climate1. Front. Earth Sci. 2, 19. doi:10.3389/feart.2014.00019
Pérez-Denicia, E., Fernández-Luqueño, F., Vilariño-Ayala, D., Manuel Montaño-Zetina, L., and Alfonso Maldonado-López, L. (2017). Renewable energy sources for electricity generation in Mexico: A review. Renew. Sustain. Energy Rev. 78, 597–613. doi:10.1016/j.rser.2017.05.009
Piollé, J.-F., Dodet, G., and Quilfen, Y (2020). ESA Sea State Climate Change Initiative (Sea_State_cci): Global remote sensing multi-mission along-track significant wave height, L2P product, version 1.1. CEDA. doi:10.5285/f91cd3ee7b6243d5b7d41b9beaf397e1
Rosengaus, M., Jiménez, M., and Vázquez, M. (2014). “Atlas climatológico de ciclones tropicales en México,” in México. Secretaría de Gobernación; méxico. Centro nacional de Prevención de Desastres (CENAPRED) México. [Online]. Available at: https://www.acapulco.gob.mx/proteccioncivil/fasiculos/Atlas_climatologico.pdf.
Rusu, L., and Rusu, E. (2021). Evaluation of the worldwide wave energy distribution based on ERA5 data and altimeter measurements. Energies 14 (2), 394. doi:10.3390/en14020394
Salcedo, F., Ruiz-Minguela, P., Rodriguez, R., Ricci, P., and Santos, M. (2009). “Oceantec: Sea trials of a quarter scale prototype,” in Proceedings of 8th European wave tidal energy conference), 460–465.
Sangalugeme, C., Luhunga, P., Kijazi, A., and Kabelwa, H. (2018). Validation of operational WAVEWATCH III wave model against satellite altimetry data over South West Indian Ocean off-coast of Tanzania. Appl. Phys. Res. 10 (4), 55. doi:10.5539/apr.v10n4p55
SENER (2020). Balance nacional de Energía. [Online]. Available at: https://www.gob.mx/cms/uploads/attachment/file/707654/BALANCE_NACIONAL_ENERGIA_0403.pdf (Accessed Febraury 17, 2022).
Silva, D., Rusu, E., and Soares, C. G. (2013). Evaluation of various technologies for wave energy conversion in the Portuguese nearshore. Energies 6 (3), 1344–1364. doi:10.3390/en6031344
Soerensen, H. C., and Weinstein, A. (2008). Ocean Energy: position paper for IPCC. Hohmeyer Trittin, 93–102.
Stuhlmeier, R., and Xu, D. (2018). WEC design based on refined mean annual energy production for the Israeli Mediterranean coast. J. Waterw. Port, Coast. Ocean Eng. 14 (4), 06018002. doi:10.1061/(ASCE)WW.1943-5460.0000451
Sun, Z., Zhang, H., Xu, D., Liu, X., and Ding, J. (2020). Assessment of wave power in the South China Sea based on 26-year high-resolution hindcast data. Energy 197, 117218. doi:10.1016/j.energy.2020.117218
WaveStar (2019). The wavestar story. [Online]. Available at: wavestarenergy.com/projects (Accessed 07 15, 2022).
WAVEWATCH III Development Group (WW3DG) (2019). User manual and system documentation of WAVEWATCH III ver-sion 6.07. College Park, MD, USA: NOAA/NWS/NCEP/MMAB, 465. Tech. Note 333Appendices [Online]. Available at: https://raw.githubusercontent.com/wiki/NOAA-EMC/WW3/files/manual.pdf (Accessed February 15, 2022).
Wessel, P., and Smith, W. H. F. (1996). A global, self-consistent, hierarchical, high-resolution shoreline database. J. Geophys. Res. 101 (B4), 8741–8743. doi:10.1029/96JB00104
Young, I. R., and Burchell, G. P. (1996). Hurricane generated waves as observed by satellite. Ocean. Eng. 23 (8), 761–776. doi:10.1016/0029-8018(96)00001-7
Keywords: wave power, wave energy converters, wavewatch III, gulf of Mexico, multi-criteria approach
Citation: Diaz-Maya M, Ulloa M and Silva R (2022) Assessing wave energy converters in the gulf of Mexico using a multi-criteria approach. Front. Energy Res. 10:929625. doi: 10.3389/fenrg.2022.929625
Received: 27 April 2022; Accepted: 01 August 2022;
Published: 31 August 2022.
Edited by:
Giovanni Malara, Mediterranea University of Reggio Calabria, ItalyReviewed by:
Purnima Jalihal, National Institute of Ocean Technology, IndiaAndrea Scialò, Mediterranea University of Reggio Calabria, Italy
Copyright © 2022 Diaz-Maya, Ulloa and Silva. This is an open-access article distributed under the terms of the Creative Commons Attribution License (CC BY). The use, distribution or reproduction in other forums is permitted, provided the original author(s) and the copyright owner(s) are credited and that the original publication in this journal is cited, in accordance with accepted academic practice. No use, distribution or reproduction is permitted which does not comply with these terms.
*Correspondence: Marco Ulloa, bXVsbG9hdEBpcG4ubXg=