 Fu Shen
 Zhiwen Yang
- Faculty of Electric Power Engineering, Kunming University of Science and Technology, Kunming, China
As the rapid and continually proliferation of photovoltaic (PV) systems are connected to the power system, the load structure are changeable to lack an accurate dynamic discrete equivalent model to describe its characteristics of power grid. In this study, the generalized discrete-time equivalent model (GDEM) of PV system using a fourth-order dynamic equivalent model for representing the physical characteristics of PV power stations are proposed in power system dynamic studies. The paper then investigates the inherent relations among GDEM parameters in the discrete-time models of PV system to facilitate the GDEM parameters estimation in PV system. Finally, the least square method (LSM) was to identify the GDEM of PV system parameters, and various types of ground faults and PV penetration rate levels is adopted to verify the dynamic characteristics of the proposed GDEM of PV system in power system simulations.
1 Introduction
WITH the highly penetration of renewable energy is accessed into the power grid by substituting the traditional power generation (Li et al., 2017), (Shahidehpour et al., 2017). It is challenging to attain an equivalent model for the power system (Milano, 2016), (Ju et al., 2019).
PV power generation system (PGs) in distribution grids have threatened the transmission system stability in whole traditional power system when the highly PV penetration rate levels system is connected to the large power grid (Eftekharnejad et al., 2013). Simultaneously, the unique characteristics of the PV PGs are accelerating the burdensome complexity characteristics of the power load (Ju et al., 1996), (Ju et al., 2007), the traditional PV PGs cannot directly reflect the dynamic relationship of PV power grid to the whole power system.
The rapid deployments of PV in power grids have pushed the power system analysts to seek new solutions and technical alternatives to manage the operation and control of stressed power systems in extreme conditions (Price et al., 1993; Kundur, 1994; Ju et al., 2004; Ramirez et al., 2016).
Specific components of the PV PGs were considered in the process of modeling. Ref. (Chunlai et al., 2016) concentrated on the core device inverters, and a dynamic model was established by considering the DC side of inverter and PV array, AC measurement and transformer. Ref. (Plathottam et al., 2019) proposed a dynamic vector model for PV PGs based on the controlled current source and voltage source. Ref. (Li et al., 2018) established a 3rd order of PV PGs with an inverter controller. Ref. (Samadi et al., 2015) expanded a gray-box model for modeling the proliferation of a PV PGs, where the PV PGs is aggregated as a separate entity in a distribution grid. Ref. (Olayiwola and Barendse, 2020) exploited the dynamic alternating current equivalent modeling of the polycrystalline silicon wafer-based PV cell with various operational and fault conditions. Ref. (Hsieh et al., 2020) proposed an equivalent electric circuit for interpreting the dynamic behavior of PV panel based on the commonly used one-diode model with an additional parasitic capacitance. Nonetheless, the dynamic characteristics of PV PGs are not considered from the distribution grid-connected side, which is essential for analyzing the dynamic characteristics of a grid-connected system (Shiroei et al., 2016).
Ref. (Khamis et al., 2013) investigated the dynamic behavior of different subsystems of PV PGs, the interaction theory of each component to the PV grid-connected PGs was revealed. Ref. (Wai and Wang, 2008) constructed an equivalent model to describe the generalized comprehensive load. Due to the complexity of comprehensive load, the model parameters needed to estimate are still large, and the model in ref. (Khamis et al., 2013) and (Wai and Wang, 2008) cannot meet the transient response of the power system.
Therefore, it is essential to make a broaden exploration on the dynamic response of the PV power grid. In this paper, a GDEM for the PV PGs with various types of faults and PV penetration rate levels is proposed as shown in Figure 1. The PV PGs parameters are provided at the measured point located at the terminal buses.
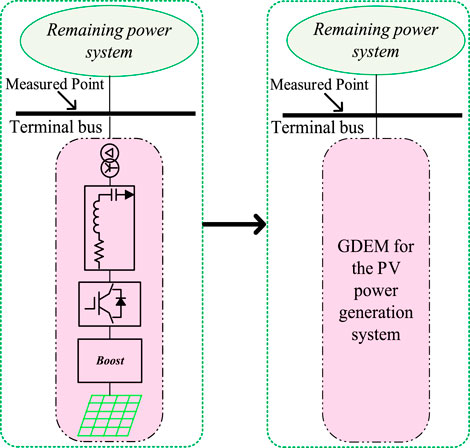
FIGURE 1. GDEM representing the PV PGs.
The main contribution of this paper are shown as follows:
1. The paper proposes a GDEM for the PV PGs using a fourth-order dynamic equivalent.
2. The relations among GDEM of PV system parameters estimated by LSM are explored to guide the accurateness of the GDEM parameter estimation in PV system.
3. Various types of ground faults and PV penetration rate levels is used to prove the dynamic characteristics of the proposed GDEM of PV system in simulation.
The remainder of this paper is formed as follows: The dynamic model of PV PGs in grid-connected side is introduced in the Section 2. Then, the paper proposes the GDEM of PV PGs in Section 3. The accuracy of the proposed PV system is discussed and verified in Section 4. Subsequently, Section V concludes the paper.
2 The dynamic model of PV PGS in grid-connected system
An accurate power load model of power system is the basis of simulation for the operation of power system, which facilitate the power flow calculation and stability analysis.
With the large number of distributed PV PGs connected to the transmission grid, the uncertainty of the power grid increased the complexity of the power load. The comprehensively PV PGs model cannot reflect the dynamic characteristics of the power grid. The ideal power load model structure is different with the real distribution system, the traditional ZIP load model is no longer applicable to the power grid.
Considering the active, reactive, voltage, and frequency of the PV PGs, the differential of the PV PGs is used to describe the dynamic PV PGs.
As this paper focus on the study of the characteristics for the external PV PGs, the different relationship between the voltage and the voltage of the power network are studied. The model of PV PGs is depicted in Figure 2, consisted by PV array, DC/DC booster converter, DC/AC three-phase inverter, LC filter and isolation transformer (Li et al., 2021).
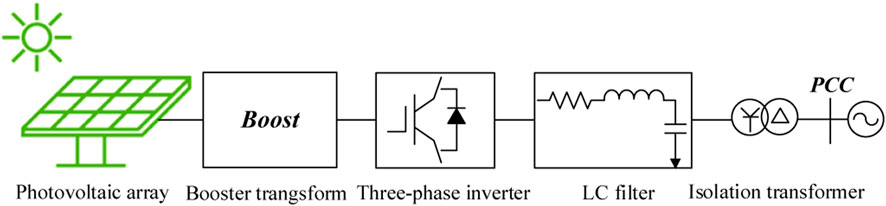
FIGURE 2. Grid connected model of PV power system.
According to the relevant traditional regulations on grid of PV PGs, the single capacity of distributed PV PGs into the power grid cannot exceed 6 MW. As the capacity of PV PGs is very small, the low voltage crossing is not considered for distributed PV PGs. The light intensity and temperature of the PV arrays are fixed as constant at a minimal time scale to ensure that the PV arrays work in the best state.
When the control parameters of the inverter are known, the modulation parameters are set as a fixed value. The characteristics of the external PV PGs entirely depends on the voltage conversion of the parallel network. For external grids, the dynamic model of the PV PGs (Kawabe and Tanaka, 2015) is shown as the (Eq. 1).
When Ugq = 0, then the (Eq. 1) is calculated as the (Eq. 2),
In order to describe the dynamic characteristics of the PV PGs reasonably and accurately, the single-phase dynamic equivalent model of the PV PGs is established, as shown in Figure 3.
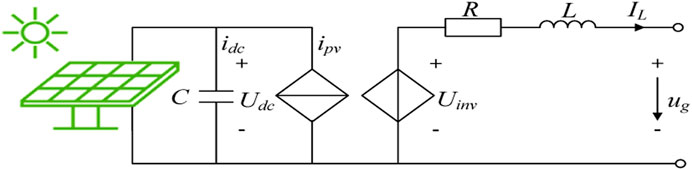
FIGURE 3. Single phase dynamic equivalent model PV.
According to the Kirkhoff voltage and current law, the dynamic equivalent model of the PV is expressed as the (Eq. 3),
The 3rd order dynamic differential equation in the d-q axis is obtained as the (Eq. 4),
3 GDEM of PV PGS
The incremental transformation of the (Eq. 3) in the frequency domain are shown as the (Eq. 4),
where parameters in the (Eq. 5) is given in the Appendix A.
The dq-xy coordinates are shown as the (Eq. 6),
Subsequently, the (Eq. 6) is derived as the (Eq. 7),
When the transformation matrix
where parameters in the (Eq. 8) and (Eq. 9) are given in the Appendix B.
The bilinear transformation (Also known as Tustin’s method) is a special case of a conformal mapping, which could compress the infinite frequency range to a finite one to warp the frequency response of any discrete-time linear system (Shen et al., 2018), (Shen et al., 2016). Accordingly, when the bilinear transformation is used to the (Eq. 8) and (Eq. 9), the GDEM of the PV PGs are shown as,
where parameters in the (Eq. 10) are presented in the Appendix C.
The measured data of the PV PGs in the terminal bus were used to estimate the parameters of the GDEM for PV PGs by using the LSM (Nabavi and Chakrabortty, 2017). Correspondingly, the nonlinear model of the (Eq. 10) are shown as the (Eq. 11),
where
In order to attain the parameters of GDEM for the PV power generation, the residual ε is shown as the (Eq. 12),
The total residual J of the GDEM is calculated as the (Eq. 13),
The estimated parameters
Additionally, the RMSE of the difference between actual and estimated values of GDEM for the PGs is shown as the (Eq. 15).
4 Simulation and analysis
The power transmission and distribution simulation system is shown in Figure 4, depicted for the proposed simulation of the GDEM of PV PGs.
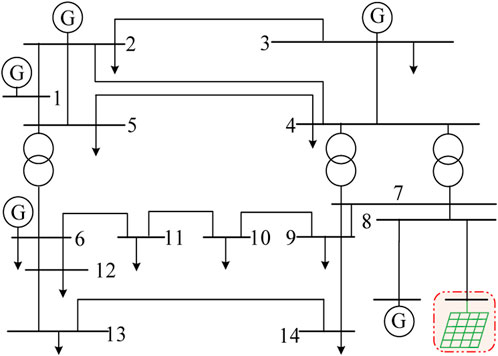
FIGURE 4. PV PGs integrated into IEEE 14 node topology.
To substantiate the practicability of the proposed GDEM for PV PGs, the following values are adopted in the simulation IEEE 14 node system, the detailed parameters of the system related to our simulation are listed as follows:
1. In the IEEE 14 node power transmission system, the bus voltage in the IEEE 14-bus is 23 kV, the system frequency is 50Hz, and the reference capacity is 100 MW. Series RL are used as the system impedance, where L = 0.618H, R = 0.4 Ω.
2. In the PV PGs, the total capacity of the PV power station is set as 1 MW (PV penetration rate levels in the is 20%) and 1.5 MW (PV penetration rate levels in the is 30%), respectively; the voltage at node 8 is 23 kV where the grid connection occurs. The PV array parameters are shown in Table 1, the initial light intensity of the PV power station is 1,000, and the temperature is 25 °C.

TABLE 1. PV cell parameters.
The various types of faults and PV penetration rate levels are setting as follows:
4.1 Operating condition 1
The PV penetration rate levels in the 1st scenario is 20% (30%). For the reason that the single-phase-to-ground fault is the most common fault in power systems, which is used in this operating condition. The fault is used at t = 1.2s to the transmission line settled between BUS7 and BUS8. Correspondingly, the fault is eliminated at t = 1.21s. Simultaneously, 3% and 5% voltage dips F1 and F2 with 20% PV penetration rate levels (F3 and F4 with 30% PV penetration rate levels) are obtained by fixing the ground resistances.
4.2 Operating condition 2
The PV penetration rate levels in the 2nd scenario is 20% (30%). For the reason that the single-phase-to-ground fault is the most common fault in power systems, which is used in this operating condition. The fault is used at t = 1.2s to the transmission line settled between BUS8 and BUS9. Correspondingly, the fault is eliminated at t = 1.21s. Simultaneously, 3% and 5% voltage dips F5 and F6 with 20% PV penetration rate levels (F7 and F8 with 30% PV penetration rate levels) are obtained by fixing the ground resistances.
4.3 Operating condition 3
The PV penetration rate levels in the 3rd scenario is 20% (30%). For the reason that the three-phase-to-ground fault is the most serious fault in power systems, which is used in this operating condition. The fault is used at t = 1.2s to the transmission line settled between BUS7 and BUS8. Correspondingly, the fault is eliminated at t = 1.21s. Simultaneously, 3% and 5% voltage dips F9 and F10 with 20% PV penetration rate levels (F11 and F12 with 30% PV penetration rate levels) are obtained by fixing the ground resistances.
4.4 Operating condition 4
The PV penetration rate levels in the 4th scenario is 20% (30%). For the reason that the three-phase-to-ground fault is the most serious fault in power systems, which is used in this operating condition. The fault is used at t = 1.2s to the transmission line settled between BUS8 and BUS9. Correspondingly, the fault is eliminated at t = 1.21s. Simultaneously, 3% and 5% voltage dips F13 and F14 with 20% PV penetration rate levels (F15 and F16 with 30% PV penetration rate levels) are obtained by fixing the ground resistances.
Due to manuscript page limitations, the Ij fitting Figs. of the GDEM for PV PGs are excluded in this paper.
The GDEM parameters of the PV PGs with these 16 disturbances in 4 operating conditions are listed in Table 2. The Table 2 illustrate that the total value of output state parameters of the proposed GDEM for PV PGs is close to 1, and the total value of input state parameters of the proposed GDEM for PV PGs is close to 0. The relations among parameters afford a theoretical basis to verify the GDEM parameters of the PV PGs and reduce the number of estimated GDEM0 parameters of the PV PGs.
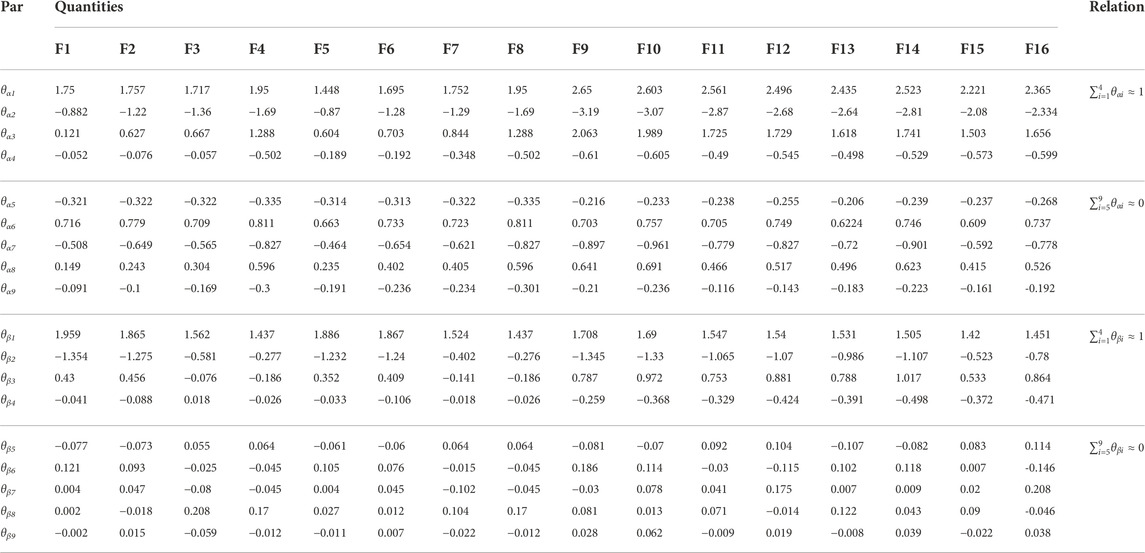
TABLE 2. GDEM parameters of the PV PGs.
The results for GDEM of PV PGs and the actual power system operation conditions of Ir corresponding to the four faults in operating condition 1 are shown in Figures 5, 6. Figures 7, 8 demonstrate the results of Ir for operating condition 2. Figures 9, 10 demonstrate the results of Ir for operating condition 3. Figures 11, 12 demonstrate the results of Ir for operating condition 4. In Figures 5–12, the black curve is an actual measure value in terminal BUS, and the red curve relates to estimated parameters of GDEM for PV PGs. Figures 5, 6 are anlyzed with concerning the operating conditions 1, as follows: The estimated Ir for GDEM of PV PGs are fitting closely to the actual measure curves while the single-phase-to-ground fault is used at the transmission line settled between BUS7 and BUS8, only with a slight difference in enlarged part in with the 20% and 30% PV penetration rate levels, respectively.
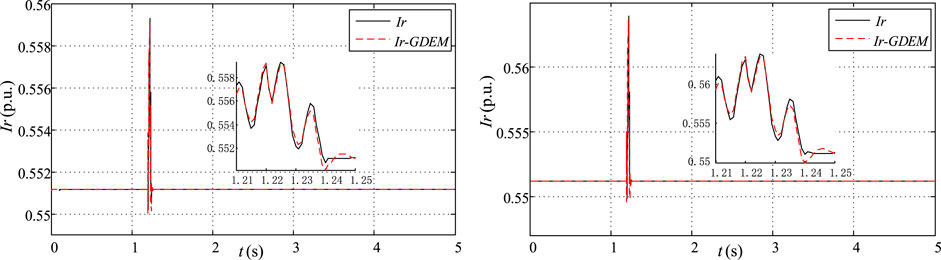
FIGURE 5. Dynamic characteristic response of the real part of the current with F1 and F2 in operating condition 1.
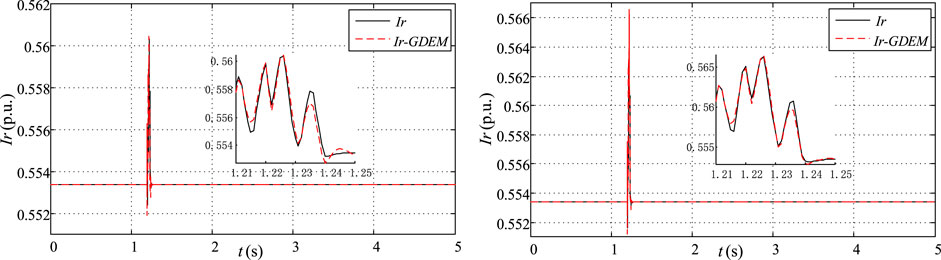
FIGURE 6. Dynamic characteristic response of the real part of the current with F3 and F4 in operating condition 1.
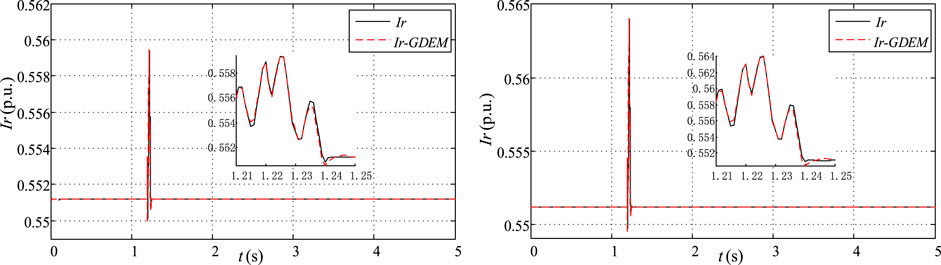
FIGURE 7. Dynamic characteristic response of the real part of the current with F5 and F6 in operating condition 2.
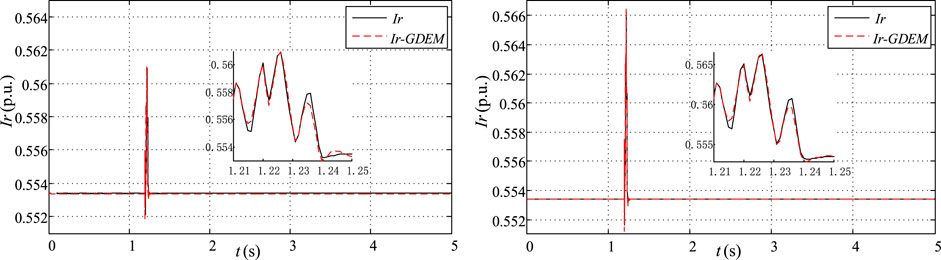
FIGURE 8. Dynamic characteristic response of the real part of the current with F7 and F8 in operating condition 2.
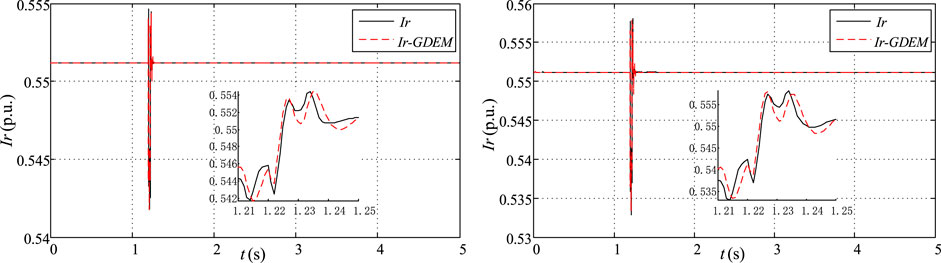
FIGURE 9. Dynamic characteristic response of the real part of the current with F9 and F10 in operating condition 3.
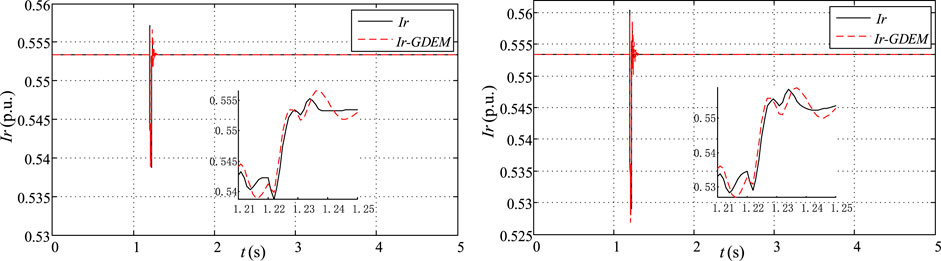
FIGURE 10. Dynamic characteristic response of the real part of the current with F11 and F12 in operating condition 3.

FIGURE 11. Dynamic characteristic response of the real part of the current with F13 and F14 in operating condition 4.
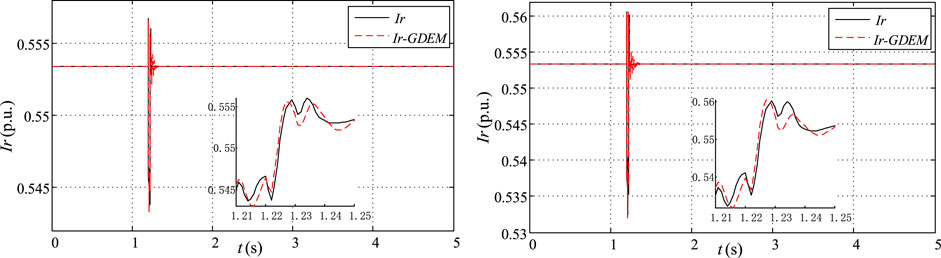
FIGURE 12. Dynamic characteristic response of the real part of the current with F15 and F16 in operating condition 4.
Figures 6, 7 are anlyzed with concerning the operating conditions 2, as follows: The estimated Ir for GDEM of PV PGs are fitting closely to the actual measure curves while the single-phase-to-ground fault is used at the transmission line settled between BUS8 and BUS9, only with a slight difference in enlarged part in with the 20% and 30% PV penetration rate, respectively.
Figures 8, 9 are anlyzed with concerning the operating conditions 3, as follows: The estimated Ir for GDEM of PV PGs are fitting closely to the actual measure curves while the three-phase-to-ground fault is used at the transmission line settled between BUS7 and BUS8, only with a slight difference in enlarged part in with the 20% and 30% PV penetration rate, respectively.
Figures 10, 11 are anlyzed with concerning the operating conditions 4, as follows: The estimated Ir for GDEM of PV PGs are fitting closely to the actual measure curves while the three-phase-to-ground fault is used at the transmission line settled between BUS8 and BUS9, only with a slight difference in enlarged part in with the 20% and 30% PV penetration rate, respectively.
Figures 5, 6 and Figures 9, 10, Figures 7, 8 and Figures 11, 12 are anlyzed with concerning the same ground fault with the 20% and 30% PV penetration rate, respectively, as follows: The estimated Ir for GDEM of PV PGs are fitting closely to the actual measure curves while the different fault is used at the different transmission line settled between BUS8 and BUS9 or BUS8 and BUS9, only with a slight difference in enlarged part in with the 20% and 30% PV penetration rate, respectively.
The RMSE of GDEM for the PV PGs are listed in Table 3 The RMSE of Ir and Ij in F1-F16 are very small, respectively, which reveal that GDEM of PV PGs can perform satisfactorily in various types of faults and PV penetration.
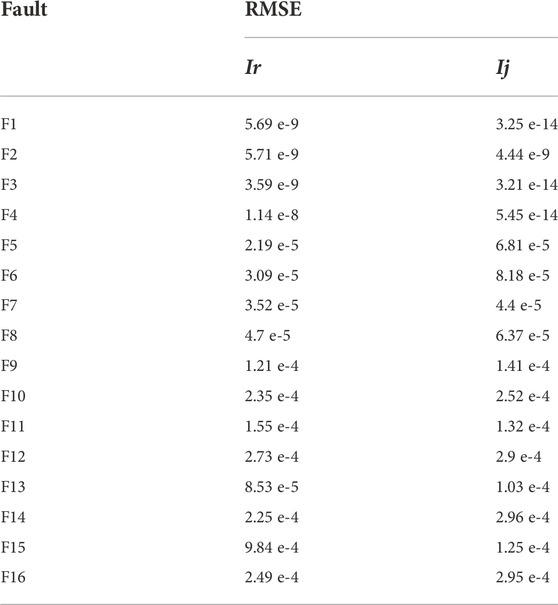
TABLE 3. RMSE of GDEM for the PV PGs.
5 Conclusion
The paper proposed GDEM for the PV PGs using a fourth-order dynamic equivalent based on the physical model of PV power station. The IEEE 14-bus system was adopted to verify the dynamic characteristic of GDEM for the PV system with various types of ground faults and PV penetration rate levels. The accuracy of the fitting effect with different faults and PV penetration rate levels in the simulation system validated the dynamic characteristic of GDEM for PV system. In addition, the total value of output state parameters of the GDEM of PV PGs is close to 1, and the total value of input state parameters of the GDEM of PV PGs is close to 0. Meanwhile, we will expand the modeling interface (MI) for interfacing the grid-connected PV PGs in our future research work.
Data availability statement
The original contributions presented in the study are included in the article/supplementary material, further inquiries can be directed to the corresponding author.
Author contributions
FS: Methodology, ZY: Software, SL: Validation, GY: Original draft preparation.
Funding
This work was supported by the National Natural Science Foundation of China (52107097), Yunnan Fundamental Research Projects (202101BE070001-061, 202201AU070111) and the High-level Platform Construction Project of Kunming University of Science and Technology (KKZ7202004004).
Conflict of interest
The authors declare that the research was conducted in the absence of any commercial or financial relationships that could be construed as a potential conflict of interest.
Publisher’s note
All claims expressed in this article are solely those of the authors and do not necessarily represent those of their affiliated organizations, or those of the publisher, the editors and the reviewers. Any product that may be evaluated in this article, or claim that may be made by its manufacturer, is not guaranteed or endorsed by the publisher.
References
Chunlai, L., Libin, Y., Yun, T., and Yipeng, Z. (2016). “Dynamic modeling and simulation of the grid-connected PV power station,” in 2016 International Conference on Smart City and Systems Engineering (ICSCSE), Hunan, China, 25-26 November 2016 (IEEE), 346–349.
Eftekharnejad, S., Vittal, V., Heydt, G. T., Keel, B., and Loehr, J. (2013). Impact of increased penetration of photovoltaic generation on power systems. IEEE Trans. Power Syst. 28 (2), 893–901. doi:10.1109/tpwrs.2012.2216294
Hsieh, Y., Yu, L., Chang, T., Liu, W., Wu, T., and Moo, C. (2020). Parameter identification of one-diode dynamic equivalent circuit model for photovoltaic panel. IEEE J. Photovolt. 10 (1), 219–225. doi:10.1109/jphotov.2019.2951920
Ju, P., Handschin, E., and Karlsson, D. (1996). Nonlinear dynamic load modelling: Model and parameter estimation. IEEE Trans. Power Syst. 11 (4), 1689–1697. doi:10.1109/59.544629
Ju, P., Shen, F., Shahidehpour, M., Li, Z., and Qin, C. (2019). Generalized discrete-time equivalent model for representing interfaces in wide-area power systems. IEEE Trans. Smart Grid 10 (4), 3504–3514. doi:10.1109/tsg.2018.2829120
Ju, P., Wu, F., Shao, Z. Y., Zhang, X. P., Fu, H. J., Zhang, P. F., et al. (2007). Composite load models based on field measurements and their applications in dynamic analysis. IET Gener. Transm. Distrib. 1 (5), 724–730. doi:10.1049/iet-gtd:20060430
Ju, P., Wu, F., Yang, N. G., Li, X. M., and He, N. Q. (2004). Dynamic equivalents of power systems with online measurements. Part 2: Applications. IEE Proc. Gener. Transm. Distrib. 151 (2), 179–182. doi:10.1049/ip-gtd:20040075
Kawabe, K., and Tanaka, K. (2015). Impact of dynamic behavior of photovoltaic power generation systems on short-term voltage stability. IEEE Trans. Power Syst. 30 (6), 3416–3424. doi:10.1109/tpwrs.2015.2390649
Khamis, A., Mohamed, A., Shareef, H., Ayob, A., and Aras, M. S. M. (2013). IEEE, 391–395.Modelling and simulation of a Single phase grid connected using photovoltaic and battery based power generation2013 European Modelling SymposiumManchester, UK20-22 November 2013
Li, F., Huang, Y., Wu, F., Liu, Y., and Zhang, X. (2018). Research on clustering equivalent modeling of large-scale photovoltaic power plants. Chin. J. Electr. Eng. 4 (4), 80–85. doi:10.23919/cjee.2018.8606793
Li, L., Zhang, L., and Zhao, Y. (2021). “Dynamic equivalent modeling of photovoltaic grid-connected PGs,” in 2021 6th Asia Conference on Power and Electrical Engineering (ACPEE), Chongqing, China, 8-11 April 2021 (IEEE), 1583–1587.
Li, Z., Shahidehpour, M., Aminifar, F., Alabdulwahab, A., and Al-Turki, Y. (2017). Networked microgrids for enhancing the power system resilience. Proc. IEEE 105 (7), 1289–1310. doi:10.1109/jproc.2017.2685558
Milano, F. (2016). Semi-implicit formulation of differential-algebraic equations for transient stability analysis. IEEE Trans. Power Syst. 31 (6), 4534–4543. doi:10.1109/tpwrs.2016.2516646
Nabavi, S., and Chakrabortty, A. (2017). Structured identification of reduced-order models of power systems in a differential- algebraic form. IEEE Trans. Power Syst. 32 (1), 198–207. doi:10.1109/tpwrs.2016.2554154
Olayiwola, O. I., and Barendse, P. S. (2020). Photovoltaic cell/module equivalent electric circuit modeling using impedance spectroscopy. IEEE Trans. Ind. Appl. 56 (2), 1690–1701. doi:10.1109/tia.2019.2958906
Plathottam, S. J., Abhyankar, S., and Hazra, P. (2019). “Dynamic modeling of solar PV systems for distribution system stability analysis,” in 2019 IEEE Power & Energy Society Innovative Smart Grid Technologies Conference (ISGT), Washington, DC, USA, 18-21 February 2019 (IEEE), 1–5.
Price, W., Chiang, H., Clark, H., and Concordia, C. (1993). Load representation for dynamic performance analysis. IEEE Trans. Power Syst. 8 (2), 472–482.
Ramirez, A., Mehrizi-Sani, A., Hussein, D., Matar, M., Abdel-Rahman, M., Jesus Chavez, J., et al. (2016). Application of balanced realizations for model-order reduction of dynamic power system equivalents. IEEE Trans. Power Deliv. 31 (5), 2304–2312. doi:10.1109/tpwrd.2015.2496498
Samadi, A., Member, S., Söder, L., and Member, S. (2015). Static equivalent of distribution grids with high penetration of PV systems. IEEE Trans. Smart Grid 6 (4), 1763–1774. doi:10.1109/tsg.2015.2399333
Shahidehpour, M., Shao, C., Wang, X., Wang, B., and Wang, X. (2017). Security-constrained unit commitment with flexible uncertainty set for variable wind power. IEEE Trans. Sustain. Energy 8 (3), 1237–1246. doi:10.1109/tste.2017.2673120
Shen, F., Ju, P., Gu, L., Huang, X., Lou, B., and Huang, H. (2016). “Mechanism analysis of power load using difference equation approach,” in IEEE International Conference on Power System Technology, Wollongong, NSW, Australia, 28 September 2016 - 01 October 2016 (IEEE), 1–6.
Shen, F., Ju, P., Shahidehpour, M., Li, Z., and Pan, X. (2018). Generalized discrete-time equivalent model for dynamic simulation of regional power area. IEEE Trans. Power Syst. 33 (6), 6452–6465. doi:10.1109/tpwrs.2018.2829119
Shiroei, M., Mohammadi-Ivatloo, B., and Parniani, M. (2016). Low-order dynamic equivalent estimation of power systems using data of phasor measurement units. Int. J. Electr. Power & Energy Syst. 74 (7), 134–141. doi:10.1016/j.ijepes.2015.07.015
Wai, R., and Wang, W. (2008). Grid-connected photovoltaic generation system. IEEE Trans. Circuits Syst. I. 55 (3), 953–964. doi:10.1109/tcsi.2008.919744
Nomenclature
Indices
i The parameter index
k The discrete time steps index
m The number of the data index
n The number of the coefficient index
Symbols
Δ The variables incremental value
0 Subscript for the steady state
Parameters
R Equivalent resistance
L Equivalent inductor
C Filter capacitor
Udc, idc The voltage and current of the DC side, respectively
ipv The output current of PV array
Uinv.abc Inverter instantaneous voltage
ug.abc Grid-connected instantaneous voltage
IL.abc Inverter instantaneous current
Id, Iq The current of the AC in d and q axis, respectively
Uid, Uiq The voltage of the AC in d and q axis, respectively
Ugd, Ugq Inverter voltage in d and q axis, respectively
ω Synchronous frequency
Sd, Sq Inverter voltage in d and q axis, respectively
h Sampling time step
P, Q Active power and reactive power, respectively
Ir, Ij PV real and imaginary currents
U Amplitude of the bus voltage
ε Residual value
Voc Open circuit voltage
Isc Short circuit current
Vm Optimal operating voltage
Im Optimal operating cunrrent
Variables
θαi, θβi GDEM coefficient of PV power generation system
s Laplace transform
t Time variables
Other notations are defined in the text.
Appendix
Appendix A: Specific parameters of the (Eq. 5)
Appendix B: Specific parameters of the (Eqs 8, 9)
θ0 is the initial grid power factor angle.
Appendix C: Specific parameters of the (Eq. 10)
Keywords: GDEM, PV penetration, power system dynamic, PV, LSM
Citation: Shen F, Yang Z, Li S and Yang G (2023) Generalized discrete equivalent model for PV system with various types of faults and PV penetration levels. Front. Energy Res. 10:945088. doi: 10.3389/fenrg.2022.945088
Received: 16 May 2022; Accepted: 29 August 2022;
Published: 11 January 2023.
Edited by:
Meng Song, Southeast University, ChinaReviewed by:
Gaurav Dhiman, Government Bikram College of Commerce Patiala, IndiaKenneth E. Okedu, National University of Science and Technology, Oman
Nishant Kumar, National University of Singapore, Singapore
Copyright © 2023 Shen, Yang, Li and Yang. This is an open-access article distributed under the terms of the Creative Commons Attribution License (CC BY). The use, distribution or reproduction in other forums is permitted, provided the original author(s) and the copyright owner(s) are credited and that the original publication in this journal is cited, in accordance with accepted academic practice. No use, distribution or reproduction is permitted which does not comply with these terms.
*Correspondence: Guangbing Yang, eWdiMTQ3MjU4MjAyMUAxNjMuY29t