 Rongquan Zhang
 Gangqiang Li
 Siqi Bu
 Guowen Kuang
 Wei He
 Yuxiang Zhu3
 Saddam Aziz
- 1College of Transportation, Nanchang JiaoTong Institute, Nanchang, China
- 2Institute of Applied Artificial Intelligence of the Guangdong-Hong Kong-Macao Greater Bay Area, Shenzhen Polytechnic, Shenzhen, China
- 3Henan Provincial Key Laboratory of Smart Lighting, College of Computer and Artificial Intelligence, Huanghuai University, Zhumadian, China
- 4Department of Electrical Engineering, Hong Kong Polytechnic University, Kowloon, Hong Kong SAR, China
- 5School of Electrical and Information Engineering, Hunan Institute of Technology, Hengyang, China
The penetration of photovoltaic (PV) power into modern power systems brings enormous economic and environmental benefits due to its cleanness and inexhaustibility. Therefore, accurate PV power forecasting is a pressing and rigid demand to reduce the negative impact of its randomness and intermittency on modern power systems. In this paper, we explore the application of deep learning based hybrid technologies for ultra-short-term PV power forecasting consisting of a feature engineering module, a deep learning-based point prediction module, and an error correction module. The isolated forest based feature preprocessing module is used to detect the outliers in the original data. The non-pooling convolutional neural network (NPCNN), as the deep learning based point prediction module, is developed and trained using the processed data to identify non-linear features. The historical forecasting errors between the forecasting and actual PV data are further constructed and trained to correct the forecasting errors, by using an error correction module based on a hybrid of wavelet transform (WT) and k-nearest neighbor (KNN). In the simulations, the proposed method is extensively evaluated on actual PV data in Limburg, Belgium. Experimental results show that the proposed hybrid model is beneficial for improving the performance of PV power forecasting compared with the benchmark methods.
1 Introduction
Recently, photovoltaic (PV) power generation has been rapidly developed worldwide due to its cleanness and inexhaustibility (Al-Dahidi et al., 2019). However, the typical uncertainty and high volatility of PV power pose a big challenge to the stable operation and economic dispatch of the modern power system (Nguyen et al., 2020). Inevitably, the volatility of PV power directly aggravates the oscillatory instability of power system,thereby increasing the reserve capacity for the auxiliary service market (Bu et al., 2019). The uncertainty of PV power also increases the economic dispatch cost of the modern power system, which deviates from the principle for maximizing the welfare of market members (Singla et al., 2021). Facing these challenges, it is imperative to use advanced predictive models to mitigate these negative impacts of PV power generation access on the entire power system.
So far, much of the literature about PV power forecasting has been performed, which can fall into physical methods, statistical methods, machine learning methods, and hybrid methods (Wang et al., 2020b). Physical methods are based on numerical weather prediction and PV cell physical principles, which simulate the energy conversion process of PV power generation, usually including Hottel and ASHRAE (Mayer and Gróf, 2021). Although the physical methods do not require historical PV power data, but they rely on the accurate physical model and massive inputs, such as solar radiation intensity, battery temperature, battery angle, solar incident angle, aging, dust, inverter efficiency, etc (Perez et al., 2010; Inman et al., 2013). Since it is difficult for physical methods to obtain sufficient inputs and identify the principle of PV power generation, thus resulting in poor interference ability and computational complexity. Unlike the physical methods, statistical methods do not require the principle of PV power generation, and have the advantages of simple model, fast speed and convenience. The statistical methods aim to establish the mapping relationship between historical and predicted PV power time series data by using linear fitting, e.g., autoregressive moving average (ARMA) (Chang et al., 1984), regression analysis (Cleveland and Devlin, 1988), Spatio-temporal correlation (Pillow et al., 2008), and generalized autoregressive conditionally heteroskedastic (GARCH) (Chen et al., 2019). However, statistical models often rely on historical data and require strongly correlated features, making it difficult to fit strong fluctuations and high-dimensionality of PV power data.
Generally speaking, machine learning methods can be roughly divided into shallow learning and deep learning methods. Shallow learning methods are mainly designed into smaller network structures to extract nonlinear features by using error minimization principles and certain optimization algorithms. Due to their remarkable capacity in learning nonlinear features, shallow learning methods have been widely used in PV power generation forecasting compared to physical methods and statistical methods. Commonly-used shallow learning methods include decision tree (DT) (Massucco et al., 2019), k-nearest neighbor (KNN) (Peterson, 2009), multilayer perceptron (Kumar et al., 2019), back-propagation neural networks (BPNN) (Mellit et al., 2013), radial basis function neural network (RBFNN) (Madhiarasan, 2020), support vector regression (SVR) (De Giorgi et al., 2016), and extreme learning machine (ELM) (Bouzgou and Gueymard, 2017). In addition, ensemble learning, as a kind of shallow learning, has received extensive attention in recent years. Common ensemble learning includes extreme gradient boosting (XGBoost) (Li et al., 2022), ensemble trees (Alaraj et al., 2021), random forest (RF) (Kumar and Thenmozhi, 2006), LGBM (Wang Y et al., 2020), and CatBoost (Prokhorenkova et al., 2018). In(Li et al., 2022), the authors propose a prediction model of solar irradiance based on XGBoost. In (Alaraj et al., 2021), the ensemble trees based machine learning approach considering various meteorological parameters is proposed for PV power forecasting. However, with the development of big data technology and intelligence optimization theories in recent years, the drawback of shallow learning models will be prone to the curse of dimensionality and under-fitting, which makes it difficult to forecast PV power data in a big data era (Soares et al., 2016). Therefore, one more effective way is needed to address the drawback in shallow learning models.
Deep learning, one of the most promising artificial intelligence techniques, is easier to implement feature extraction tasks, has been successfully applied in different fields with powerful learning capabilities compared to shallow learning models (Bai et al., 2021; Xie et al., 2021). Common deep learning models usually include deep neural network (DNN) (Kuremoto et al., 2014), deep belief network (DBN) (Zhang et al., 2021), recurrent neural network (RNN) (Li et al., 2019), long short-term memory (LSTM) (Liu B. et al., 2020), and convolutional neural network (CNN) (Wang et al., 2017), etc. Experimental results in (Wang et al., 2017; Chang and Lu, 2018; Li et al., 2019) show that the forecasting accuracy of deep learning based models is superior to that of other shallow learning-based methods. However, PV power forecasting based on deep learning models is not always perfect, because it extremely depends on the selection of hyperparameters and network structure (Hajirahimi and Khashei, 2019a). Meanwhile, the improvement for model bias and variance in a given dataset can also be a challenging task, since the training results of deep learning may exhibit a small model bias, which often leads to more significant model variance (Geman et al., 1992). The deviation between the predicted and true values for the training model is known as model bias, and the generalization ability in the training unseen dataset is known as model variance. To solve these problems, hybrid methods focus on combining different methods to disassemble different prediction tasks from the main task for the improvement of both model bias and variance compared to deep learning models (de Oliveira et al., 2021).
Hybrid forecasting methods can generally be divided into three steps: point prediction, bias prediction, and combine forecast results. Different hybrid methods are widely used in many applications, such as traffic (Katris and Daskalaki, 2015), health (Chakraborty et al., 2019), finance (Hajirahimi and Khashei, 2019b), and electric energy system forecasting (Wu and Shahidehpour, 2010). For example, the authors in (de Mattos Neto et al., 2020) propose a hybrid method based on a nonlinear combination of the linear and nonlinear models for monthly wind speed forecasting, and use a data-driven intelligent model to find the appropriate combination method, aiming to maximize the forecasting performance. In (Wu et al., 2014), five types of shallow learning models to predict the short-time PV power data are developed as the first step using the historical PV power and NWP data, and genetic algorithms are used to determine their combinational models as the second step. Forecasting results reported in (Wu and Shahidehpour, 2010; Wu et al., 2014; de Mattos Neto et al., 2020) show the competitive performance of the hybrid methods is better than shallow learning models and statistical models. In these literatures, it is common to use statistical methods or shallow learning models as the first and second steps. To the authors’ knowledge, deep learning-based hybrid methods for PV power forecasting in previous studies have received little attention. As reported in (Zhang et al., 2020; de Oliveira et al., 2021), the model selection at each step of the hybrid forecasting method can have a large impact on forecasting performance. However, the deep learning model significantly improves the PV power prediction performance compared to other benchmark models. Thus, the deep learning-based hybrid forecasting PV power method that takes advantage of the methodological advantages at each step becomes more meaningful.
Therefore, a new deep-learning-based hybrid model is proposed for ultra-short-term PV power forecasting. Compared with existing literature on similar topics, the main contributions of this work are as follows:
• In order to accurately predict PV power and its practical application value, a hybrid model based on a feature engineering module, a deep learning-based point prediction module, and an error correction module are proposed for the first time.
• To exploit the maximum feature training potential of the point prediction module during feature training, a new feature engineering module based on isolation forest is proposed.
• In order to efficiently extract features and minimize the network structure, the non-pooling convolutional neural network (NPCNN) based point prediction module, is originally developed.
• The residuals between the predicted and actual PV power are initially trained by using an error correction module (ECM) based on wavelet transform (WT) and KNN, which helps to reduce the error of the point prediction module while considering time efficiency.
Our preliminary numerical results demonstrate that the proposed hybrid deep learning based forecasting model is beneficial to improve the prediction accuracy of PV power. The rest of this paper is organized as follows. In Section 2, we analysis the historical data of PV power and describe the proposed hybrid framework for PV power forecasting. Section 3 introduces each module of proposed method in detail, i.e., outlier detection in feature engineering, deep learning based point prediction model, WT+KNN for error correction. Experiment results are reported and discussed in Section 4, and we conclude this work in Section 5.
2 The proposed hybrid framework for PV power forecasting
2.1 Overview of the hybrid framework
The hybrid model proposed in this paper for PV power forecasting consists of a feature engineering module, a point prediction module and an error correction module. An overview of the proposed hybrid framework is described in Figure 1. It is worth noting that PV power forecasting methods can be divided into direct prediction and indirect prediction according to the input properties of the forecasting model (Wang et al., 2017). In the indirect prediction method, meteorological parameters such as solar radiation intensity, battery temperature, and wind speed are associated with the PV power forecasting model to improve its prediction accuracy. In the direct method, the input of the PV power prediction model is the historical power data. The proposed hybrid model for ultra-short-time in this paper is designed as a direct prediction method. There are three main reasons for this. 1) The external explanatory variables (meteorological parameters) for ultra-short-term PV power forecasting fluctuate less than short-term/long-term PV power forecasting, so meteorological parameters have less impact on ultra-short-term PV power forecasting. 2) Ultra-short-term PV power forecasting has high requirements for the real-time transmission of meteorological parameters, which may be difficult to obtain in time and high purchase cost in practical engineering applications. 3) Since the workload of feature selection is reduced, the PV power prediction model is made simpler and more convenient. In addition, to train the point prediction module and the error correction module, the raw PV power dataset is grouped into three parts: a training dataset, a validation dataset, and a testing dataset. First, feature engineering module is used to process invalid/bad data points in the raw PV power data, such as outliers or missing values. Then, the point prediction module uses the data processed by feature engineering module to further accurately predict the PV power points. Error results based on point prediction module are sent to the error correction module for error prediction. Finally, we reconstruct the forecasting results by combining the results of the point prediction module and error module. The proposed forecasting framework in this paper is inspired by conventional hybrid forecasting models (Wu and Shahidehpour, 2010; de Mattos Neto et al., 2020). Comparatively, the proposed hybrid framework for PV power forecasting has at least three advantages. The first is that the feature engineering module is considered for the proposed hybrid model to further exploit the potential of the feature mining of NPCNN. The second advantage is that NPCNN can effectively extract features of PV power data by reducing the non-pooling operations of CNN. The last advantage is that the WT is taken into account in the error correction module of the prediction framework to better capture the trend of prediction deviation. Next, we analyze and discuss the role of these modules in the proposed hybrid model in detail.

FIGURE 1. The proposed hybrid framework for PV power forecasting.
2.2 Feature engineering module
Feature engineering aims to construct valuable training samples to maximize the potential of feature extraction and facilitate the training of point prediction modules. In general, raw PV power datasets may have invalid/bad data points due to PV power generation equipment failures or communication delays. It is necessary to deal with these outliers to reduce the overfitting of the feature training model to these values (Wang et al., 2020a). Figure 2 plots the real-time measured PV power for a historical day, wherein the black dots represent the raw PV power data, and the red line represents the corrected PV power curve. It is obvious that there are some missing values and outlier values in the raw PV power compared to the corrected curve. Moreover, if these bad power points cannot be eliminated, the training of the point prediction module suffers from data jumps and irregularities, leading to performance degradation (Wang et al., 2020a). Therefore, the raw PV generation data must be pre-processed by the feature learning module to better achieve the potential of the point prediction module. In this paper, the feature engineering module, based on IF and linear interpolation, is used to detect these outliers and fill missing values, respectively. In addition, we perform normalization on the raw PV power data to ensure parameter optimization of the point prediction module, as neural network training requires a suitable format for feature learning.
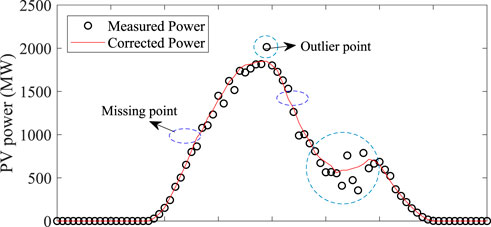
FIGURE 2. The real-time measured PV power.
2.3 Point prediction module
The PV power forecasting based on point prediction module is shown in Figure 3. The input window of the point prediction module moves smoothly over the PV power sequence with time t, e.g., the inputs is {xt−3, xt−2, xt−1, xt}, which corresponds to the predicted output
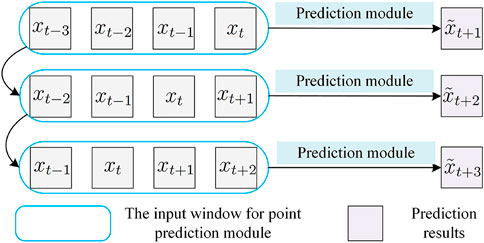
FIGURE 3. PV power forecasting based on point prediction module.
2.4 Error correction module
Although different advanced forecasting methods have been proposed to reduce the model bias, they always exist more significant model variance (Geman et al., 1992). To address this issue, an error correction module based on WT and KNN is proposed in this paper to reduce the model variance of the point prediction module. Here, WT is used to decompose the raw forecasting error series into sub-frequency sequences with better contours, while KNN is used to extract the features of each frequency sequence. There are two main reasons for this: First, since the original prediction error sequence may contain nonlinear and spiky dynamic features, WT-based signal decomposition can be used to reduce their impact on the prediction performance. Each sub-frequency sequence needs to be trained by an error correction method, and KNN can quickly extract the nonlinear features of each sub-frequency sequence while losing as little prediction as possible (Saâdaoui and Rabbouch, 2019). Meanwhile, the inputs of the error correction module (ECM) should also be considered with the validation dataset errors, except for correlated features obtained from the point prediction module, as shown in Figure 1.
3 Description of the deep learning based hybrid model
3.1 Outlier detection in feature engineering
Isolation forest (IF) in (Liu et al., 2008; Ahmed et al., 2019) is an efficient unsupervised anomaly detection algorithm. Compared with traditional anomaly detection methods, such as the mean-square error method and quartile method, IF provides an abnormal probability for each sample instead of judging the exception directly. IF can be divided into five processes: 1) Several features randomly from the training dataset are selected as the feature space; 2) A value is randomly selected in the feature space as the each node of the tree; 3) Different trees are combined as the isolated forest; 4) The distance between the root and leaf node of each tree are calculated as its score; 5) If the score is low, it is an outlier. The score-based IF can be expressed as below,
where E(h(x)) denotes the average length of sample x from a set of isolation trees. c(n) represents the average path length with n samples obtained from a binary search tree, as below,
where H(i) = ln(i) + 0.5772156649(Euler′s constant), which is the harmonic function. Once the scores for each sample x are solved, lower values (outliers) can manually be excluded based on the abnormal proportional coefficient ξ.
3.2 Deep learning based point prediction model
Considering that the features of time-series historical PV power data are highly uncorrelated, we proposes a two-dimensional (2D) NPCNN (no pooling layer) model as a point prediction module for PV power prediction. In this paper, the NPCNN model consists of one input layer, two conventional layers, one fully connected layer, and one output layer, as presented in Figure 4. Each layer are summarized as follows:
• Input layer provides the input parameters of NPCNN. The historical PV power data and time attributes are combined to generate a one-dimensional time series vector, which is transformed into a two-dimensional correlation feature matrix through correlation analysis and dimensional transformation (Zhang et al., 2020).
• Convolutional layer contains several convolution kernels to generate new feature maps, which convolves the network weight with the receptive field of the feature map of the previous layer, and uses the activation function to form the feature map of the next convolutional layer (Yamashita et al., 2018).
• Fully connected layer is often used for high-level inference, which maps the features processed by the convolution layers to the output layer (Desai and Makwana, 2021).
• Output layer is the final outputs of the NPCNN.
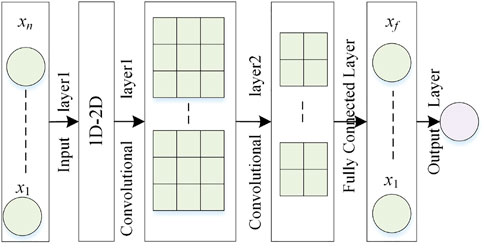
FIGURE 4. The structure of NPCNN.
The network parameters of NPCNN, such as weights and biases, are trained and optimized in mini-batch form using the gradient descent method based on the backpropagation algorithm to improve the forecasting performance of PV power. Meanwhile, the root-mean-square-propagation method (RMSProp) is introduced to optimize the error function of NPCNN due to its faster convergence and high accuracy (Zhang et al., 2020). Here, the mean squared error between the predicted value and the actual value is used as the loss function Loss, as follows,
where M and D denote the mini-batch size and the output vector size for a training sample.
3.3 WT+KNN for error correction
The raw PV power forecast error data may contain peak characteristics and nonlinearities in the form of fluctuations, which can affect the PV power forecast accuracy. Both high-frequency and low-frequency signals are included in PV forecast error data (Ahmed et al., 2019). The former is due to changes in the uncertainty of the input data, and the latter is due to model over-fitting. The WT can be used to decompose the behavior of these frequencies for prediction. Therefore, the raw forecast error series based on wavelet decomposition can be described as follows,
where p and q are a scaling variable and a translation variable, respectively. g(t) denotes the signal decomposed by the wavelet. Daubechies function is used as the mother wavelet function ϕ(⋅) in this paper.
After the prediction error sequence is decomposed by WT, the KNN algorithm is designed to quickly extract forecast error features of different frequencies due to the ability to solve fast predictions. Each frequency error prediction based on KNN can be divided into three steps: 1) Euclidean distance is used to measure the similarity of all features in the validation and test dataset in the forecasting error sequence for each frequency; 2) Choose the k value based on the prediction error of the validation dataset; 3) A moving average value is performed by combining the k-nearest Euclidean distance values of the training and test sets.
3.4 Data normalization and performance criterion
In the feature learning process, due to the different dimensions of the collected data, the non-standardized features may affect the parameter optimization of the model. Therefore, data normalization is required to be performed out on these features, as follows,
where xt is the original PV power data, and xmax and xmin are the maximum and minimum values of the PV power data.
Three metrics, including mean absolute percentage error (MAPE), mean absolute error (MAE), and root mean square error (RMSE), are typically employed to evaluate the performance of forecasting models (Wang et al., 2017), as follows,
wherein T is the number of the predicted value, rt is the real value at the moment of t, and pt is the predicted value at the moment of t. It is worth noting that the forecasting model has higher accuracy when MAE, RMSE, and MAPE are smaller.
3.5 Main prediction steps of the proposed hybrid model
Due to the chaotic nature of the weather system, PV power data always exhibits volatility, variability and randomness. These characteristics will affect the prediction accuracy of PV power, which is greatly detrimental to the economic optimization and stable operation of the modern power system. Therefore, in order to mitigate the impact of these characteristics on prediction accuracy, this paper presents a new hybrid model for ultra-short-term PV power forecasting consisting of a feature engineering module, a deep learning-based point prediction module, and an error correction module. The main steps of the proposed hybrid model are presented as follows: 1) Historical PV power data are collected and divided into training datasets, validation datasets and test datasets according to different seasons. 2) IF method are applied to detect outliers in training and testing datasets. Then, these outliers are removed from the corresponding datasets, and these vacancies are filled by applying linear interpolation. 3) Convert all data to values between 0 and 1 using the data normalization method. 4) The loss function of NPCNN is constructed, and the model parameters are trained using the training dataset and the RMSProp back-propagation method. 5) The NPCNN error results of the validation set are sent to the error correction module, and these errors are decomposed into high and low frequency signals through wavelet transform, while the error trend of each signal is quickly learned using KNN. 6) The error correction prediction results are obtained by wavelet reconstruction, and its results are combined with the prediction results of the NPCNN model to obtain the final PV power prediction data. 7) Calculate the prediction metrics of the proposed hybrid model using the prediction results from the test datasets. The main steps of the proposed hybrid model for PV power forecasting are graphically presented in Figure 1.
4 Numerical results and analysis
4.1 Experimental settings
The proposed PV power prediction model based on IF, NPCNN and ECM is evaluated using historical PV power data from Limburg, Belgium. This data range from June 2019 to May 2021 at a resolution of 15 min, and can be freely obtained from the website (Elia, 2021). The PV power data is divided into a training dataset, a validation dataset, and a testing dataset, and each dataset corresponds to four parts: spring, summer, fall and winter, because the solar irradiance and the physical information of PV cell power generation vary greatly in different seasons (Wang et al., 2020a). For these data sets, the monitored capacity is 4037.14 MW, and the minimum output power is 0 MW. The NPCNN forecasting model using the training dataset is well-trained to extract the nonlinear features, and the error correction model using the validation dataset is well-trained to reduce the forecasting error between predicted and actual PV power data. The testing dataset is adopted to evaluate the forecasting performance of the PV power prediction model. In addition, CatBoost (Prokhorenkova et al., 2018), KNN (Peterson, 2009), DT (Massucco et al., 2019), SVR (De Giorgi et al., 2016), XGBoost (Zheng et al., 2017), and LGBM (Wang Y et al., 2020) are used as the benchmark methods, which are simulated on the Python platform.
4.2 IF based outlier detection
In order to verify the feasibility and effectiveness of IF based anomaly detection in feature engineering module, we evaluate the impact of IF on the forecasting performance of the proposed model. IF based outlier detection method is executed and analyzed using the testing dataset of 15-min ahead forecasting scenario. Three comparison algorithms, namely mean square error method (MSE), the interquartile range method (IQR), and K-means clustering method (K-means), are considered to verify the validity of outlier detection based on IF. For a fair comparison, other prediction procedures are consistent with the proposed model except for the IF based outlier detection method. The 15-min-ahead MAPE results of IF based anomaly detection method under different outlier ratios are shown in Figure 5. The mark points on the line in Figure 5 indicate the minimum values in the MAPE results with various outlier ratios in different seasons. It can be seen from Figure 5 that the optimal predicted performance in the four different seasons corresponds to the optimal anomaly ratios at 0.04, 0.03, 0.03, and 0.14, respectively. The optimal anomaly ratios in four seasons are all greater than 0, which means that IF is effective for improving forecast accuracy in different seasons. In addition, the outlier ratio corresponding to the smallest MAPE values in summer and autumn is smaller than in spring and winter. This is because the fluctuation of solar irradiance in summer and autumn is stronger than that in winter and spring, the original features during model training need to be preserved to reduce under-fitting.
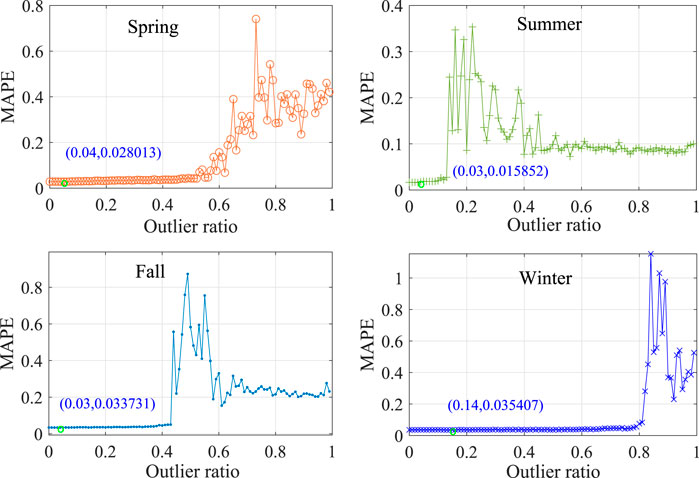
FIGURE 5. The MAPE results of IF in different outlier ratios.
In Figure 6, we present the MAPE statistical results of different outlier detection methods in different seasons. For IF method, the MAPE values in the four seasons are 0.028, 0.0159, 0.0337, and 0.0354, respectively, with an average of 0.0452. Compared with the MSE, IQR, and K-means methods, the average MAPE results of IF are reduced by 2.84, 2.50, and 1.40%, respectively. From these results, IF method exhibits high forecasting capability in different seasons compared with the three benchmarks. This is because IF without making any prior assumptions can efficiently process high-dimensional continuous data.
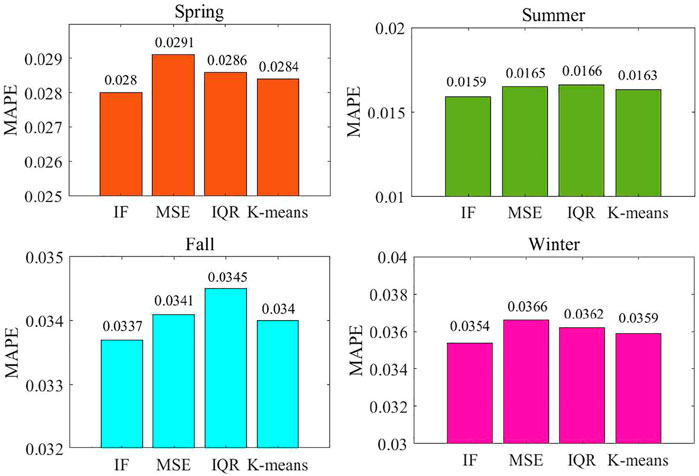
FIGURE 6. The MAPE results for different outlier detection methods.
4.3 ECM based post-prediction correction
To further illustrate the advantages of ECM, we evaluate the impact of ECM-based prediction post-correction on forecasting performance. The proposed model with/without ECM is also executed and analyzed using the testing dataset of 15-min ahead forecasting scenario. The MAPE results in different seasons are statistically presented in Table 1. It can be seen that the MAPE results of the proposed model with ECM in spring vary from a minimum value of 0.0172 to a maximum of 0.0414 with an average of 0.0280 and a variance of 7.63E−5. While, the MAPE results of the proposed model without ECM in spring vary from a minimum value of 0.0172 to a maximum of 0.0512 with an average of 0.0304 and a variance of 1.39E−4. Compared to the benchmark method without ECM, the mean and variance of the MAPE results for the proposed model in spring have been reduced by 8.5 and 81.6%, respectively. Similarly, compared with the benchmark method without ECM, the mean of the MAPE results for the proposed model in the other three seasons have been reduced by 19.2, 5.0, and 4.6%, respectively. The variance of the MAPE results for the proposed model in the other three seasons have been reduced by 30.2, 9.2, and 24.0%, respectively. Apparently, these statistical results demonstrate that the proposed model with ECM in various seasons shows better forecasting performance and more stability.
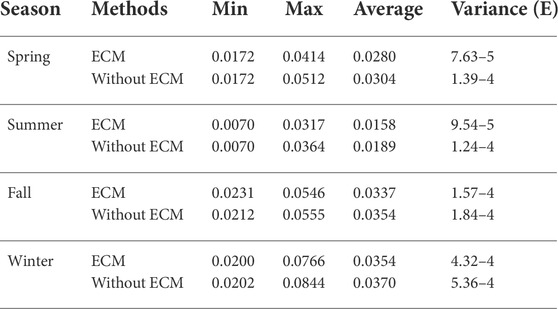
TABLE 1. Statistical results of daily MAPE result for the effect of ECM in various seasons.
4.4 15-minutes ahead prediction performance
Then, the 15-min ahead forecast results for different seasons are graphically displayed to demonstrate the forecasting capability of the proposed model. To comprehensively test the forecasting performance of the proposed model based on IF, NPCNN and ECM, CatBoost, SVR, DT, KNN, LGBM and XGBoost are selected as benchmark methods for performance comparison. Figures 7–10 shows the forecasting results of the six benchmarks and the proposed model in different seasons. In Figures 7–10, the predicted power of the proposed model and actual power curves are red and black lines, respectively, and the predicted power curves of other benchmarks are dashed lines. It can be seen that the power curves have obvious seasonal variation, which is mainly caused by ambient air temperature and solar radiation. Figure 8 has a higher PV power, and the curve will be relatively smoother compared with Figure 10. Likewise, the PV power curves in Figure 7 and Figure 9 also show better characteristics than those in Figure 10 (Winter). From Figures 7–10, the proposed model has strong prediction capabilities and outperforms other benchmarks, and its predicted value is basically consistent with actual PV power. Furthermore, CatBoost, LGBM, and XGBoost perform better than SVR, DT, and KNN models because the ensemble learning network is easier to handle nonlinear relationships than commonly-used shallow learning models.

FIGURE 7. 15-minutes-ahead forecasting results in spring.

FIGURE 8. 15-minutes-ahead forecasting results in summer.

FIGURE 9. 15-minutes-ahead forecasting results in fall.

FIGURE 10. 15-minutes-ahead forecasting results in winter.
Table 2 shows the MAE, RMSE, and MAPE metrics in 15-min ahead. It can be seen from Table 2 that the MAPE value of the proposed model varies from 0.0158 to 0.0337, with an average of 0.0282. While the average MAPE values of other six benchmarks are 0.0371, 0.2535, 0.0493, 0.0794, 0.0435, and 0.0402, respectively. Compared with CatBoost, SVR, DT, KNN, LGBM, and XGBoost, the average MAPE value of the proposed model is decreased by 0.009, 0.226, 0.021, 0.051, 0.015, and 0.012, respectively. Similarly, compared with CatBoost, SVR, DT, KNN, LGBM, and XGBoost, the average MAE value of the proposed model is reduced by 5.62, 57.58, 9.48, 42.29, 12.05, and 5.39, respectively. And compared with CatBoost, SVR, DT, KNN, LGBM, and XGBoost, the average RMSE value of the proposed model is reduced by 9.40, 94.47, 16.60, 69.67, 18.86, and 8.79, respectively. Apparently, these results show that the results of the proposed model perform best in terms of the MAPE, MAE, and RMSE, followed by XGBoost, CatBoost, LGBM, DT, KNN, and SVR. This means that the predicted value of the proposed model is closer to the actual value than other comparative models. The reason may be that the proposed model, apart from outlier detection and error correction methods, uses NPCNN to identify changing trends and non-linear relationship of PV data. The poor performance of the SVR model is mainly caused by the abnormal distribution of the kernel and worsened by the low feature extraction ability. Therefore, we can conclude from these analysis results that the proposed model has the best forecasting performance on 15-min ahead forecasting tasks in different seasons.
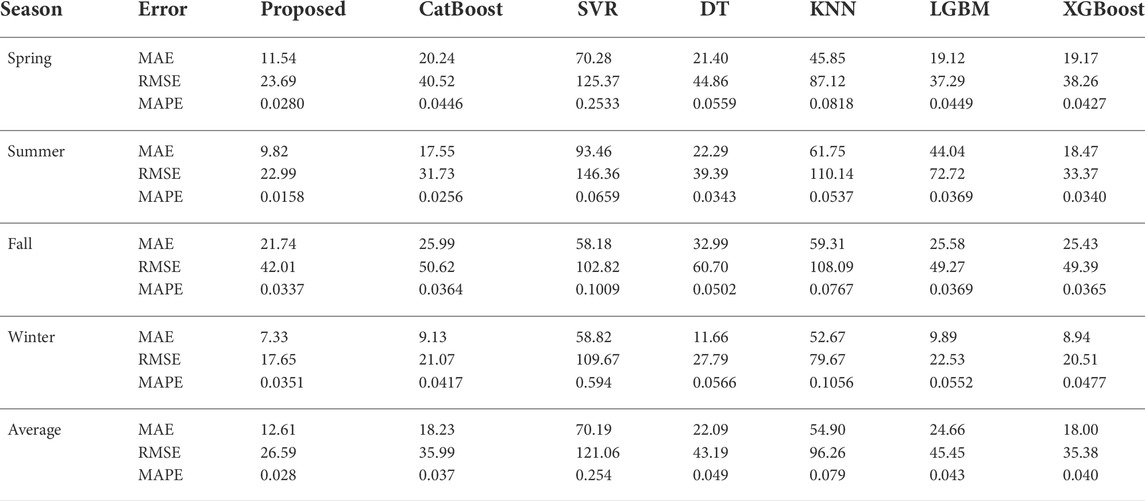
TABLE 2. The seasonal 15-min ahead forecasting results for various contrast models.
4.5 Multi-step ahead prediction performance
Furthermore, to fully verify the comprehensive prediction performance of the proposed model, simulation experiments are performed under different forecasting horizons in summer. The forecasting horizons range from 30 min ahead to 2 h ahead with 15-min intervals. The training/validation/test dataset in each forecasting horizons is acquired by time interval sampling of the original PV power data series. The average MAE, RMSE, and MAPE results over different forecasting horizons in summer are presented in Figures 11–13, respectively. It can be seen that the MAE, RMSE and MAPE indexes of the proposed model usually increase with the longer prediction horizon. This is because the lower feature correlation reduced by the longer forecasting horizon will increase the uncertainty of PV power forecasting. Obviously, at all prediction horizons, the proposed model has the smallest MAE, RMSE, and MAPE metrics, which outperforms other benchmarks and can provide excellent forecasting performance. From these results, the proposed model has more stable and robust performance compared to the benchmark methods. It is appropriate to conclude that the proposed hybrid model exhibits good generalization properties for PV power forecasting.
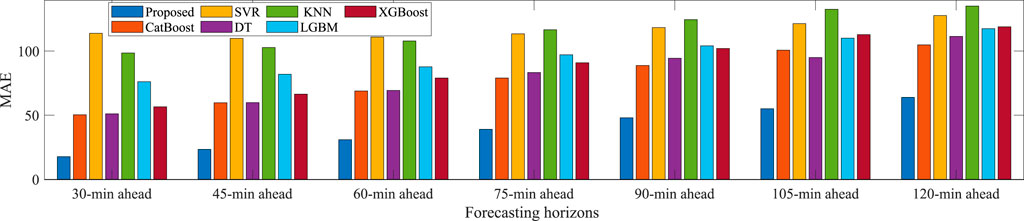
FIGURE 11. The MAE statistics for different forecasting horizons in summer.
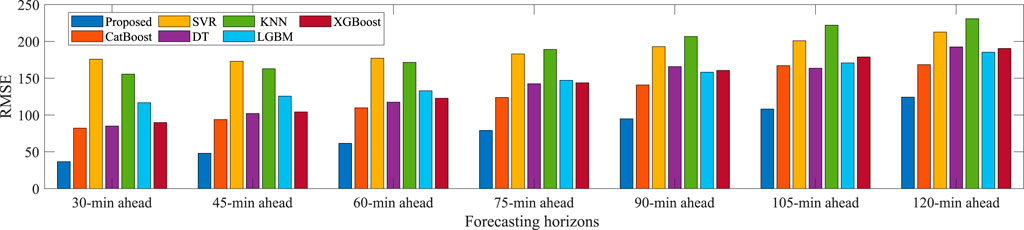
FIGURE 12. The RMSE statistics for different forecasting horizons in summer.
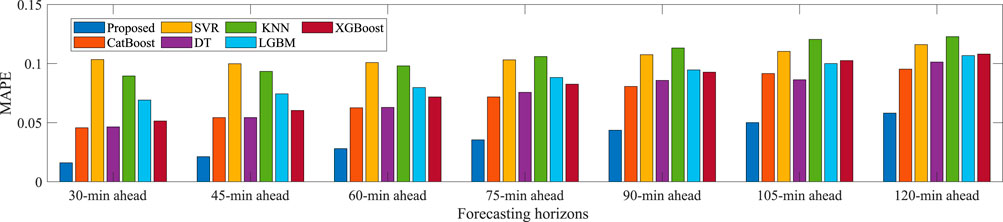
FIGURE 13. The MAPE statistics for different forecasting horizons in summer.
5 Conclusion
In this paper, a new hybrid model based on a feature engineering module, a point prediction module, and an error correction module is firstly proposed for the ultra-short-term PV power forecasting. In the proposed model, IF is used to detect outliers for PV power data, NPCNN is used to extract the nonlinear features of processed PV power data, and WT+KNN is used to reduce the model variance. The proposed hybrid model has been verified on actual PV power data from the PV plant in Limberg. It has been demonstrated in the case studies that the IF-based anomaly detection and ECM-based post-prediction correction methods are significantly helpful in practical PV power forecasting. Moreover, the proposed hybrid model has been compared with six benchmark methods based on CatBoost, KNN, DT, SVR, XGBoost, and LGBM in different seasons and forecasting horizons. Experimental results have also proved that the proposed model has a more stable and excellent performance than the benchmark methods. Therefore, the proposed hybrid model for PV power forecasting has a high potential for future application in electric energy systems.
Data availability statement
The original contributions presented in the study are included in the article/Supplementary Material, further inquiries can be directed to the corresponding author.
Author contributions
Conceptualization, RZ, GL, and SB; methodology and formal analysis, RZ and GL; software, simulation and validation, RZ; writing–original draft preparation, RZ, GL, and WH; writing–review and editing, GK, WH, YZ, SA, and SB; visualization, GL and SB; funding acquisition, GL, GK, WH, YZ, and SB. All authors have read and agreed to the published version of the manuscript.
Funding
This work was supported in part by the Scientific Research Startup Fund for Shenzhen High-Caliber Personnel of SZPT, No.6021310030K, in part by the National Science Foundation of China under Grants 61973177, in part by the Natural Science Foundation of Henan Province of China under Grant 212102210516 and 222102210279, and in part by the Natural Science Foundation of Hunan Province under Grant 2021JJ50082.
Conflict of interest
The authors declare that the research was conducted in the absence of any commercial or financial relationships that could be construed as a potential conflict of interest.
Publisher’s note
All claims expressed in this article are solely those of the authors and do not necessarily represent those of their affiliated organizations, or those of the publisher, the editors and the reviewers. Any product that may be evaluated in this article, or claim that may be made by its manufacturer, is not guaranteed or endorsed by the publisher.
References
Ahmed, S., Lee, Y., Hyun, S.-H., and Koo, I. (2019). Unsupervised machine learning-based detection of covert data integrity assault in smart grid networks utilizing isolation forest. IEEE Trans. Inform. Forensic Secur. 14, 2765–2777. doi:10.1109/tifs.2019.2902822
Alaraj, M., Kumar, A., Alsaidan, I., Rizwan, M., and Jamil, M. (2021). Energy production forecasting from solar photovoltaic plants based on meteorological parameters for qassim region, Saudi Arabia. IEEE Access 9, 83241–83251. doi:10.1109/ACCESS.2021.3087345
Al-Dahidi, S., Ayadi, O., Adeeb, J., and Louzazni, M. (2019). Assessment of artificial neural networks learning algorithms and training datasets for solar photovoltaic power production prediction. Front. Energy Res. 7, 130. doi:10.3389/fenrg.2019.00130
Bai, X., Wang, X., Liu, X., Liu, Q., Song, J., Sebe, N., et al. (2021). Explainable deep learning for efficient and robust pattern recognition: a survey of recent developments. Pattern Recognit. 120, 108102. doi:10.1016/j.patcog.2021.108102
Bouzgou, H., and Gueymard, C. A. (2017). Minimum redundancy - maximum relevance with extreme learning machines for global solar radiation forecasting: toward an optimized dimensionality reduction for solar time series. Sol. Energy 158, 595–609. doi:10.1016/j.solener.2017.10.035
Bu, S., Wen, J., and Li, F. (2019). A generic framework for analytical probabilistic assessment of frequency stability in modern power system operational planning. IEEE Trans. Power Syst. 34, 3973–3976. doi:10.1109/TPWRS.2019.2924149
Chakraborty, T., Chattopadhyay, S., and Ghosh, I. (2019). Forecasting dengue epidemics using a hybrid methodology. Phys. A Stat. Mech. Appl. 527, 121266. doi:10.1016/j.physa.2019.121266
Chang, G. W., and Lu, H.-J. (2018). Integrating gray data preprocessor and deep belief network for day-ahead pv power output forecast. IEEE Trans. Sustain. Energy 11, 185–194. doi:10.1109/TSTE.2018.2888548
Chang, T. J., Kavvas, M. L., and Delleur, J. W. (1984). Modeling of sequences of wet and dry days by binary discrete autoregressive moving average processes. J. Clim. Appl. Meteor. 23, 1367–1378. doi:10.1175/1520-0450(1984)023<1367:mosowa>2.0.co;2
Chen, H., Zhang, J., Tao, Y., and Tan, F. (2019). Asymmetric garch type models for asymmetric volatility characteristics analysis and wind power forecasting. Prot. Control Mod. Power Syst. 4, 1–11. doi:10.1186/s41601-019-0146-0
Cleveland, W. S., and Devlin, S. J. (1988). Locally weighted regression: an approach to regression analysis by local fitting. J. Am. Stat. Assoc. 83, 596–610. doi:10.1080/01621459.1988.10478639
De Giorgi, M. G., Malvoni, M., and Congedo, P. M. (2016). Comparison of strategies for multi-step ahead photovoltaic power forecasting models based on hybrid group method of data handling networks and least square support vector machine. Energy 107, 360–373. doi:10.1016/j.energy.2016.04.020
de Mattos Neto, P. S. G., de Oliveira, J. F. L., de Oliveira Santos Junior, D. S., Siqueira, H. V., Da Nobrega Marinho, M. H., and Madeiro, F. (2020). A hybrid nonlinear combination system for monthly wind speed forecasting. IEEE Access 8, 191365–191377. doi:10.1109/access.2020.3032070
de Oliveira, J. F., Silva, E. G., and de Mattos Neto, P. S. (2021). A hybrid system based on dynamic selection for time series forecasting. IEEE Trans. Neural Netw. Learn. Syst. 1–13. doi:10.1109/TNNLS.2021.3051384
Desai, J., and Makwana, V. (2021). A novel out of step relaying algorithm based on wavelet transform and a deep learning machine model. Prot. Control Mod. Power Syst. 6, 1–12. doi:10.1186/s41601-021-00221-y
Elia (2021). Solar power generation. [Dataset]. Available at: https://www.elia.be/en/grid-data/power-generation/solar-pv-power-generation-data (Accessed December 31, 2021).
Geman, S., Bienenstock, E., and Doursat, R. (1992). Neural networks and the bias/variance dilemma. Neural Comput. 4, 1–58. doi:10.1162/neco.1992.4.1.1
Hajirahimi, Z., and Khashei, M. (2019a). Hybrid structures in time series modeling and forecasting: a review. Eng. Appl. Artif. Intell. 86, 83–106. doi:10.1016/j.engappai.2019.08.018
Hajirahimi, Z., and Khashei, M. (2019b). Weighted sequential hybrid approaches for time series forecasting. Phys. A Stat. Mech. Appl. 531, 121717. doi:10.1016/j.physa.2019.121717
Inman, R. H., Pedro, H. T. C., and Coimbra, C. F. M. (2013). Solar forecasting methods for renewable energy integration. Prog. Energy Combust. Sci. 39, 535–576. doi:10.1016/j.pecs.2013.06.002
Katris, C., and Daskalaki, S. (2015). Comparing forecasting approaches for internet traffic. Expert Syst. Appl. 42, 8172–8183. doi:10.1016/j.eswa.2015.06.029
Kumar, M., and Thenmozhi, M. (2006). “Forecasting stock index movement: A comparison of support vector machines and random forest,” in Indian Institute of Capital Markets 9th Capital Markets Conference Paper.
Kumar, A., Rizwan, M., and Nangia, U. (2019). A hybrid intelligent approach for solar photovoltaic power forecasting: impact of aerosol data. Arab. J. Sci. Eng. 45, 1715–1732. doi:10.1007/s13369-019-04183-0
Kuremoto, T., Kimura, S., Kobayashi, K., and Obayashi, M. (2014). Time series forecasting using a deep belief network with restricted Boltzmann machines. Neurocomputing 137, 47–56. doi:10.1016/j.neucom.2013.03.047
Li, G., Wang, H., Zhang, S., Xin, J., and Liu, H. (2019). Recurrent neural networks based photovoltaic power forecasting approach. Energies 12, 2538. doi:10.3390/en12132538
Li, X., Ma, L., Chen, P., Xu, H., Xing, Q., Yan, J., et al. (2022). Probabilistic solar irradiance forecasting based on xgboost. Energy Rep. 8, 1087–1095. doi:10.1016/j.egyr.2022.02.251
Liu, F. T., Ting, K. M., and Zhou, Z.-H. (2008). “Isolation forest,” in 2008 Eighth IEEE International Conference on Data Mining, Pisa, Italy, December 15–19, 2008. (IEEE), 413–422. doi:10.1109/icdm.2008.17
Liu, B., Chen, J., Wang, H., and Wang, Q. (2020a). Renewable energy and material supply risks: a predictive analysis based on an lstm model. Front. Energy Res. 8, 163. doi:10.3389/fenrg.2020.00163
Liu, S., Ji, H., and Wang, M. C. (2020b). Nonpooling convolutional neural network forecasting for seasonal time series with trends. IEEE Trans. Neural Netw. Learn. Syst. 31, 2879–2888. doi:10.1109/TNNLS.2019.2934110
Madhiarasan, M. (2020). Accurate prediction of different forecast horizons wind speed using a recursive radial basis function neural network. Prot. Control Mod. Power Syst. 5, 1–9. doi:10.1186/s41601-020-00166-8
Massucco, S., Mosaico, G., Saviozzi, M., and Silvestro, F. (2019). A hybrid technique for day-ahead pv generation forecasting using clear-sky models or ensemble of artificial neural networks according to a decision tree approach. Energies 12, 1298. doi:10.3390/en12071298
Mayer, M. J., and Gróf, G. (2021). Extensive comparison of physical models for photovoltaic power forecasting. Appl. Energy 283, 116239. doi:10.1016/j.apenergy.2020.116239
Mellit, A., Sağlam, S., and Kalogirou, S. A. (2013). Artificial neural network-based model for estimating the produced power of a photovoltaic module. Renew. Energy 60, 71–78. doi:10.1016/j.renene.2013.04.011
Nguyen, B. N., Nguyen, V. T., Duong, M. Q., Le, K. H., Nguyen, H. H., and Doan, A. T. (2020). Propose a mppt algorithm based on thevenin equivalent circuit for improving photovoltaic system operation. Front. Energy Res. 8, 14. doi:10.3389/fenrg.2020.00014
Perez, R., Kivalov, S., Schlemmer, J., Hemker, K., Renné, D., and Hoff, T. E. (2010). Validation of short and medium term operational solar radiation forecasts in the US. Sol. Energy 84, 2161–2172. doi:10.1016/j.solener.2010.08.014
Pillow, J. W., Shlens, J., Paninski, L., Sher, A., Litke, A. M., Chichilnisky, E. J., et al. (2008). Spatio-temporal correlations and visual signalling in a complete neuronal population. Nature 454, 995–999. doi:10.1038/nature07140
Prokhorenkova, L. O., Gusev, G., Vorobev, A., Dorogush, A. V., and Gulin, A. (2018). “Catboost: unbiased boosting with categorical features,” in Advances in Neural Information Processing Systems, NeurIPS 2018, Montréal, Canada, December 3-8, 2018, 6639–6649.
Saâdaoui, F., and Rabbouch, H. (2019). A wavelet-based hybrid neural network for short-term electricity prices forecasting. Artif. Intell. Rev. 52, 649–669. doi:10.1007/s10462-019-09702-x
Singla, P., Duhan, M., and Saroha, S. (2021). A comprehensive review and analysis of solar forecasting techniques. Front. Energy 16, 1–37. doi:10.1007/s11708-021-0722-7
Soares, J., Borges, N., Fotouhi Ghazvini, M. A., Vale, Z., and de Moura Oliveira, P. B. (2016). Scenario generation for electric vehicles' uncertain behavior in a smart city environment. Energy 111, 664–675. doi:10.1016/j.energy.2016.06.011
Wang, H., Yi, H., Peng, J., Wang, G., Liu, Y., Jiang, H., et al. (2017). Deterministic and probabilistic forecasting of photovoltaic power based on deep convolutional neural network. Energy Convers. Manag. 153, 409–422. doi:10.1016/j.enconman.2017.10.008
Wang, H., Cai, R., Zhou, B., Aziz, S., Qin, B., Voropai, N., et al. (2020a). Solar irradiance forecasting based on direct explainable neural network. Energy Convers. Manag. 226, 113487. doi:10.1016/j.enconman.2020.113487
Wang, H., Liu, Y., Zhou, B., Li, C., Cao, G., Voropai, N., et al. (2020b). Taxonomy research of artificial intelligence for deterministic solar power forecasting. Energy Convers. Manag. 214, 112909. doi:10.1016/j.enconman.2020.112909
Wang Y, Y., Chen, J., Chen, X., Zeng, X., Kong, Y., Sun, S., et al. (2020). Short-term load forecasting for industrial customers based on tcn-lightgbm. IEEE Trans. Power Syst. 36, 1984–1997. doi:10.1109/TPWRS.2020.3028133
Wu, L., and Shahidehpour, M. (2010). A hybrid model for day-ahead price forecasting. IEEE Trans. Power Syst. 25, 1519–1530. doi:10.1109/tpwrs.2009.2039948
Wu, Y.-K., Chen, C.-R., and Abdul Rahman, H. (2014). A novel hybrid model for short-term forecasting in pv power generation. Int. J. Photoenergy 2014, 569249. doi:10.1155/2014/569249
Xie, H., Qin, Z., Li, G. Y., and Juang, B.-H. (2021). Deep learning enabled semantic communication systems. IEEE Trans. Signal Process. 69, 2663–2675. doi:10.1109/tsp.2021.3071210
Yamashita, R., Nishio, M., Do, R. K. G., and Togashi, K. (2018). Convolutional neural networks: an overview and application in radiology. Insights Imaging 9, 611–629. doi:10.1007/s13244-018-0639-9
Zhang, R., Li, G., and Ma, Z. (2020). A deep learning based hybrid framework for day-ahead electricity price forecasting. IEEE Access 8, 143423–143436. doi:10.1109/access.2020.3014241
Zhang, R., Aziz, S., Farooq, M. U., Hasan, K. N., Mohammed, N., Ahmad, S., et al. (2021). A wind energy supplier bidding strategy using combined ega-inspired hpsoifa optimizer and deep learning predictor. Energies 14, 3059. doi:10.3390/en14113059
Keywords: photovoltaic (PV) power, deep learning, non-pooling convolutional neural network (NPCNN), error correction, photovoltaic power forecasting
Citation: Zhang R, Li G, Bu S, Kuang G, He W, Zhu Y and Aziz S (2022) A hybrid deep learning model with error correction for photovoltaic power forecasting. Front. Energy Res. 10:948308. doi: 10.3389/fenrg.2022.948308
Received: 19 May 2022; Accepted: 27 June 2022;
Published: 09 August 2022.
Edited by:
Hao Yu, Tianjin University, ChinaReviewed by:
Astitva Kumar, Delhi Technological University, IndiaLv Chaoxian, China University of Mining and Technology, China
Copyright © 2022 Zhang, Li, Bu, Kuang, He, Zhu and Aziz. This is an open-access article distributed under the terms of the Creative Commons Attribution License (CC BY). The use, distribution or reproduction in other forums is permitted, provided the original author(s) and the copyright owner(s) are credited and that the original publication in this journal is cited, in accordance with accepted academic practice. No use, distribution or reproduction is permitted which does not comply with these terms.
*Correspondence: Guowen Kuang, Z2t1YW5nQHN6cHQuZWR1LmNu