 Zhongqi Cai1Kun Yang1Yong Chen1Ruixiong Yang1Yanxun Gu1
 Yu Zeng2*Xi Zhang2Sashuang Sun2Sirong Pan2
 Youbo Liu2Junyong Liu2
- 1Zhuhai Power Supply Bureau of Guangdong Power Grid, Zhuhai, China
- 2College of Electrical Engineering, Sichuan University, Chengdu, China
The large-scale integration of renewable energy sources (RESs) and the rapid development of loads cause frequent transmission congestion in the urban power grid (UPG). Transmission system operators usually perform the high-voltage distribution network (HVDN) reconfiguration to mitigate the transmission congestion. However, as the loads and RESs change rapidly, the HVDN reconfiguration might be conducted frequently. This might cause severe security problem. An energy storage system (ESS) provides an effective way of alleviating the transmission congestion. If the ESS is installed and operated elaborately, the transmission congestion of UPG can be mitigated with a little HVDN reconfiguration. Hence, this study proposes a multistage bilevel planning model for the optimal allocation of ESS. The upper-level model aims at maximizing the annual comprehensive revenue of HVDN, and the lower-level model focuses on the minimization of the operational cost. Simulation results carried out on a real-world test system verify that the proposed method has the great potential of reducing the investment and operational cost while mitigating the transmission congestion.
1 Introduction
The acceleration of urbanization in many developing countries has caused the surge of the electricity load and renewable energy sources (RESs). Owing to the limited transmission capacity, the transmission congestion occurs more frequently than before. This limits the penetration of RESs (He et al., 2021). To guarantee the safe operation of the power system, the grid dispatchers have to curtail the generation of RESs and shed load as reported by Bird et al. (2016) and Goop et al. (2017).
Transmission switching is an efficient way to deal with the congestion management problems by elaborately selecting the transmission lines to be disconnected (Zhang et al., 2022). Extensive studies have been performed recently on this subject. In a study by Khanabadi et al. (2018), a decentralized transmission switching model is proposed to alleviate transmission congestion under credible contingencies. In a study by Salkuti (2018), a multiobjective-based congestion management methodology is established, considering the influences of network reconfiguration. The network topology is reconfigured to improve the hosting capacity of renewable generation and variable loads in a study by Haghighat and Zeng (2016). Many researchers have investigated the method that relieves the transmission congestion by performing high-voltage distribution network (HVDN) reconfiguration. The research by Zhang et al. (2020) and Hoffrichter et al. (2018) shows the great potential of implementing HVDN reconfiguration to mitigate the transmission congestion. However, implementing congestion management through frequent transmission switching could increase the risk of safe operation and reduce the power supply reliability.
The increasing penetration of RESs stimulates the installation of grid-side energy storage systems (ESSs), providing an effective solution to relieving the transmission congestion. On the grid side, the ESS plays the role of delaying the investment in transmission and distribution infrastructure (Hu et al., 2012; Macrae et al., 2014; Macrae et al., 2016), shaving peak load (Subramani et al., 2018), regulating the frequency (Dhundhara and Verma, 2018), and ensuring the safe operation (Nick et al., 2014). Several studies investigate the role of the ESS in increasing the transmission capacity of congested transmission networks (Del Rosso and Eckroad, 2014). In a study by Yan et al. (2020), a robust optimization model is designed to operate the ESS, considering uncertainties. The results show that the ESS could increase the system flexibility and mitigate the transmission congestion. In the research by Yang et al. (2021), a joint planning method of the ESS and transmission network is proposed to relieve the transmission congestion and reduce the curtailment of RES. Chen and Liu (2021) proposed a network reconfiguration integrated dynamic tariff–subsidy congestion management method, alleviating microgrid congestion caused by RESs and flexible demands through the ESS and network reconfiguration. In the research by Nick et al. (2017), the siting and sizing schemes of ESSs are optimized, considering the impact of network reconfiguration. In a study by Fiorini et al. (2017), the sizing and siting of large-scale ESSs are optimized in transmission grids to enhance the use of renewables. However, the investment cost of the ESS is relatively high owing to technical reasons and unreasonable planning methods. On the one hand, current ESS planning methods do not consider the development of the transmission network and the growth of the load, causing the excessive investment at the early stage (Cao et al., 2020). On the other hand, the planning model does not consider the role of HVDN reconfiguration in alleviating transmission congestion.
In order to fill up the gaps discussed above, this study proposes a multistage bilevel planning method for the ESS that considers the HVDN reconfiguration. The main contributions are shown as follows:
1) A collaborative scheduling strategy that co‐optimizes the ESS operational strategy and the HVDN topological structure is developed, avoiding the frequent HVDN reconfiguration and load shedding while maximizing the operating benefits of the urban power grid (UPG).
2) The proposed ESS planning procedure that consists of HVDN reconfiguration can effectively reduce the cost of ESS installation and improve the efficiency of the ESS.
3) The idea of multistage planning is incorporated into the optimal ESS allocation. On the one hand, it can maximize the utilization of the ESS. On the other hand, it can effectively avoid the waste of energy storage resources, reduce the investment and operation costs, and improve the revenue of the ESS.
2 Typical Structure of Urban Power Grid
In general, the UPG mainly consists of a 220-kV/500-kV transmission network and a 110-kV HVDN (Yuan and Hesamzadeh, 2017; Zhang et al., 2020) (as shown in Figure 1). Owing to the high density of urban loads and the limited transmission capacity, some transmission lines might be overload during system operations (Zhang et al., 2020).
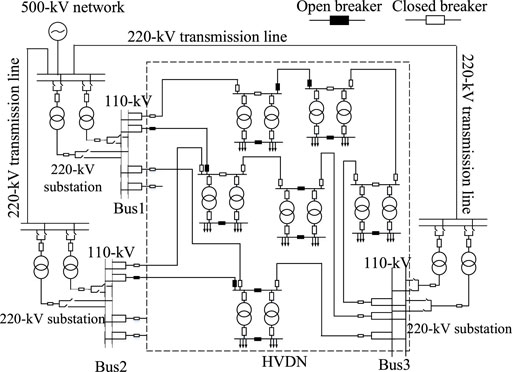
FIGURE 1. Illustration of the urban power grid structure.
To simplify the HVDN topology structure and improve the computation efficiency, the concept of a transformer unit (TU) is defined as shown in Figure 2, in which the letter P represents the active power transferred by TU. In order to simplify the problem, only the balance of the active load is considered.
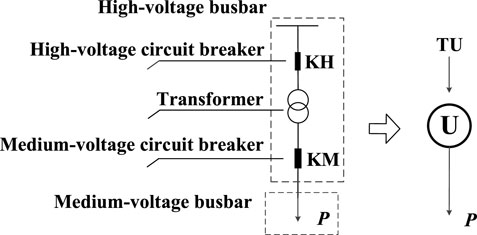
FIGURE 2. Structure of transformer unit.
Hence, the UPG structure in Figure 1 can be simplified as shown in Figure 3.
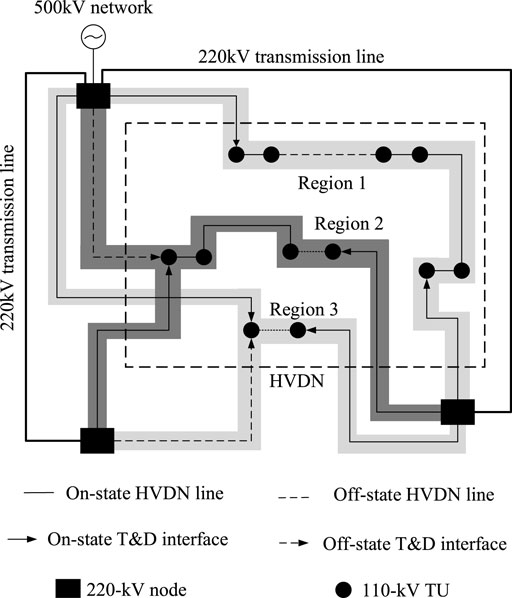
FIGURE 3. Simplified urban power grid structure.
3 Multistage Planning Approach
The flow chart of the multistage planning approach for the ESS in the UPG is shown in Figure 4.
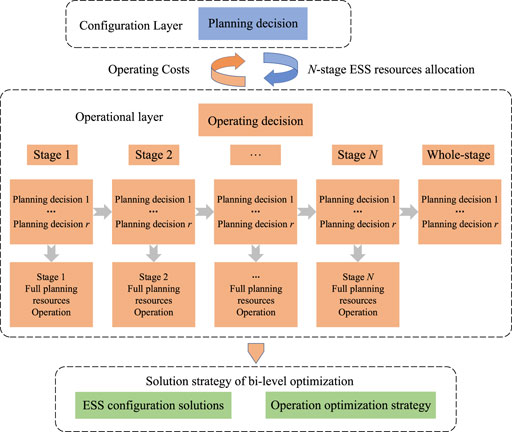
FIGURE 4. Flow diagram of energy storage system’s multistage planning.
Assume that the planning horizon of the ESS is n years. The planning stages are determined by the growing rate of the load. During the period of rapid load growth, the number of the stages should be more, and the length of the stages should be shorter. In this study, the planning horizon is divided into N stages as shown in Eq. 1:
where SN represents the Nth planning stage.
The planning scheme of the ESS at different stages is denoted as
where EsetN denotes the ESS planning scheme at the Nth stage.
Note that the planning scheme at the Nth stage is determined on the basis of the prior planning scheme Eset, N-1.
4 Problem Formulation
In order to reduce the difficulty of solving the ESS planning problem and improve the efficiency, the siting of the ESS is determined using a multiattribute comprehensive index evaluation model from the study by Guo et al., 2020, Song et al. (2019). The sizing problem is described using a bilevel mathematical model.
4.1 Siting Model
The siting of the ESS is determined using a multiattribute comprehensive index that comprises the line load rate and the nodal load curtailment rate. The detailed descriptions of the index are shown as follows:
The line load rate is the ratio of the maximum line load rate to the line capacity. The line load factor matrix F1 for each node is formed by taking the line load rate of each branch associated with the node as an indicator:
where f1(k) is the line load rate of the branch associated with the node m. N is the number of the 110-kV nodes. F1(k) is modeled as follows:
2) The nodal load curtailment rate is the ratio of the maximum load curtailment to the load at a node. This index reflects the overall reliability of the system and is used as an indicator to form the nodal load curtailment ratio matrix F2:
where f2(k) is the load curtailment rate of the node k. f2(k) is modeled as follows:
Thus, the comprehensive evaluation index of node k is formulated as follows:
where α and β are the weights for f1(k) and f2(k), respectively.
The index r(k) for each node is ranked from the largest to the smallest, and the top S values are selected to install the ESS.
4.2 Sizing Model
4.2.1 Upper-Level Model
The upper-level (UL) problem takes the total net proceeds of the ESS within its life cycle as the objective. The detailed model is as follows:
s.t.
Eq. 5 maximizes the total net proceeds of the ESS within its life cycle. It can be calculated using Eqs. 9–12. Equation 9 calculates the peak-shaving revenue of the ESS. Equation 10 calculates the revenue for delaying the investment on upgrading the grid infrastructure. Equations 11 and 12 are the investment cost and the operational cost for the ESS, respectively. In Eq. 11, the parameters Cs and Cp can be calculated as follows (Pandi et al., 2015; Hassan and Dvorkin, 2018):
where
4.2.2 Lower-Level Model
The lower-level model optimizes the topological structure of the HVDN, which aims at minimizing the curtailment of the load. The detailed reconfiguration model of the HVDN in each typical day is represented as follows:
s.t.
Equation 18 minimizes the curtailment of the load at HVDN node, Eqs 19–21 are the power balance constraints, Eqs 22–24 are radial constraints, Eq. 25 and Eq. 28 represent the limitation for the number of switching constraints, Eq. 29 and Eq. 30 represent the branch power constraints, Eq. 31 is the load curtailment amount constraints at the HVDN node, and Eqs 32–37 represent the ESS operation constraints.
4.2.3 Solving Process
The UL problem features strong nonlinearity, and the LL problem is a mixed-integer linear programming problem. Therefore, a hybrid method is used in this study, including the CPLEX optimizer and the PSO (Song et al., 2019). The solving process is a procedure of alternating iterations between the UL model and the lower-level model through coupling variables. First, the UL model is solved to obtain the initial size for the ESS. Then, the lower-level model is solved to obtain the optimal collaborative operational strategy of the ESS and HVDN based on the ESS size yielded by the UL model. In the end, the updated size of each ESS is used to check whether the termination conditions are met. The flowchart of the process is shown in Figure 5.

FIGURE 5. Flowchart of bilevel optimization solution.
5 Case Study
5.1 Simulation Setup
The proposed method is tested on a real 407-node UPG system in China. The system has a peak load of 4,080 MW, and the transmission system comprises 50,220-kV substations and 91,220-kV lines. Each substation has two or three nodes that are connected with the HVDN. The HVDN comprises 68,110-kV substations and 138,110-kV lines. Figure 6 shows part of the grid structure of the UPG. The ESSs are installed on the 110-kV DCU. The technical parameters of an ESS can be found in a study by Chen and Liu (2021). Other parameters are as follows: the construction life of the ESS is 2 a, its service life is 15 a, and its utilization days in a year are 280 days; the discount rate is taken as 8%; and the inflation rate is taken as 1.5%. Assuming that the ESS planning horizon n is 15 years and is divided into three stages, i.e., N = 3. The duration of each stage is 3, 5, and 7 years.
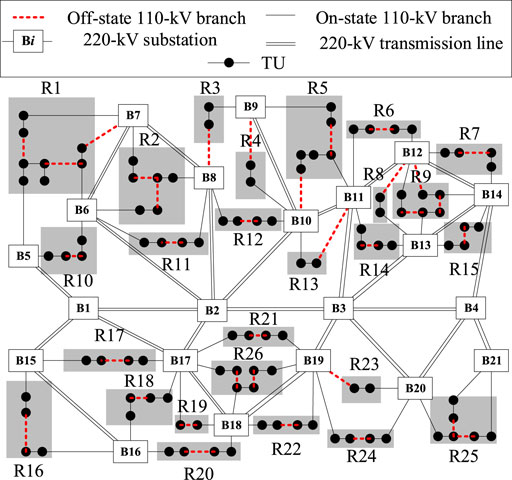
FIGURE 6. Network configuration of the China 407-node urban power grid system.
To show the advantages of the proposed method, three cases are set for comparison.
Case I: consider the multistage ESS planning scheme with the HVDN reconfiguration.
Case II: consider the single-stage ESS planning scheme with the HVDN reconfiguration.
Case III: consider the single-stage ESS planning scheme without the HVDN reconfiguration.
The numerical results are discussed as follows.
5.2 Simulation Results
The time-series data analysis results of the line load rate and the node load shedding rate are shown in Figure 7.
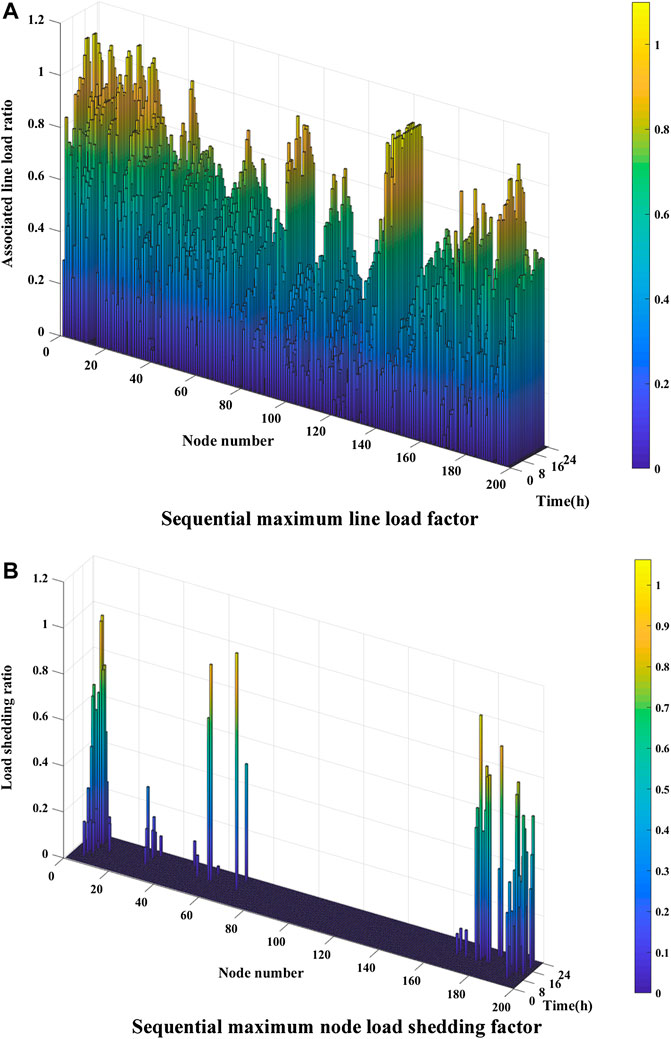
FIGURE 7. Sequential technical indices for energy storage system siting. (A) sequential maximum line load factor. (B) sequential maximum node load shedding factor.
Figure 7A shows the maximum load factor of the lines that connect with the nodes during a day. It can be seen from Figure 7A that each node experiences a period of high load rate.
Figure 7B shows the node load shedding index during a day. It can be seen from Figure 7B that some nodes encounter the curtailment of the load during the peak time to meet the constraints.
According to the importance of the above indicators in the upper objective function, the weights of each indicator are set to form a comprehensive indicator curve as shown in Figure 8. As shown in Figure 8, the indicator value of eight nodes, i.e., nodes 5, 14, 24, 38, 74, 114, 125, and 173, surpass the threshold. Hence, we chose these nodes as the candidates for installing the ESS.
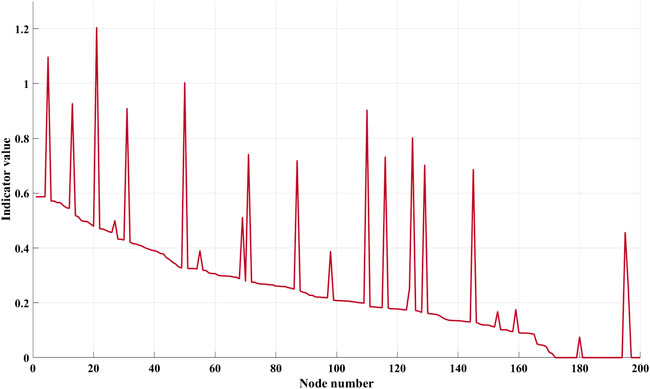
FIGURE 8. Comprehensive indicators for energy storage system siting.
The planning scenarios are solved separately for different cases, and the configuration of the ESS at each stage is shown in Tables 1–3.
1) As shown in Table 1, the capacity of the ESS keeps increasing at each planning stage to achieve the maximization of the objective of the UL model.

TABLE 1. Energy storage system planning results of each stage of case I.
2) As shown in Table 2, regardless of the ESS construction sequence, the investment cost increases by 3.6% from RMB 736.8 million in case I to RMB 763.30 million in case II, and the operation cost increases by 8.8% from RMB 214.2 million in case I to RMB 233 million in case II. It is obvious that the proposed multistage planning method achieves a better operational economy. The waste of the resources caused by the overinvestment is avoided while the growing load demand is satisfied.
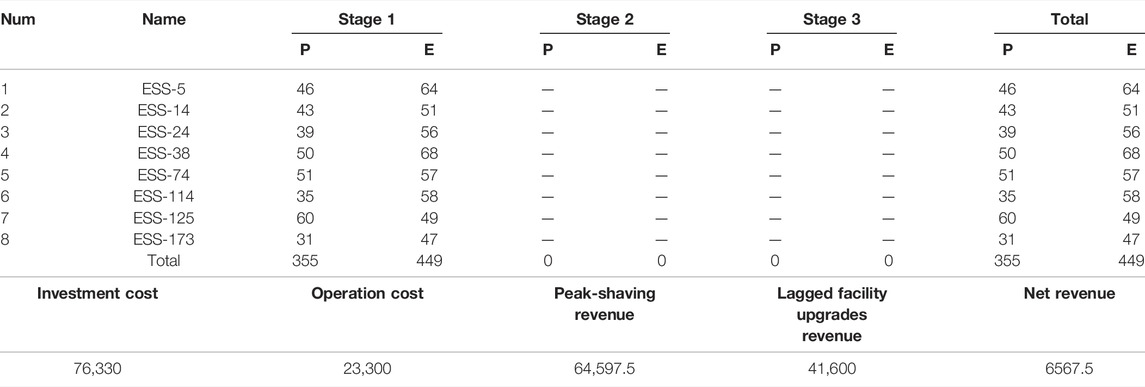
TABLE 2. Energy storage system planning results of each stage of case II.
3) From Tables 2 and 3, it can be seen that the ESS planning without considering the HVDN reconfiguration not only requires a larger investment cost but also has a lower net benefit. The results demonstrate that the collaboration of the ESS operational strategy and HVDN reconfiguration can reduce the cost for ESS allocation.
4) As shown in Tables 1–3, the net benefits of the system are positive during the whole life cycle of the ESS. It shows that the investment of the ESS can effectively save the cost for constructing new transmission lines and substations.
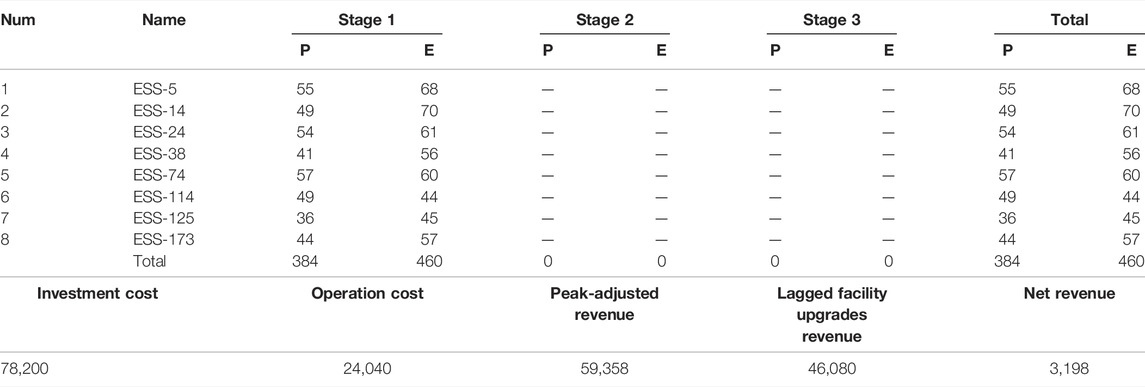
TABLE 3. Energy storage system planning results of each stage of case III.
The line ratio during a day is shown in Figure 9. To highlight the advantages of the proposed method, the method that only considers the HVDN reconfiguration (Haghighat and Zeng, 2016) is used to make a comparison with the proposed method. The numerical results are discussed as follows.
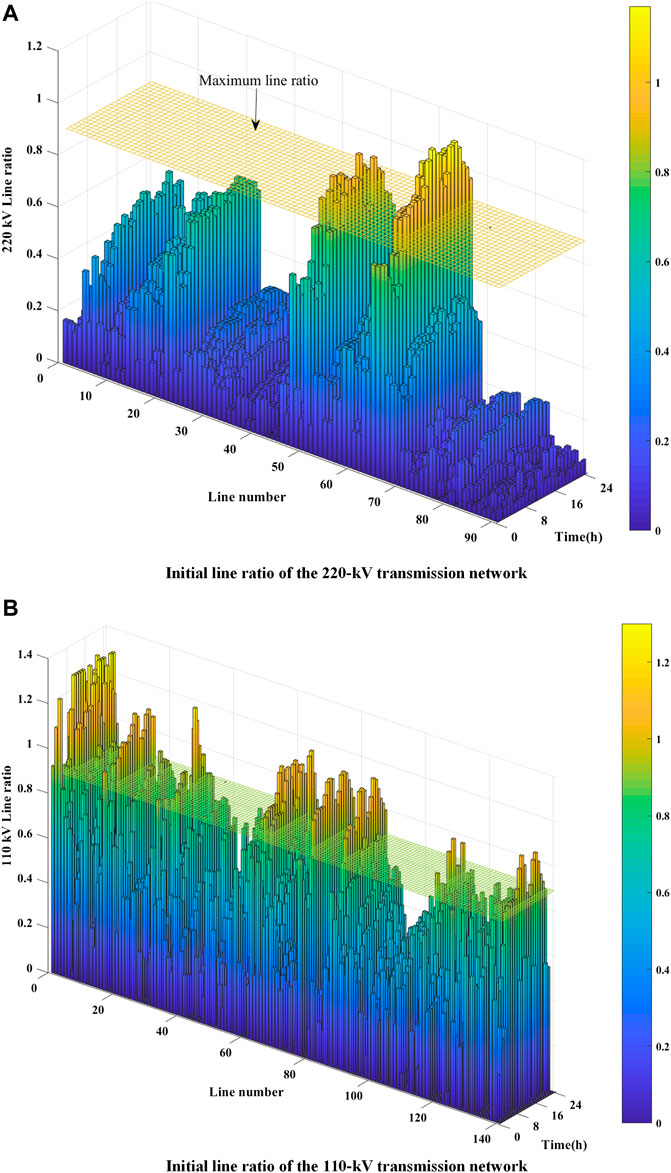
FIGURE 9. System initial operation condition. (A) initial line ratio of the 220-kV transmission network. (B) initial line ratio of the 110-kV transmission network.
As shown in Figure 10, most of the line ratios are limited to the acceptable level after reconfiguring the HVDN topology. The load curtailment is shown in Figure 11.
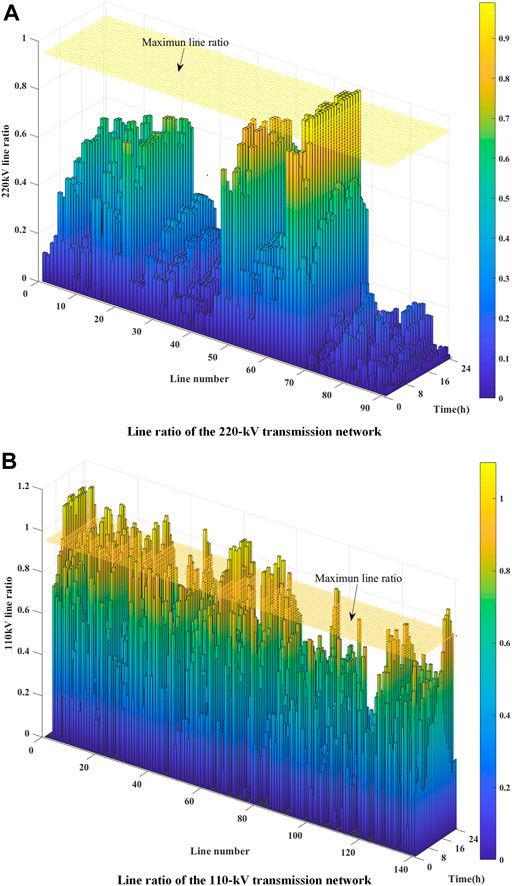
FIGURE 10. System operation condition. (A) line ratio of the 220-kV transmission network. (B) line ratio of the 110-kV transmission network.
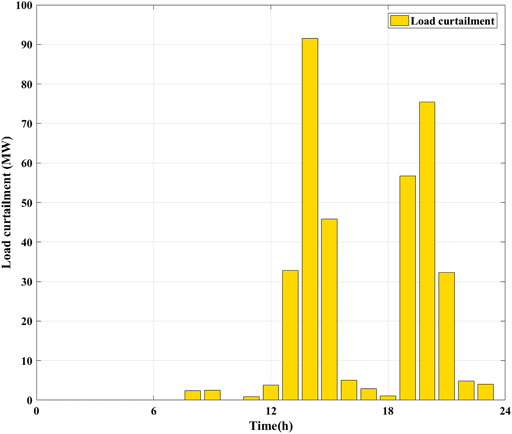
FIGURE 11. Load curtailment.
In Figure 11, the load curtailment occurs at the 12th to 23rd time intervals and 361.89‐MW load is curtailed in total. Although the transmission congestion is alleviated, the problems of frequent HVDN reconfiguration and the load shedding remain unsolved.
The optimized line ratio yielded by the proposed method is shown in Figure 12.
As shown in Figure 12, all line ratios are limited to the acceptable levels after performing the optimal ESS charging/discharging strategy and HVDN reconfiguration. The operational results are shown in Figures 13 and 14.
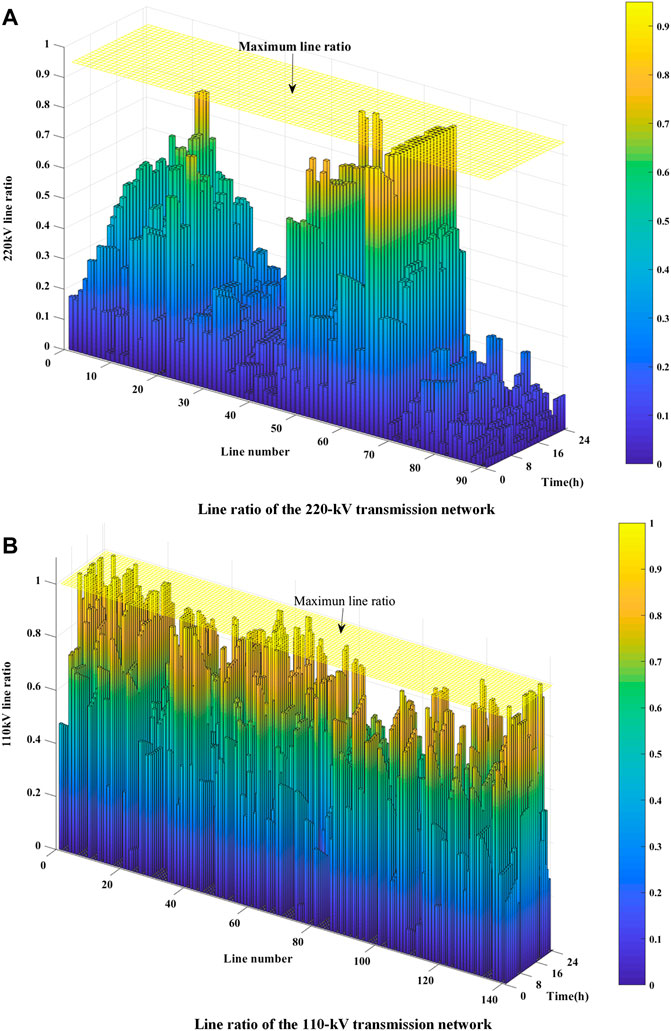
FIGURE 12. System operation condition. (A) line ratio of the 220-kV transmission network. (B) line ratio of the 110-kV transmission network.
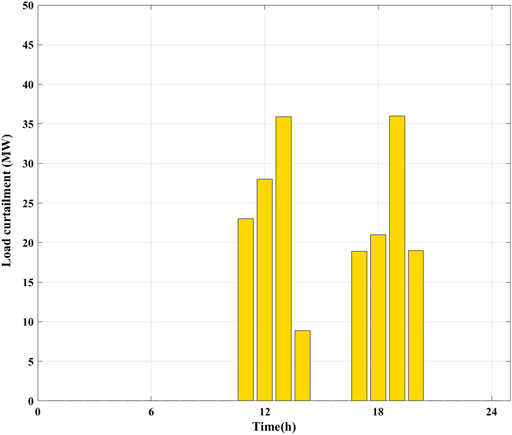
FIGURE 13. Load curtailment. (A) energy storage system (ESS)-24 operational strategy. (B) ESS-125 operational strategy.
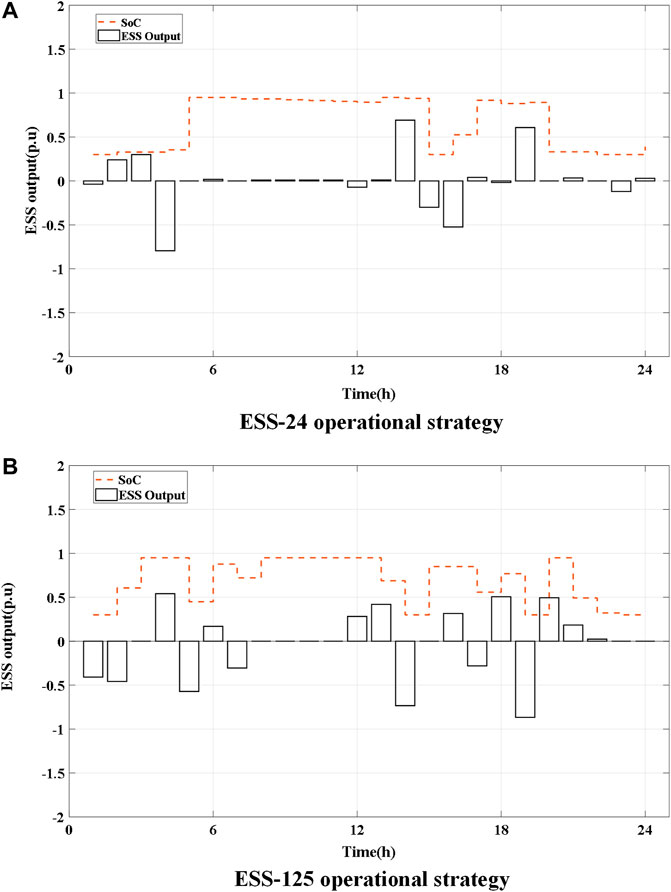
FIGURE 14. Energy storage system (ESS) operational strategy. (A) ESS-24 operational strategy. (B) ESS-125 operational strategy.
As shown in Figures 13 and 14, the load shedding is reduced and the SoC of each ESS is within the specified range.
5.3 Results and Discussion
The optimization results of the two methods are shown in Table 4. The proposed method is represented as method II.
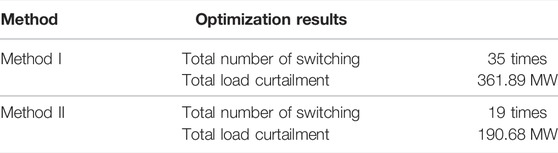
TABLE 4. Comparison of results of different congestion management schemes.
As shown in Table 4, the traditional method that only considers the HVDN reconfiguration requires 361.89-MW load curtailment, and the number of switch actions reaches 35 times. Based on the collaboration of the ESS operational strategy and the HVDN reconfiguration proposed in this study, the load shedding can be reduced to 190.68 MW. Besides, the number of switch actions reduces to 19 times compared with that in the conventional method.
6 Conclusion
To reduce the frequency of HVDN reconfiguration and mitigate the transmission congestion, this study proposes a multistage planning method for ESS allocation in the UPG, considering the influence of HVDN reconfiguration. From the numerical results, conclusions can be drawn, as follows:
1) Through co‐optimizing the HVDN topology and ESS operational strategy, transmission congestion can be effectively mitigated while reducing the load curtailment and the frequency of the HVDN reconfiguration.
2) The proposed ESS planning procedure incorporates the HVDN reconfiguration, which can effectively reduce the cost of ESS installation.
3) The multistage planning method can improve the economic operation of the ESS compared with the single-stage planning method.
In future work, the effect of the 10-kV distribution system reconfiguration can be further incorporated in the ESS planning model. Besides, the uncertainties of the RES and electric vehicles can be also considered to improve the adaptiveness of the proposed method.
Data Availability Statement
The original contributions presented in the study are included in the article/Supplementary Material, and further inquiries can be directed to the corresponding author.
Author Contributions
ZC, KY, XZ, and YZ: conceptualization, methodology; YC, RY, YG, XZ, and YZ: writing original draft preparation; JL and YL: supervision; YZ, SS, and SP: writing reviewing and editing.
Funding
The authors declare that this study received funding from the guangdong Power Grid Corporation Electricity Planning Theme Research Project Grant(030400QQ00210003). The funder had the following involvement in the study: design, collection, analysis, interpretation of data, the writing of this article and the decision to submit it for publication.
Conflict of Interest
The authors declare that the research was conducted in the absence of any commercial or financial relationships that could be construed as a potential conflict of interest.
Publisher’s Note
All claims expressed in this article are solely those of the authors and do not necessarily represent those of their affiliated organizations, or those of the publisher, the editors, and the reviewers. Any product that may be evaluated in this article, or claim that may be made by its manufacturer, is not guaranteed or endorsed by the publisher.
References
Bird, L., Lew, D., Milligan, M., Carlini, E. M., Estanqueiro, A., Flynn, D., et al. (2016). Wind and Solar Energy Curtailment: a Review of International Experience. Renew. Sustain. Energy Rev. 65, 577–586. doi:10.1016/j.rser.2016.06.082
Cao, Y., Mu, Y., Jia, H., Yu, X., Song, Y., Wu, K, et al. (2020). Multi-stage Planning of Park-Level Integrated Energy System Considering Construction Time Sequence[J]. Proc. CSEE 40 (21), 6815–6828. doi:10.13334/j.0258-8013.pcsee.200622
Chen, Y., and Liu, Y. (2021). Congestion Management of Microgrids with Renewable Energy Resources and Energy Storage Systems[J]. Front. Energy Res. 9, 708087. doi:10.3389/fenrg.2021.708087
Del Rosso, A. D., and Eckroad, S. W. (2014). Energy Storage for Relief of Transmission Congestion. IEEE Trans. Smart Grid 5 (2), 1138–1146. doi:10.1109/tsg.2013.2277411
Dhundhara, S., and Verma, Y. P. (2018). Capacitive Energy Storage with Optimized Controller for Frequency Regulation in Realistic Multisource Deregulated Power System. Energy 147, 1108–1128. doi:10.1016/j.energy.2018.01.076
Fiorini, L., Pagani, G. A., Pelacchi, P., Poli, D., and Aiello, M. (2017). Sizing and Siting of Large-Scale Batteries in Transmission Grids to Optimize the Use of Renewables[J]. IEEE J. Emerg. Sel. Top. Circuits Syst. 7 (2), 285–294. doi:10.1109/JETCAS.2017.2657795
Goop, J., Odenberger, M., and Johnsson, F. (2017). The Effect of High Levels of Solar Generation on Congestion in the European Electricity Transmission Grid. Appl. Energy 205, 1128–1140. doi:10.1016/j.apenergy.2017.08.143
Guo, W., Xiu, X., Li, W., and Li, J. (2020). Siting and Configuration Methods for Grid-Side Energy Storage System Considering Multi-Attribute Comprehensive Indices and Economy[J]. Electr. Power Constr. 41 (04), 53–62.
Haghighat, H., and Zeng, B. (2016). Distribution System Reconfiguration under Uncertain Load and Renewable Generation. IEEE Trans. Power Syst. 31 (4), 2666–2675. doi:10.1109/tpwrs.2015.2481508
Hassan, A., and Dvorkin, Y. (2018). Energy Storage Siting and Sizing in Coordinated Distribution and Transmission Systems[J]. IEEE Trans. Sustain. Energy 9, 1692–1701. doi:10.1109/TSTE.2018.2809580
He, H., Du, E., Zhang, N., Kang, C., and Wang, X. (2021). Enhancing the Power Grid Flexibility with Battery Energy Storage Transportation and Transmission Switching. Appl. Energy 290 (2), 116692. doi:10.1016/j.apenergy.2021.116692
Hoffrichter, A., Barrios, H., Massmann, J., Venkataramanachar, B., and Schnettler, A. (2018). Impact of Considering 110 kV Grid Structures on the Congestion Management in the German Transmission Grid. Scigrid Int. Conf. Power Grid Model. 977. doi:10.1088/1742-6596/977/1/012004
Hu, Z. C., Zhang, F., and Li, B. W. (2012). “Transmission Expansion Planning Considering the Deployment of Energy Storage Systems[C],” in 2012 IEEE Power and Energy Society General Meeting (San Diego, CA: IEEE).
Khanabadi, M., Fu, Y., and Liu, C. (2018). Decentralized Transmission Line Switching for Congestion Management of Interconnected Power Systems. IEEE Trans. Power Syst. 33 (6), 5902–5912. doi:10.1109/tpwrs.2018.2838046
Macrae, C., Ozlen, M., and Ernst, A. (2014). “Transmission Expansion Planning Considering Energy Storage[C],” in 2014 IEEE International Autumn Meeting on Power, Electronics and Computing (ROPEC) (Ixtapa, Mexico: IEEE).
Macrae, C. A. G., Ernst, A. T., and Ozlen, M. (2016). A Benders Decomposition Approach to Transmission Expansion Planning Considering Energy Storage. Energy 112, 795–803. doi:10.1016/j.energy.2016.06.080
Nick, M., Cherkaoui, R., and Paolone, M. (2017). Optimal Planning of Distributed Energy Storage Systems in Active Distribution Networks Embedding Grid Reconfiguration[J]. IEEE Trans. Power Syst. 33 (2), 1577–1590. doi:10.1109/TPWRS.2017.2734942
Nick, M., Cherkaoui, R., and Paolone, M. (2014). Optimal Allocation of Dispersed Energy Storage Systems in Active Distribution Networks for Energy Balance and Grid Support. IEEE Trans. Power Syst. 29 (5), 2300–2310. doi:10.1109/tpwrs.2014.2302020
Pandi, H., Wang, Y., Qiu, T., Dvorkin, Y., and Kirschen, D. S. (2015). Near-optimal Method for Siting and Sizing of Distributed Storage in a Transmission Network. IEEE Trans. Power Syst. 30 (5), 2288–2300. doi:10.1109/TPWRS.2014.2364257
Salkuti, S. R. (2018). Congestion Management Using Optimal Transmission Switching. IEEE Syst. J. 12, 3555–3564. doi:10.1109/jsyst.2018.2808260
Song, T., Han, X., Jia, Y., Qin, W., Zhang, B., and Zhang, Q. (2019). “Multi-Stage Bi-level Planning of Energy Storage Considering Cycling Degradation,” in 2019 IEEE Power & Energy Society General Meeting (PESGM) (Atlanta, Georgia, United States: IEEE). doi:10.1109/pesgm40551.2019.8973797
Subramani, G., Ramachandaramurthy, V. K., and Vijyakumar, K. N. (2018). Optimal Sizing of Battery Energy Storage System (BESS) for Peak Shaving under Malaysian Electricity Tariff. Adv. Sci. Lett. 24 (3), 1861–1865. doi:10.1166/asl.2018.11177
Yan, X., Gu, C., Zhang, X., and Li, F. (2020). Robust Optimization-Based Energy Storage Operation for System Congestion Management. IEEE Syst. J. 14 (2), 2694–2702. doi:10.1109/jsyst.2019.2932897
Yang, X., Chai, G., Liu, X., Xu, M., and Guo, Q. (2021). Storage-Transmission Joint Planning Method to Deal with Insufficient Flexibility and Transmission Congestion. Front. Energy Res. 8, 612909. doi:10.3389/fenrg.2020.612909
Yuan, Z., and Hesamzadeh, M. R. (2017). Hierarchical Coordination of TSO-DSO Economic Dispatch Considering Large-Scale Integration of Distributed Energy Resources. Appl. Energy 195, 600–615. doi:10.1016/j.apenergy.2017.03.042
Zhang, X., Liu, Y., Gao, H., Wang, L., and Liu, J. (2020). A Bi-level Corrective Line Switching Model for Urban Power Grid Congestion Mitigation. IEEE Trans. Power Syst. 35 (4), 2959–2970. doi:10.1109/tpwrs.2019.2959586
Zhang, X., Liu, Y., Zeng, Y., Wu, G., and Liu, J. (2022). Prosumer‐centric Energy Storage System and High Voltage Distribution Network Topology Co‐optimisation for Urban Grid Congestion Management. IET Smart Grid 24 (7), 1–11. doi:10.1049/stg2.12061
Nomenclature
Abbreviations
UPG Urban power grid
TS 220-kV transmission system (TS) in the UPG
HVDN 110-kV high-voltage distribution network
ESS Energy storage system
B. Indexes
i,j Node index in the TS
k,l,m Node index in the HVDN
b Node index in the HVDN
n Number of the regional HVDN
E Set of typical operational scenarios, indexed by e
T Set of time intervals, indexed by t
C. Sets
BT, LT Node set and branch set in the TS
BH, LH Node set and branch set in the HVDN
LT−H Branch set in the TS and HVDN interface
BEk Set of nodes that connect with an ESS
Eset Indicating the planning scheme of the ESS
S Set of the planning stages
D. Parameter
E. Variables
Keywords: energy storage station, multistage planning, high-voltage distribution network, congestion management, network reconfiguration, load shedding
Citation: Cai Z, Yang K, Chen Y, Yang R, Gu Y, Zeng Y, Zhang X, Sun S, Pan S, Liu Y and Liu J (2022) Multistage Bilevel Planning Model of Energy Storage System in Urban Power Grid Considering Network Reconfiguration. Front. Energy Res. 10:952684. doi: 10.3389/fenrg.2022.952684
Received: 25 May 2022; Accepted: 20 June 2022;
Published: 17 August 2022.
Edited by:
Yunfei Mu, Tianjin University, ChinaReviewed by:
Youwei Jia, Southern University of Science and Technology, ChinaWei Pei, Institute of Electrical Engineering (CAS), China
Copyright © 2022 Cai, Yang, Chen, Yang, Gu, Zeng, Zhang, Sun, Pan, Liu and Liu. This is an open-access article distributed under the terms of the Creative Commons Attribution License (CC BY). The use, distribution or reproduction in other forums is permitted, provided the original author(s) and the copyright owner(s) are credited and that the original publication in this journal is cited, in accordance with accepted academic practice. No use, distribution or reproduction is permitted which does not comply with these terms.
*Correspondence: Yu Zeng, enkyNDE2MTU2OTc2QDE2My5jb20=