 Xian Feng Zhu
 Jun Wei Yao*Qiong Yao XieLu DaiChu Yuan YangHai Liang WangQi HeLing DengRan ShenXiao Xia Zhou
- State Grid Yichang Power Supply Company, Yichang, China
With the increasing diversification of human energy consumption forms in the integrated energy market, analyzing the comprehensive energy consumption behavior of user groups according to their changing energy demand characteristics is an important issue to be urgently addressed. To solve this problem, an analysis method of user’s comprehensive energy consumption behavior based on the evolutionary game is proposed in this article. First, three types of users including residents, large industries, and commercial users are considered for this purpose. Then, a utility model which takes into account the energy consumption characteristics of these users and their comfort factors is constructed based on the subjective and objective combination weighting method. Thereafter, an evolutionary game theory is used to analyze the dynamic selection process for users by selecting energy suppliers and then using the selection results when the evolutionary equilibrium is reached. Finally, the model is solved by using a distributed iterative method. The correctness and validity of the proposed method are verified by the simulation results.
1 Introduction
With the deepening of the energy crisis, the integrated energy system, which can break the heterogeneous energy barrier and improve comprehensive energy consumption efficiency (Yu et al., 2016; Ai and Hao, 2018; Chen et al., 2020) has developed rapidly in the recent years. With the gradual advancement of the comprehensive energy marketization process, people have more and more diversified energy forms available to them in the process of energy consumption, such as natural gas, electric energy, coal, etc (Cui et al., 2019). On a longer time scale, people’s energy consumption load may shift between different forms of energy (Boutaba et al., 2018; Huang et al., 2019). Therefore, for an integrated energy system, different forms of heterogeneous energy will form new coupling nodes (Zeng et al., 2018) on the user side by linking people’s energy consumption behavior (Yang et al., 2022a). In the aforementioned context, it is of great theoretical and practical significance (Yang and Wang, 2016; Liu et al., 2019) to study users’ choice behavior of different forms of energy for the planning and operation of the future integrated energy system (Yang et al., 2021a; Yang et al., 2021b; Yang et al., 2022b).
Thus, this study proposes a comprehensive user energy consumption behavior analysis method based on the evolutionary game. First, a utility model is constructed according to the subjective and the objective combination weighting method taking into account the residential, large industrial, and the commercial users as the main users. This model is based upon their energy consumption characteristics and comfort level factors (Guan and Pu, 2010). On this basis, a game model is proposed to describe the dynamic process of user energy consumption choice based on the evolutionary game method. Finally, Jorgen (2015) the distributed iterative method is used to solve the model, and then the evolutionary equilibrium result is obtained (Samadi et al., 2012). Compared with the traditional method, the proposed method is more accurate and effective as it fully considers the dynamic evolutionary game process when users choose to consume different forms of energy. The results verify the effectiveness of the proposed method. Therefore, the research can provide a reference for energy suppliers to formulate a reasonable pricing strategy.
2 User utility index construction
This study comprehensively considers the reaction mechanism of users towards energy prices and incentive policies in the integrated energy market. It constructs the user utility evaluation index system from the angle of energy consumption characteristics and the user psychology, which mainly consists of the following four indicators: comprehensive energy consumption cost (B1), energy supply occupancy (B2), energy supply reliability rate (B3), and user comfort level (B4).
2.1 Comprehensive energy consumption cost
The energy price of different energy types will directly affect the energy consumption cost of users which will further affect users’ energy consumption choices. Furthermore, the transformation cost of the user in the process of changing the energy type will also affect their energy choice decision. Therefore, this research studies the comprehensive energy consumption cost from the perspective of different types of user groups, including energy consumption cost and transformation cost. First, the research period is set as T, and in the research period, if m type users choose energy type n, then the comprehensive energy consumption cost of m type users choosing energy type n is illustrated as follows:
In the aforementioned formula:
In the aforementioned formula:
Taking into account the equipment differences caused by the conversion of electricity to natural gas, then the natural gas to heat and other energy sources as well as the user’s equipment removal and installation costs, the specific formula is as shown as follows:
In the formula stated previously:
2.2 Energy supply occupancy
The energy supply occupancy in the integrated energy market reflects the image of energy suppliers in the market, which indirectly affects the decision-making of user energy consumption. In general, the energy supply occupancy is closely related to the user’s choice of energy consumption. Thus, this study is divided based on user type and load usage, and the specific formula is as follows:
In the formula:
2.3 Energy supply reliability rate
The reliability rate of the energy supply directly reflects the energy supply level of the supplier. Longer the effective energy supply times of the supplier, the better the reliability of the energy supply, and correspondingly, the higher the probability of users choosing this type of energy. This study uses the ratio of the user’s valid time of energy supply to the research period as an indicator of reliability of energy supply, and the formula is as follows:
In the formula:
2.4 User comfort level
In the user’s decision-making process to choose different types of energy, their energy consumption experience, and their comfort level changes with the influence of external factors. The reference (De Greve et al., 2017) describes user comfort level in the form of quadratic function, exponential function, and logarithmic function. In this study, an exponential function considering the influence of environmental factors is used to characterize the user comfort level, and the formula is illustrated as follows:
\In the formula:
3 User energy consumption behavior decision based on the evolutionary game
The construction of the user utility function needs to consider multiple indexes. Each index has a different influence on the user utility index system. Therefore, it is necessary to determine the influence of each index in the decision-making process of different types of user groups by applying the weight coefficient (Jalali and Kazemi, 2015). At present, the subjective weighting method and the objective weighting method are usually used to determine weight. However, in this study, the method of combination weighting is used to calculate the weight index (Guo et al., 2017). The analytic hierarchy process and the coefficient of variation are respectively used to calculate the subjective and objective weight values of the user utility index.
The evolutionary game is used to analyze users’ comprehensive energy consumption behavior. Electricity, natural gas, and heat suppliers first release the energy supply information to the users, then calculate their utility of energy type selection and update their game strategy based on this. The energy supplier will update the energy supply occupancy rate according to the current user ’group’s selection status and then release it to the users. Both sides achieve the final evolutionary equilibrium in the process of the evolutionary game (Cheng and Yu, 2018). Figure 1 shows the relation of the evolutionary game.
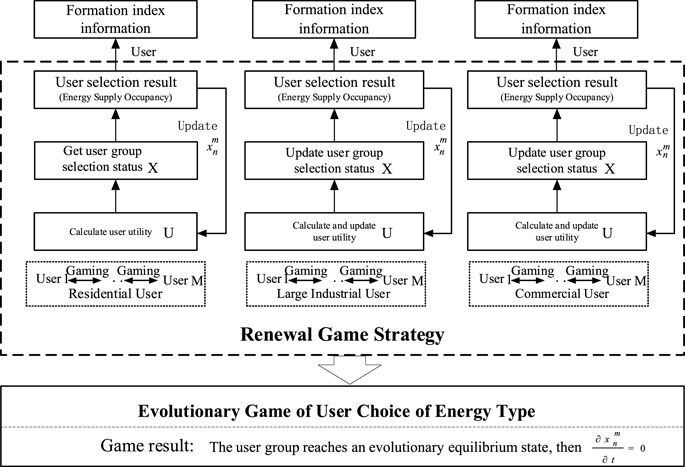
FIGURE 1. Evolutionary game relation of users’ choices for energy types.
Setting
In the process of energy type selection, users will constantly update the utility function and optimize their own strategies according to the utility function (Xiao, 2010). Therefore, this article introduces the correction factor
In the Eq. 9, the first and the second item on the right side of the equation represents the proportion of m-type users who transfer from other strategies to strategy n and those who change from strategy n to other strategies. Where,
By substituting the aforementioned equation into Eq. 9, the final dynamic change formula of the user group is as follows:
Since the heat consumption of large industrial users and the natural gas and heat consumption ratio of commercial users are limited by actual production, the load absorption capacity is limited. The aforementioned load constraint conditions are as follows:
4 Example analysis
4.1 Example explanation
In this study, the dynamic selection behavior between residential, large industrial, and commercial user groups (M = 3) and electricity, natural gas, and heat suppliers (n = 3) is simulated. The simulation program used MATLAB R2016a to calculate the evolutionary game model of chapter 3. The research period is 1 day, and
For the convenience of calculation due to the difference in energy load units of different forms of energy,, this study unified the energy load units of electricity, natural gas, and heat according to the conversion standard between different energy sources and standard coal (Feng, 2011). Specific energy load data
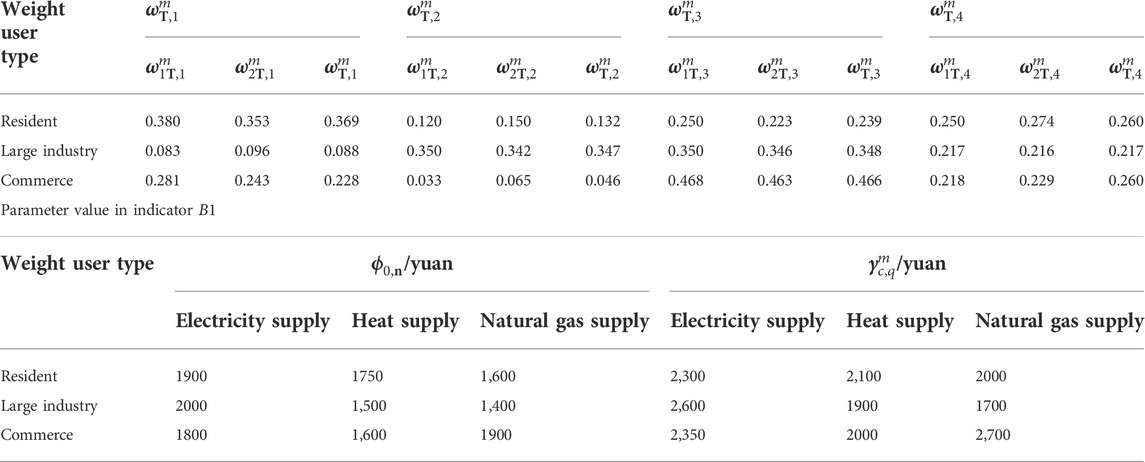
TABLE 1. Weight of index and parameter value of different types of users.
In order to avoid the influence of large fluctuation of energy load on the evaluation results,
4.2 Simulation results and analysis
The evolutionary game method is used to calculate the model of the user’s energy choice. The energy supply occupancy rates of electric, heat, and natural gas energy types in the initial state are set as (0.27, 0.42, 0.31) and (0.33, 0.33, 0.33) respectively. The comprehensive energy selection results of the three types of user groups are calculated respectively, as shown in Figure 2.

FIGURE 2. Selection results of three types of users.
According to Figure 2, the selection process of residential, large industrial, and commercial user groups all converge iteratively. Furthermore, the evolutionary equilibrium results obtained by the aforementioned three types of user groups are the same under the initial state of two different energy supply occupancy rates. It indicates that the user group’s selection of different energy types is unrelated to the initial state of energy supply occupancy.
Also according to Figure 2, among the total energy consumption load of the residential user group, the proportions of the final electricity load, heat load, and natural gas load are 0.229, 0.382, and 0.389 respectively. In the final evolution result of residential user energy load, heat and natural gas load account for a relatively higher proportion. The main reason is residential users are more sensitive to price and energy cost, which has the highest weight of energy consumption cost (0.369). Compared with the electricity load, the unit price of natural gas and heat after conversion is 0.23 yuan and 0.19 yuan less respectively. Therefore, residential users are more inclined toward increasing the proportion of natural gas and heat load as much as possible under the premise of ensuring the reliability and comfort of users’ energy supply.
In the total energy consumption load of the large industrial user group, the proportion of final electricity load, heat load, and natural gas load are 0.309, 0.231, and 0.460 respectively. The main reason is similar to residential users. Large industrial users engaged in production are also very sensitive to the price of energy consumption. Therefore, they tend to choose primary energy for energy supply, which leads to natural gas accounting for a relatively high proportion of their comprehensive energy consumption. However, compared with residential users, large industrial users have higher requirements for energy supply reliability, and their weight of energy supply reliability is 0.109 higher than that of residential users. The electricity supply reliability of electric load is 0.015 higher than that of heat load. Moreover, according to the actual production limitation, the heat load absorption capacity of large industrial users is very low. As a result, although from the point of view of cost, electricity cost is 2,539.4 yuan higher than the heating cost, in the final energy consumption result the electric load accounts for a higher proportion.
In the total energy consumption load of the commercial user group, the proportion of final electricity load, heat load, and natural gas load are 0.510, 0.278, and 0.212 respectively. The main reason is that commercial users care more about user comfort and energy supply reliability, which is different from residential users and large industrial users. The weights of these two indicators i.e. user comfort and energy supply reliability are 0.260 and 0.466 respectively, which are the highest among the three types of users. Overall, the user comfort and energy supply reliability of electric load is the best. Moreover, for industry reasons, commercial users have a high cost of retrofitting electricity to other forms of energy and a limited capacity to absorb heat and natural gas loads (Yang et al., 2013). Therefore, in the energy consumption results of commercial users, their electrical load accounts for the highest proportion.
4.3 Comparison and analysis
In order to verify the correctness and effectiveness of the proposed method, the static clustering analysis method and the proposed method were used for the simulation, and the calculation results were compared. The two methods are as follows:
1) Static cluster analysis. The clustering decision is made directly according to the energy consumption characteristics of the three types of users without considering the dynamic change of load proportion of different types in the decision-making process.
2) The proposed method. According to the energy attributes of three types of users, the dynamic changes of different load proportions in the decision-making process are described by using evolutionary game theory.
The user utility results of the two methods are shown in Table 2.
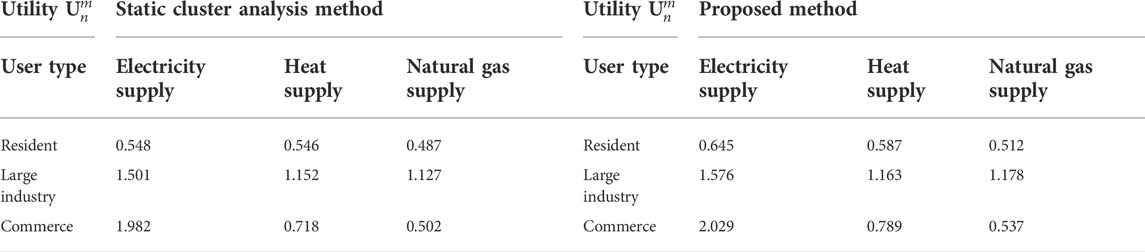
TABLE 2. Users’ utility results of two methods.
According to Table 2, in comparison with the static clustering analysis method, the user utility value calculated by the proposed method in this article is higher. Specifically, for residential users, the utility of electricity supply, heat supply, and natural gas supply calculated by the proposed method is 9.7, 4.1, and 2.5% higher, respectively. For large industrial users, the utility of electricity supply, heat supply, and natural gas supply calculated by the proposed method is 7.5, 1.1, and 5.1% higher, respectively. For commercial users, the utility of electricity supply, heat supply, and natural gas supply calculated by the proposed method is 4.7, 7.1, and 3.5% higher, respectively.
The analysis shows that the proposed method in this study is better in assisting users to make decisions on energy selection. The reason is that the perspective of the static clustering analysis method is to evaluate the energy consumption selection of user utility statically. However, the dynamic game between users and energy types in the process of choosing their own comprehensive energy consumption ratio is not considered, which makes it difficult for users and energy suppliers to optimize their own utility through interaction in the process of energy consumption selection and decision making. Contrary to the static clustering analysis method, the proposed method of this study aims to build an evolutionary game model of user energy choice decisions. The main objective of this model is to ensure that users and energy suppliers can dynamically adjust their decisions according to the situation of the evolutionary game so as to achieve utility maximization and increase the effectiveness and accuracy of decision results.
5 Conclusion
In this study, the idea of a dynamic game is applied to the decision-making process of users’ comprehensive energy consumption. Moreover, an analysis method of user comprehensive energy consumption behavior based on an evolutionary game is proposed. According to the simulation examples, the conclusions are as follows:
1) The user group’s choice of different energy types is unrelated to the initial state of energy supply occupancy and is only related to the energy consumption selection bias and the utility index of different types of energy.
2) When the evolutionary equilibrium is reached, if the specificity of user behavior is higher, the proportion of users choosing this kind of energy would be greater. Therefore, in the process of comprehensive energy market competition, the cultivation of user specificity is conducive to improving the market share of energy suppliers.
3) The proposed method in this study can ensure that users and energy suppliers adjust their decisions dynamically according to the situation of the evolutionary game, which assists them to realize the optimization of utility. As a result, the effectiveness and accuracy of decision results are higher.
Data availability statement
The raw data supporting the conclusion of this article will be made available by the authors, without undue reservation.
Author contributions
XFZ: methodology, software, investigation, formal analysis, and writing—original draft; JY: data curation, writing—original draft, and funding acquisition; QX: investigation; LuD: investigation; CY: resources; HW: resources; QH: supervision; LiD: validation; RS: writing—review and editing; XXZ: writing—review and editing.
Conflict of interest
XFZ, JY, QX, LuD, CY, HW, QH, LiD, RS, and XXZ were employed by the State Grid Yichang Power Supply Company.
The authors declare that the research was conducted in the absence of any commercial or financial relationships that could be construed as a potential conflict of interest.
Publisher’s note
All claims expressed in this article are solely those of the authors and do not necessarily represent those of their affiliated organizations, or those of the publisher, the editors, and the reviewers. Any product that may be evaluated in this article, or claim that may be made by its manufacturer, is not guaranteed or endorsed by the publisher.
References
Ai, Q., and Hao, R. (2018). Key technologies and challenges for multi-energy complementarity and optimization of inte grated energy system[J]. Automation Electr. Power Syst. 42 (4), 2–10. (in Chinese). doi:10.7500/AEPS20170927008
Boutaba, R., Salahuddin, M. A., Limam, N., Ayoubi, S., Shahriar, N., Estrada-Solano, F., et al. (2018). A comprehensive survey on machine learning for networking: Evolution, applications and research opportunities. J. Internet Serv. Appl. 9 (1), 1–99. doi:10.1186/s13174-018-0087-2
Chen, B., Sun, H., Chen, Y., Guo, Q., Wu, W., and Qiao, Z. (2020). Energy circuit theory of integrated energy system Analysis (I): Gaseous circuit[J]. Proc. CSEE 40 (02), 436–444. (in Chinese). doi:10.13334/j.0258-8013.pcsee.200028
Cheng, L., and Yu, T. (2018). Typical scenario analysis of equilibrium stability of multi-group asymmetric evolutionary games in the open and ever-growing electricity market[J]. Proc. CSEE 38 (19), 5687–5703. (in Chinese). doi:10.13334/j.0258-8013.pcsee.172219
Cui, Q., Bai, X., Dong, W., and Huang, B. (2019). Joint optimization of planning and operation in user-side multi-energy systems. Proc. CSEE 39 (17), 4967–4981. (in Chinese). doi:10.13334/j.0258-8013.pcsee.181874
De Greve, Z., Lecron, F., Vallee, F., Mor, G., Perez, D., Danov, S., et al. (2017). Comparing time-series clustering approaches for individual electrical load patterns. CIRED - Open Access Proc. J. 2017 (1), 2165–2168. doi:10.1049/oap-cired.2017.1222
Feng, X. (2011). Research on power user classification Technology based on actual load curve [D]. North China: Electric Power University.
Guan, H., and Pu, L. (2010). A drivers' choice behavior model based on evolutionary game theory[J]. J. Beijing Univ. Technol. 36 (08), 1077–1083. (in Chinese). doi:10.11936/bjutxb2010081077
Guo, H., Cheng, H., Ma, Z., and Ge, L. (2017). Comprehensive evaluation of power quality based on probability theory and combination weighting method[J]. Smart Grid 5 (06), 524–528. (in Chinese). doi:10.14171/j.2095-5944.sg.2017.06.002
Huang, W., Zhang, N., Kang, C., Li, M., and Huo, M. (2019). From demand response to integrated demand response: Review and prospect of research and application. Prot. Control Mod. Power Syst. 4 (1), 1–13. doi:10.1186/s41601-019-0126-4
Jalali, M. M., and Kazemi, A. (2015). Demand side management in a smart grid with multiple electricity suppliers. Energy 81 (1), 766–776. doi:10.1016/j.energy.2015.01.027
Jorgen, W. (2015). Weibull. Evolutionary game theory [M]. Shanghai: Shanghai People's Publishing House, 26–32.
Liu, N., Wang, J., and Wang, L. (2019). Hybrid energy sharing for multiple microgrids in an integrated heat–electricity energy system. IEEE Trans. Sustain. Energy 10 (3), 1139–1151. doi:10.1109/tste.2018.2861986
Samadi, P., Mohsenian-Rad, H., Schober, R., and Wong, V. W. S. (2012). Advanced demand side management for the future smart grid using mechanism design. IEEE Trans. Smart Grid 3 (3), 1170–1180. doi:10.1109/tsg.2012.2203341
Xiao, H. (2010). Research on several game problems in traffic planning [D]. China: Wuhan University.
Yang, N., Dong, Z., Wu, L., Zhang, L., Shen, X., Chen, D., et al. (2022b). A comprehensive review of security-constrained unit commitment. J. Mod. Power Syst. Clean Energy 10 (3), 562–576. doi:10.35833/MPCE.2021.000255
Yang, N., Qin, T., Wu, L., Huang, Y., Huang, Y., Xing, C., et al. (2021b). A multi-agent game based joint planning approach for electricity-gas integrated energy systems considering wind power uncertainty. Electr. Power Syst. Res. 204, 107673. ISSN 0378-7796. doi:10.1016/j.epsr.2021.107673
Yang, N., Yang, C., Wu, L., Shen, X., Jia, J., Li, Z., et al. (2022a). Intelligent data-driven decision-making method for dynamic multi-sequence: An E-Seq2Seq based SCUC expert system. IEEE Trans. Ind. Inf. 18, 3126–3137. doi:10.1109/TII.2021.3107406
Yang, N., Yang, C., Xing, C., Ye, D., Jia, J., Chen, D., et al. (2021a). Deep learning-based SCUC decision-making: An intelligent data-driven approach with self-learning capabilities. IET Generation Trans. Dist. 16, 629–640. doi:10.1049/gtd2.12315
Yang, P., Tang, G., and Nehorai, A. (2013). A game-theoretic approach for optimal time-of-use electricity pricing. IEEE Trans. Power Syst. 28 (2), 884–892. doi:10.1109/tpwrs.2012.2207134
Yang, Z., and Wang, L. (2016). Demand response management for multiple utility companies and multi-type users in smart grid[C]//Chinese Control Conference. China: IEEE, 10051–10055.
Yu, X., Xu, X., Chen, S., Wu, J., and Jia, H. (2016). A brief review to integrated energy system and energy internet [J]. Trans. China Electrotech. Soc. 31 (01), 1–13. (in Chinese). doi:10.19595/j.cnki.1000-6753.tces.2016.01.002
Keywords: integrated energy market, evolutionary game, user’s comprehensive energy consumption behavior, subjective and objective combination weighting method, user utility model, evolutionary equilibrium
Citation: Zhu XF, Yao JW, Xie QY, Dai L, Yang CY, Wang HL, He Q, Deng L, Shen R and Zhou XX (2022) Research on the user comprehensive energy consumption decision-making method based on the evolutionary game. Front. Energy Res. 10:954250. doi: 10.3389/fenrg.2022.954250
Received: 27 May 2022; Accepted: 01 July 2022;
Published: 23 August 2022.
Edited by:
Tinghui Ouyang, National Institute of Advanced Industrial Science and Technology (AIST), JapanReviewed by:
Gaurav Sachdeva, DAV University, IndiaSandeep Kumar Duran, Lovely Professional University, India
Copyright © 2022 Zhu, Yao, Xie, Dai, Yang, Wang, He, Deng, Shen and Zhou. This is an open-access article distributed under the terms of the Creative Commons Attribution License (CC BY). The use, distribution or reproduction in other forums is permitted, provided the original author(s) and the copyright owner(s) are credited and that the original publication in this journal is cited, in accordance with accepted academic practice. No use, distribution or reproduction is permitted which does not comply with these terms.
*Correspondence: Jun Wei Yao, eWFvLTcyMTIxMEAxNjMuY29t