 Jin Zheng
 Yong-Hai Li
 Zhi-Ping Fan3,4
- 1School of Management, Henan University of Technology, Zhengzhou, China
- 2School of Business, Liaoning University, Shenyang, China
- 3School of Business Administration, Northeastern University, Shenyang, China
- 4National Frontiers Science Center for Industrial Intelligence and Systems Optimization, Northeastern University, Shenyang, China
With the rapid development of new energy vehicles (NEVs), the market competition in the NEV industry is becoming increasingly fierce. Selecting the right supplier has become a critical aspect for NEV manufacturers. Therefore, based on the user’s demand information, selecting a suitable NEV supplier to support the NEV manufacturer’s management decision is a noteworthy research problem. The purpose of this study is to develop an integrated method for demand-driven NEV supplier selection based on ontology–quality function deployment (QFD)–case-based reasoning (CBR). The method is composed of three parts: 1) construction of domain ontology of NEV component supplier selection criteria based on text information mining; 2) extraction of demand attributes and determination of their weight based on latent Dirichlet allocation (LDA) and Kano model, as well as determination of expected attributes and their weights based on QFD; and 3) selection of an NEV component supplier based on CBR. To illustrate the use of the proposed method, an empirical study on the supplier selection of the XP NEV manufacturer is given. This method is helpful in selecting the most suitable component supplier for NEV manufacturers and relevant decision-makers.
1 Introduction
The transportation sector accounts for 24% of global CO2 emissions, while fuel vehicles are an important source of greenhouse gases and pollutants (Wang et al., 2017; Luo et al., 2021). Compared with the fuel vehicle, the new energy vehicle (NEV) has significantly higher fuel efficiency and lower or even zero CO2 emissions (Teixeira and Sodre, 2018; Liu et al., 2021). Studies have shown that plug-in hybrid electric vehicles and hybrid electric vehicles can reduce CO2 emissions by about 30%, while in areas with a high proportion of hydro power, pure electric vehicles can reduce CO2 emissions by 90% (Wang et al., 2022; Yu et al., 2022). NEVs have the advantage of being green, low carbon, energy saving, and convenient (Cano et al., 2018; Xie et al., 2020; Hao et al., 2021). As an effective solution to face the global challenges of environmental pollution and energy shortages caused by traditional fuel vehicles, it has attracted the attention of governments all over the world (He 2016; Bastida-Molina et al., 2021). Governments have proposed various policies and invested a lot of money to support the promotion and application of NEVs (Adnan et al., 2017; Tan and Lin 2019). For example, the Chinese government has attached importance to the development of NEVs since the 1990s and listed NEVs as one of the strategic emerging industries in 2010 (Gong et al., 2013; Li and Jing, 2019; Tan et al., 2021). With the support of various policies of the Chinese government (such as purchase subsidies, special energy conservation, and emission reduction fund), the territory of the NEV industry has continued to expand, and 28 provinces in China have joined the ranks of NEV manufacturing (Gong et al., 2013; Lu et al., 2017; He et al., 2018; Kendall 2018). In 2020, China added more than 68,000 NEV-related enterprises, an increase of 85% compared with 2019. Meanwhile, NEV sales in China have also grown rapidly. In 2014, NEV sales have quadrupled compared with 2013. In 2020, NEV sales were 18.2 times those of 2014, accounting for 41% of the global NEV sales (Hao et al., 2021; Liu et al., 2021). With the rapid growth of NEVs, the competition in the NEV industry is becoming increasingly fierce, and NEV manufacturers are facing more and more challenges. In this case, it is difficult for NEV manufacturers to survive and develop entirely on their own research and development (R&D) investments and innovation capabilities (Huth et al., 2015; Lu et al., 2020). Therefore, the development of cooperation between NEV manufacturers and NEV component suppliers has become an inevitable trend of development (Fan et al., 2020). However, some procurement departments of NEV manufacturers have not fully introduced the supplier competition mechanism, and there are many problems such as an imperfect supplier evaluation system, strong subjectivity, and lack of consideration of user demands. For this, how to select the appropriate supplier from a large number of NEV component suppliers with varying capabilities and levels of the market has become an urgent problem for NEV manufacturers.
As a starting point in the NEV industry supply chain, the selection of an NEV component supplier directly determines the cost and quality of the whole supply chain and even the benefits of the enterprise (Hosseini and Sarder, 2019). Choosing a suitable NEV component supplier can effectively improve the performance, customer satisfaction, and overall benefits of NEV manufacturers; while the improper selection of a component supplier may lead to the loss of time, cost, and market share of NEV manufacturers (Büyüközkan and Çifçi, 2011; Ayağ and Samanlioglu, 2014; Eydi and Fazli, 2019; Hosseini and Sarder, 2019; Wang et al., 2021). For example, in 2016, due to potential safety hazards in Samsung SDI batteries, JAC had to temporarily suspend production of its pure electric vehicle IEV6S, resulting in JAC’s sales of this vehicle being significantly lower than expected. In 2021, due to the risk of fire in the power battery provided by Funeng Technology, BAIC recalled more than 30,000 pure electric vehicles, EX360 and EU400, and suffered huge economic losses. Thus, for NEV manufacturers, it is very important to choose a suitable component supplier from multiple component suppliers, which is the guarantee of their success (Khan et al., 2016; Liu et al., 2019). However, NEV manufacturers are different from traditional automobile manufacturers in terms of technology, sales service, corporate culture, and marketing mode, and their selection requirements and criteria for component suppliers are also different from those of traditional automobile manufacturers. Compared with the selection of a traditional automobile component supplier, NEV manufacturers pay more attention to the component suppliers’ R&D capabilities and technology, environmental protection capabilities, and supply nodes (Liu 2016; Xiao 2020). Meanwhile, for NEV manufacturers, NEV component suppliers are not only simple suppliers but also mutually beneficial partners, sharing information and coordinated development with them. Given this, it is difficult to apply the component supplier selection method of traditional automobile manufacturers to solve the selection problem of NEV manufacturers. Thus, it is necessary to develop a targeted method to select a suitable component supplier for NEV manufacturers.
At present, the studies on the selection of an NEV component supplier are still scarce, but some related research results can be found. These research results can be roughly divided into two aspects: one is the selection or evaluation criteria of suppliers in the automotive industry; the other is the supplier selection method in the automobile industry. Determining the appropriate criteria is an important part of the supplier selection decision. The selection criteria of suppliers in the automotive industry have been widely concerned by scholars. For example, Dargi et al. (2014) developed a framework to support the selection of semi-assembly component suppliers for automobile manufacturers, and they extracted key criteria for evaluating suppliers. Azizi et al. (2015) introduced the most important criteria and sub-criteria for selecting the best supplier in the automotive industry and used Fuzzy technology and TOPSIS to select suitable suppliers. Li et al. (2015) constructed an evaluation index system of component suppliers and proposed a supplier selection model so as to choose the best combination of component suppliers for automobile manufacturers. Lima-junior and Carpinetti (2016) divided the selection criteria of automobile clutch suppliers into priority level, critical level, complementary level, and costly level based on the method of fuzzy quality function deployment and information acquisition difficulty evaluation procedures so as to guide the final selection decision. Manelloa and Calabrese (2019) conducted an ex-post analysis of the main factors influencing the supplier selection process in the automotive industry. They add new empirical evidence by investigating the impact of corporate reputation factors in the supplier selection criteria. For the selection of a headlamp supplier, Jain et al. (2018) determined the selection criteria through literature review and interviews with industry experts and ranked the suppliers using AHP and TOPSIS. Mathiyazhagan et al. (2018) investigated and ranked the environmental criteria for green supplier selection in the Indian automobile industry on the basis of expert judgment and ranked the supplier selection criteria. You et al. (2018) summarized the general evaluation criteria of automobile suppliers through literature screening and found out the categories and key criteria that automobile manufacturers need to consider when selecting component suppliers. Dai and Zhu (2019) established an auto component supplier evaluation system that considers the three dimensions of quality, business, and development and comprehensive capabilities. They used the TOPSIS method to determine the weight of each index and judged the classification of suppliers. Gupta et al. (2019) proposed a framework for the selection of green suppliers in the automotive industry and formulated six environmental standards and three conventional standards. This framework could help decision-makers distinguish the selection criteria of green suppliers. Choosing an appropriate method is very important for the supplier evaluation. Currently, scholars have put forward some relevant methods and a variety of combination methods to evaluate and select suppliers. For example, Park and Lee (2017) proposed a supplier selection method for automotive chassis parts through a hybrid method of DEA and AHP. Dweiri et al. (2016) proposed a supplier ranking model for the automobile industry based on AHP. This method provided managers with insights into various factors that needed to be considered when selecting suppliers. Mou et al. (2018) constructed a sustainable auto-part supplier selection model and proposed a three-stage decision-making method based on a probability distribution-hesitant fuzzy linguistic set and group decision-making theory. Memari et al. (2019) proposed an intuitionistic fuzzy TOPSIS method to select the appropriate automotive catalytic converter supplier. Liu et al. (2019) proposed a fuzzy three-stage integrated MCDM method for sustainable NEV part supplier selection. Zhou et al. (2019) proposed a multi-objective optimization model of auto-part suppliers considering customer complaints, and the multi-attribute utility theory and linear weighting method were used to obtain the optimization results. Wang et al. (2021) proposed a battery supplier selection framework for electric vehicles based on MCDM. In this framework, the MULTIMOORA method is used to sort the alternatives. Wu et al. (2020) proposed a hybrid framework that combines interval type 2 fuzzy sets, k-fuzzy measure, and Choquet integral operator to select the optimal green supplier in the electric vehicle industry. Liu et al. (2021) proposed a hybrid fuzzy symmetric MCDM model, integrating fuzzy linguistic set, the best and worst method, prospect theory, and VIKOR. The model could help NEV manufacturers select innovative power battery suppliers. Ilyas et al. (2021) used the integrated MCDM method based on BWM and FTOPSIS to consider the risks associated with COVID-19 so as to support the selection of suppliers in the automotive industry.
From the abovementioned literature review, we find that the related research provides some methods and ideas that can be used as a reference for this paper, such as the construction of a criteria system for NEV supplier selection. However, relevant methods and technologies in the existing research can only solve part of the problem in the selection of an NEV supplier, and there are still certain limitations, given as follows: 1) most of the existing studies focus on the selection of a traditional automobile component supplier, while the relevant methods and technologies to solve the problem of NEV component supplier selection are still obviously scarce (Galankashi et al., 2016; Hendiani et al., 2020). The method and criteria of component supplier selection for traditional automobile manufacturers are different from those for NEV manufacturers. For example, environmental protection capability and collaborative capability are less considered in the selection process of the traditional automobile supplier. In addition, most of the existing studies only focus on partial problems in the process of supplier selection, rather than systematically solving the problem of supplier selection, and select the best supplier based on the comprehensive performance of suppliers, without considering the indispensable subjective preference of decision-makers. 2) In terms of problem-solving methods, most of the existing studies solve the supplier selection problem based on the MCDM method. However, some common MCDM methods have certain limitations, such as the AHP method is highly subjective, the ranking has irregularities, and the use of additive aggregation may cause information loss; in the TOPSIS method, Euclidean distance is used to measure the distance between two schemes, and the correlation of decision criteria is not considered; some assumptions in DEA may not always be correct in reality; the weight of decision criteria in the VIKOR method is determined by the decision-maker subjectively, and there is no paired comparison between decision criteria and alternatives (Konidari and Mavrakis, 2007; Noori et al., 2021). 3) In terms of the supplier selection decision, most of the existing studies retrieve supplier case information through keyword matching and attribute similarity calculation so as to select component suppliers, which may result in problems such as low retrieval efficiency and low retrieval accuracy due to the lack of consideration of the semantic relations among keywords or attributes (Zhao and Yu 2011). 4) In terms of supplier selection criteria and their weight determination, most of the existing studies use the cited frequency or questionnaires to determine selection criteria, failing to fully consider the logic and semantic relationship of selection criteria (for example, product quality and quality are synonymous), which easily affects the efficiency of the supplier selection decision (Tavana et al., 2021). In addition, the weights of selection criteria in the existing studies are mostly derived from the subjective preferences of decision-makers and fail to fully consider the demands of users or objective data information. 5) In terms of acquiring and processing users’ demands, most of the existing studies collect users’ demands through questionnaires or structured scales. This easily restricts the expression of users’ demands, leading to insufficient consideration of users’ demands. In addition, the existing studies usually only focus on sentiment words of different sentiment polarities expressed in users’ demands or the proportions of different sentiment polarities (Balazs and Velásquez 2016) and fail to fully consider the different strengths of sentiment polarities. It is easy to cause the loss of information and one-sided sentiment consideration. 6) In terms of transforming user demand attributes into expected attributes toward suppliers, most of the existing studies only rely on the domain knowledge and experience of experts (Yang and Chai, 2018; Deng et al., 2021) and fail to integrate objective information, such as academic literature, industry standards, etc., which are highly subjective.
To overcome these limitations, it is necessary to develop a novel method to select a suitable component supplier for NEV manufacturers so as to enrich the relevant theory and method. Specifically, the purpose of this study is to solve the following three questions:
1) How to intelligently construct the ontology of selection criteria of the NEV component supplier so as to support the selection decision of component supplier for NEV manufacturers?
2) How to organize and mine user demand information concerning NEV and incorporate it into the weights of the supplier selection criteria so as to avoid information loss and reduce the interference of subjective factors in the calculation process?
3) How to realize the case information retrieval of component suppliers and improve the retrieval efficiency under the condition of considering the expectations of a decision-maker?
To address the abovementioned questions, we propose an integrated method for demand-driven NEV supplier selection based on ontology–quality function deployment (QFD)–case-based reasoning (CBR). In the method, the literature on the selection of the NEV component supplier is first preprocessed. Second, the domain concepts are extracted using the latent Dirichlet allocation (LDA), and the hierarchical agglomerative clustering (HAC) algorithm and association rules are used to extract the relations between domain concepts so as to construct the domain ontology of selection criteria of the NEV component supplier. Then, demand attributes are extracted from the demand documents provided by users with different demands using LDA, and the initial weights of demand attributes are determined based on the sentiment strength analysis algorithm and information entropy method. On the basis of this, the categories of demand attributes and the final weights of demand attributes are determined based on the Kano model and the Better-Worse coefficient. Furthermore, the expected attributes and their weights of NEV component supplier selection are determined based on QFD, and the semantic similarity of ontology concepts and attribute similarity are calculated based on CBR and ontology theory. Based on the hybrid similarity, the NEV component supplier is selected. Obviously, the proposed method enriches and develops the existing benchmark methods (such as the traditional sentiment analysis method and the traditional hybrid similarity calculation method) and has distinct characteristics and advantages in the construction of selection criteria for the NEV component supplier, the processing of user demand information, and the retrieval of NEV component supplier cases, which can help improve the rationality and efficiency of the selection decision of the NEV component supplier and address other similar issues (e.g., product design scheme optimization and case knowledge retrieval).
The remainder of this paper is organized as follows. Section 2 gives a description of the problem. In Section 3, the architecture of the demand-driven NEV supplier selection system is designed. Section 4 presents a solution framework and a method for demand-driven NEV supplier selection. In Section 5, an empirical study on the selection of a component supplier for the XP NEV manufacturer is given to illustrate the use of the proposed method. Finally, the conclusions of this study and the directions for future research are presented in Section 6.
2 Problem description
To clearly describe the problem of NEV supplier selection, the notations are defined as shown in Table 1.
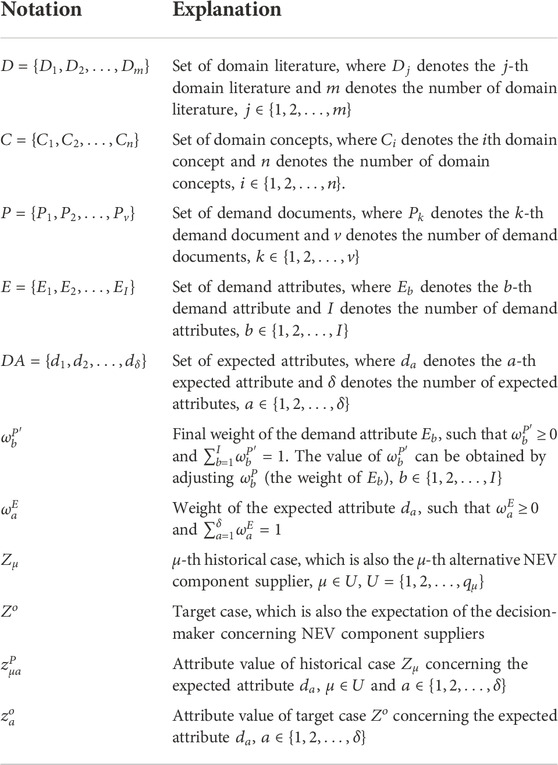
TABLE 1. Notations frequently used throughout this paper.
The problem concerned in this study is how to construct the domain ontology of the selection criteria for NEV component suppliers, determine
3 Demand-driven NEV supplier selection system
To address the above mentioned problem, the architecture of a demand-driven NEV supplier selection system is designed, as shown in Figure 1. The architecture of the system is divided into four layers: the user layer, the application layer, the business logic layer, and the data access layer. The user layer is the communication link between the user and the system, which is used to connect the main objects served by the system. Different objects can access different functional modules and participate in the requirement survey and the NEV supplier selection and evaluation process. The application layer consists of eight critical functional components: domain concept extraction module, domain ontology management module, user demand acquisition module, QFD module, case retrieval module, system management module, model and information management module, and case management module. This layer provides a series of key procedures that enable the system to support the NEV supplier selection decision. The business logic layer mainly provides the interface for system operation, allowing different users to complete the corresponding operation of the system. This layer uses Protégé to define the domain ontology, extracts the abstract semantic elements of the domain ontology to represent the cases, and implements case retrieval by considering user demands to obtain the ranking results of the suppliers. The data access layer uses MySQL as the main database management system to realize the storage of data by category.
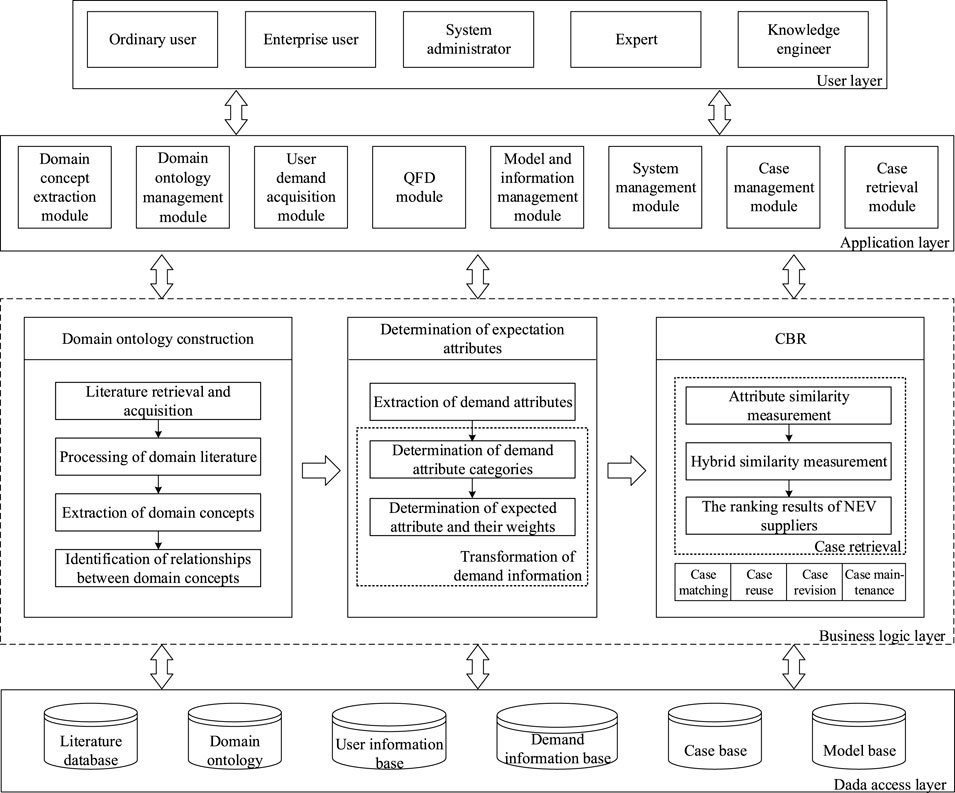
FIGURE 1. Architecture of the demand-driven NEV supplier selection system.
The brief explanation of each functional component is given as follows:
• Domain concept extraction module: the main function of domain concept extraction is to select relevant domain literature from the literature database and extract domain concepts and relationships between domain concepts based on text mining. Since the existing literature on NEV supplier selection and evaluation has the characteristics of large quantity, knowledge dispersion, and multi-source heterogeneity, an effective method to solve the sharing, exchange, and integration of heterogeneous information, that is, ontology, is adopted. According to relevant scientific literature, the selection and evaluation criteria of suppliers are determined based on ontology. Applying knowledge management practices to supply chain management may greatly improve organizational performance.
• Domain ontology management module: the main function of domain ontology management is to model and maintain the domain knowledge about NEV supplier selection criteria so as to make the constructed domain ontology more comprehensive and complete. The quality of the domain ontology affects the determination of the expected attributes and the selection decision of the NEV supplier, so the setup of the domain ontology management module is necessary.
• User demand acquisition module: the main function of user demand acquisition is to collect users’ demands in the form of network documents, extract demand attributes from the demand documents, and use user demands as reference factors for NEV supplier selection. For NEV manufacturers, focusing on user demands can improve their competitive and strategic advantages. Therefore, the acquisition and analysis of user demands are important in supplier selection. In addition, collecting user requirements in the form of network documents can enable users to fully express their demands and make the obtained demand information more comprehensive.
• QFD module: the main function of the QFD module is to investigate and analyze user demands for NEV through a systematic approach and convert them into expected attributes concerning supplier selection. Full consideration of user demands is an effective way to rationally select NEV suppliers. It is helpful for NEV manufacturers to improve product quality and increase customer satisfaction by considering user demands to make an NEV supplier selection decision.
• Case retrieval module: the main function of case retrieval is to search the case base by using the similarity calculation method according to the relevant description of the alternative NEV supplier and then obtain the ranking of the alternative NEV suppliers based on the calculation results. Case retrieval is the most important step in the process of CBR, which can realize the real-time retrieval and related queries of cases in the case base.
• System management module: the main function of system management is user management and system settings. The system divides users into five categories based on permissions. An ordinary user can participate in market research and provide demand documents. An enterprise user can determine the case retrieval conditions according to the terms in the domain ontology and the current case, search the case library, and obtain the ranking results of the NEV supplier. Experts and knowledge engineers can assist in building domain ontology based on the processing results of text information, building case bases according to domain ontology and user demands, and managing and maintaining case bases. The system administrator is responsible for managing user permissions.
• Model and information management module: the information in the databases is the basis for implementing the system functions. The main functions of model and information management are to construct and update various calculation formulas in the model base and update and maintain all types of data in the databases.
• Case management module: the main function of case management is to build the case representation and retrieval mechanism and manage and maintain the case base. Since the case base is the basis for realizing case reasoning, the effectiveness of a supplier selection decision depends on the quality of cases, the representation method of case knowledge, and the retrieval mechanism to a large extent. Therefore, the setting of the module is necessary to ensure the continuous updating of the case base and better serve case retrieval.
4 Method for demand-driven NEV supplier selection
Based on the architecture of demand-driven NEV supplier selection system, we propose a resolution process, as shown in Figure 2. The resolution process is composed of three parts, that is, 1) construction of domain ontology of selection criteria for the NEV component supplier; 2) determination of demand attributes and expected attributes as well as their weights; and 3) selection of the NEV component supplier based on CBR. In the first part, the literature on the selection of the NEV component supplier is preprocessed, and the domain concepts are extracted using LDA. Then, the relations between domain concepts are extracted based on the HAC algorithm and association rules. Furthermore, the domain ontology of the selection criteria for NEV component suppliers can be constructed. In the second part, demand attributes are extracted from the demand documents provided by users with different demands using LDA, and the initial weights of demand attributes are determined based on a sentiment strength analysis algorithm and the information entropy method. Then, the categories of demand attributes and the final weights of demand attributes are determined based on the Kano model and the Better-Worse coefficient. Furthermore, the expected attributes of NEV component supplier selection are determined based on QFD. On the basis of this, the relationship matrix between the demand attributes and the expected attributes is constructed, and the weights of the expected attributes are determined. In the final part, based on CBR and ontology theory, the attribute similarities and hybrid similarities between the alternative cases (i.e., NEV component suppliers) and the target case (i.e., the expectation of decision-makers) are calculated, and the NEV component supplier with the largest hybrid similarity is selected.
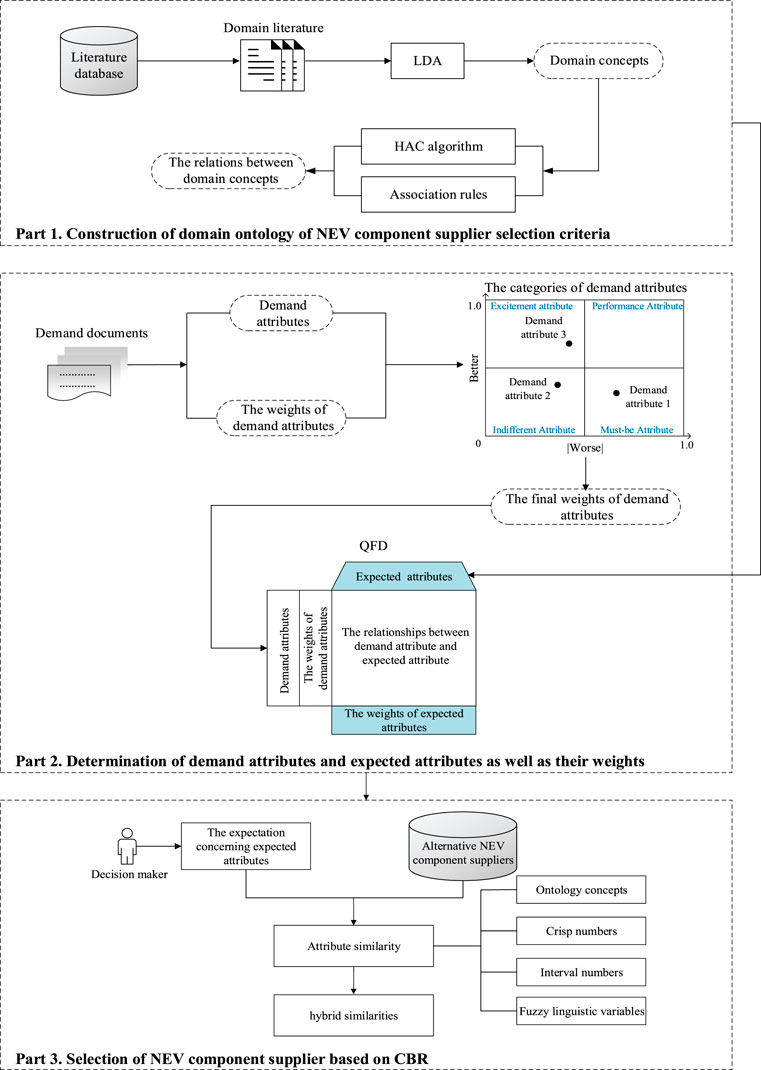
FIGURE 2. Resolution process for the problem of demand-driven NEV supplier selection.
According to the resolution process shown in Figure 2, a description of the proposed method for demand-driven NEV supplier selection will be given in this section. The detailed descriptions of each part are, respectively, illustrated in Section 4.1, Section 4.2, and Section 4.3.
4.1 Construction of domain ontology of selection criteria for the NEV component supplier
In this section, the construction process of the domain ontology of selection criteria for the NEV component supplier includes four aspects: 1) representation of case knowledge based on ontology, 2) acquisition and preprocessing of text information, 3) extraction of domain concepts based on LDA, and 4) extraction of relationships between domain concepts.
4.1.1 Representation of case knowledge based on ontology
The ontology representation of case knowledge is the basis for realizing case knowledge retrieval, and it is also the basis for the selection of the NEV component supplier in this paper. In ontology, a framework system is used to describe the relationship between objective concepts, and the semantic association rules between concepts are defined to realize the communication and sharing between knowledge systems (Yoo and No, 2014; Lee et al., 2015). The ontology-based case knowledge representation method is easy to deal with structured knowledge, which can ensure the uniqueness of knowledge understanding. It is suitable for knowledge retrieval with complex semantic relations. The integration of ontology and CBR can improve the efficiency and accuracy of case retrieval (Küçük, 2015).
In this paper, the domain ontology of selection criteria for the NEV component supplier can be represented by the following tuple:
where
There are three main steps to construct the domain ontology: 1) obtain domain concepts; 2) obtain the relationship between concepts; and 3) construct the ontology of tree structure (Guo and Zhou, 2017). Therefore, it is necessary to acquire domain concepts before constructing a domain ontology.
4.1.2 Acquisition and preprocessing of text information
To ensure the standardization and professionalism of domain concepts, domain concepts are extracted from academic literature in this paper. The academic literature is a type of knowledge resource with high professional value, and it is a relatively standard text form (Liu et al., 2011; Ren, 2012). The domain academic literature contains authoritative data such as domain ontology terms, concepts, and concept relationships. Due to its accessibility and high coverage in the research field, it is possible to construct a relatively complete domain ontology based on academic literature, and the domain ontology constructed is normative and professional (Tang et al., 2020). Therefore, academic literature is used as the source of domain concepts. The detailed description of the acquisition and preprocessing of academic literature is as follows.
First, “NEV,” “selection and evaluation of supplier,” and “automotive industry” are used as keywords, and “2015–2021” was used as search years to search databases, such as China National Knowledge Infrastructure (CNKI), WanFang database, ScienceDirect, and Web of Science. Manually search and download the literature on the selection criteria of the NEV component supplier, and remove duplicate literature in the retrieved literature.
Then, according to the set standards, the source literature of a domain concept is selected from the collected literature, that is, 1) for papers with multiple publications or citations, only one paper is selected; 2) for the review literature, the original literature in the reference list within the retrieval period is taken as the statistical literature; and 3) literature from various core journals or senior authors. For papers that meet the standards, the titles, keywords, abstracts, and text contents are saved, and they are regarded as domain literature. For the convenience of description, let
Furthermore, the domain literature is preprocessed, which includes two steps, that is, 1) word segmentation and part-of-speech (POS) tagging, and 2) text data filtering. The details are given below.
4.1.2.1 Word segmentation and POS tagging
The Chinese Lexical Analysis System (ICTCLAS) and the Natural Language Toolkit (NLTK) are adopted to carry out word segmentation and POS tagging in domain literature
4.1.2.2 Text data filtering
To improve the training efficiency of the LDA topic model and the quality of the acquired domain concepts, it is necessary to sequentially perform paragraph filtering, stop word deletion, and POS filtering on domain literature
1) Paragraph filtering. The text content of each domain literature
2) Stop word deletion. Stop words are words that appear frequently, but they have no practical meaning and cannot reflect domain-specific knowledge. To improve efficiency, the Chinese stop word list (CSWL) and English stop word list (ESWL) are used to delete the stop words in domain literature
After preprocessing the domain literature
4.1.3 Extraction of domain concepts based on LDA
In this section, a brief introduction of the LDA topic model is first given. Then, the process of extracting domain concepts based on LDA is illustrated.
4.1.3.1 LDA topic model
LDA is a three-layer Bayesian probability model that contains a three-layer structure of words, topics, and documents (Blei et al., 2003). It can be used to identify the topic information hidden in large-scale document sets or corpora and to effectively extract the key information from the text (Tirunillai and Tellis, 2014; Guo et al., 2017). The LDA model is a typical directed probability graph model, which is determined by the hyper parameters
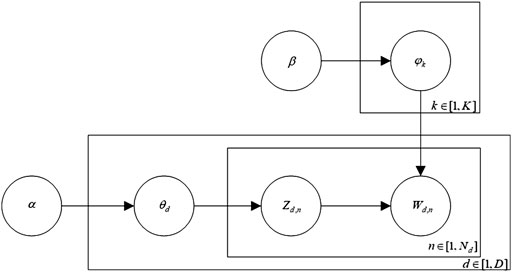
FIGURE 3. Probability map of the topic extraction model.
In Figure 3,
The topic is regarded as the middle layer. Through the probability of a certain topic in the document and the probability of a certain word in this topic, the probability of the word in the document can be obtained (Qian et al., 2016; Bi, Liu, Fan, and Cambria 2019). It can be expressed as a probability formula, that is,
where doc denotes a document, topic denotes a topic, and word denotes a word.
4.1.3.2 The process of extracting domain concepts based on LDA
Domain concept extraction is an important part of domain ontology construction. Usually, domain concepts are those terms that are widely distributed and used more frequently in domain-related data and are less used in non-domain-related data (Zheng et al., 2019). Existing studies show that extracting domain concepts from academic literature conforms to the characteristics of LDA training text. Meanwhile, the LDA model has many advantages, such as flexibility and easy expansion, and has good domain portability (Feng and Zhang, 2017). Therefore, the LDA model is used to extract domain concepts in this paper. The details are given as follows.
Step 1. Let
where
Step 2. Use Python and the LDA package in Sklearn to train the LDA model. In general, the hyper parameters
where
Step 3. Solve the trained LDA model to obtain the domain topic distribution. The candidate concept set is composed of all domain topics, noted as
Step 4. Calculate the term frequency–inverse document frequency (TF-IDF) of the word
where
4.1.4 Extraction of relationships between domain concepts
The extraction of relationships between domain concepts is the most important step in domain ontology construction, which determines the final domain ontology structure (Zheng et al., 2019). There are two kinds of relations between domain concepts, namely, taxonomic relation and non-taxonomic relation. The taxonomic relation refers to the typical classification structure between domain concepts, such as “kind of.” The non-taxonomic relation refers to domain concepts that do not have a typical classification structure between concepts but have certain connections between concepts, such as “synonymous of.” In this paper, the HAC method and association analysis method are used to obtain the relationships between domain concepts (Han et al., 2019). The details are described as follows.
4.1.4.1 Mining taxonomic relation between domain concepts
Due to the variety of words, it is difficult to extract the relationship between many domain concepts based on linguistics, while clustering method can make up for this deficiency (Li et al., 2018). Therefore, this study uses the HAC method to mine the taxonomic relation between domain concepts.
First, the vector space model is used to construct the concept–document matrix (Castells et al., 2007). Since TF-IDF can measure the importance of a word to a document set, the vector space model of a domain concept can be constructed based on TF-IDF so as to describe the vector of a domain concept more comprehensively. The vector of domain concept,
where
Then, the cosine distance method is used to calculate the similarity
Furthermore, the semantic similarity matrix
The specific clustering process is given as follows.
Step 1Construct the vector
Step 2Using average-linkage (AL) hierarchical clustering as the distance between
where
Step 3Select the two clusters
Step 4If the number of clusters in cluster set
Step 5Clustering is completed, output cluster set
where
4.1.4.2 Mining non-taxonomic relation between domain concepts
The traditional association rules can only obtain the non-taxonomic relation between domain concepts but cannot obtain the specific relationship name (Agrawal et al., 1996). Usually, the non-taxonomic relation between domain concepts is composed of a verb and a pair of domain concepts, so this structure is used as the main extraction object, and verbs are used as the non-taxonomic relation between domain concepts to improve the traditional association rules in this study (Dong et al., 2013). The related domain concept pair set can be represented as
Step 1. Randomly select two concepts
Step 2. Calculate the support
where
Step 3. Set the threshold of support and confidence, that is,
Step 4. Count all the verbs
Step 5. If the frequency of
Step 6. After manually checking all the verbs, output the domain concept pair set
4.2 Determination of demand attributes and expected attributes as well as their weights
Based on the constructed domain ontology, demand attributes and expected attributes as well as their weights are determined, including the following three aspects: 1) determination of demand attributes and their weights, 2) determination of demand attribute categories and expected attributes, and 3) construction of a relation matrix and determination of expected attribute weights.
4.2.1 Determination of demand attributes and their weights
In this section, the process of extracting demand attributes from demand documents based on LDA is first illustrated. Then, the process of determining demand attribute weights is given. The detailed descriptions are given as follows.
4.2.1.1 Extracting demand attributes from demand documents based on LDA
The textual contents in demand documents for NEV component suppliers provided by users not only contain the words concerning demand attributes but also contain a lot of noisy and irrelevant words. To improve the effectiveness and efficiency of extracting demand attributes, demand documents are first preprocessed. Let
Similar to domain concept extraction, topics can be extracted from preprocessed demand documents based on steps 2–4 in the process of extracting domain concepts. Since there may be some noisy words and topics with similar meanings in the extracted topics, in order to get more reasonable results, the noise words can be filtered manually, the topics with similar meanings can be merged, the important topics can be selected, and each topic can be labeled. Following Poria et al. (2016) and Bi et al. (2019), each extracted topic can be regarded as a demand attribute. Then, the set of labeled topics (i.e., demand attributes) and the set of words concerning each topic can be determined. The determined demand attribute
4.2.1.2 Determining the weights of demand attributes
Usually, the demand information reflected in the demand document corresponds to multiple demand attributes. Hence, it is necessary to identify the demand information with respect to each demand attribute so as to determine the weight of each demand attribute. In accordance with the obtained word set
Based on the demand information concerning demand attributes, the multi-granularity sentiments with respect to demand attributes reflected by users in their demand documents can be identified. Generally, the word sets of sentiment strength with respect to different demand attributes may be different. Therefore, in order to improve the accuracy of sentiment analysis, a sentiment dictionary with respect to demand attributes needs to be established. Let
To identify the sentiment polarity of users concerning demand attributes, HowNet (http://www.keenage.com/) was introduced to establish positive and negative sentiment dictionaries with respect to demand attributes. Let
For some words in
Let
Step 1. If
Step 2. If
Step 3. If
Step 4. If
Step 5. If
Step 6. If
Furthermore, the expected values of
On the basis of this, the information entropy method is adopted to calculate demand attribute weights (Chen 2020). Generally, the smaller the information entropy of
where
In Eq. 20,
4.2.2 Determination of demand attribute categories and expected attributes
The analysis of demand attributes can promote the determination of expected attributes. In this section, the Kano model is used to further analyze the demand attributes, which helps to determine the categories and priority of demand attributes so as to determine the expected attributes of NEV component suppliers efficiently (Kano et al., 1984).
The Kano category of each demand attribute can be determined by designing a two-factor questionnaire and counting the results of the questionnaire (Matzler and Hinterhuber, 1998). In the designed questionnaire, there are five response options for each demand attribute, and the questions are in the form of forward and reverse, as shown in Table 2, that is, the satisfaction of users when NEV component suppliers have the demand attribute
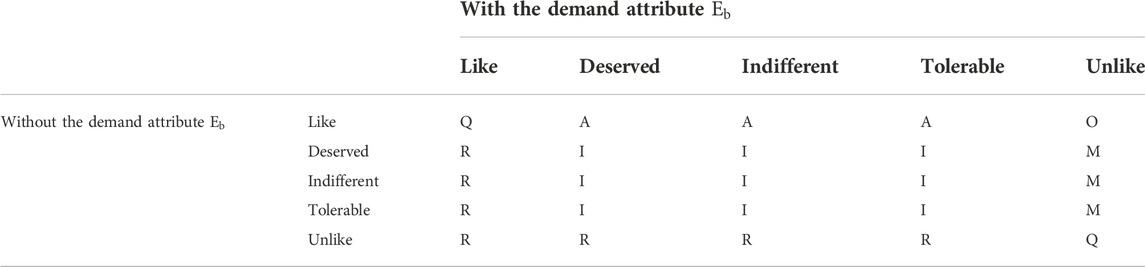
TABLE 2. Kano categories concerning demand attributes.
However, the traditional Kano model takes “the choice of the majority of users” as the final category of each demand attribute, which fails to consider the influence of the distribution of other attribute categories. In addition, there are some unavoidable problems in the process of data statistics. For example, there are many demand attributes in the same Kano category, and the priority cannot be determined. To solve these problems, the Better-Worse coefficient is calculated based on the traditional Kano model (Berger et al., 1993), and various categories of demand attributes are comprehensively considered. Specifically, according to the questionnaire survey results, the percentages of demand attribute categories can be counted (
where
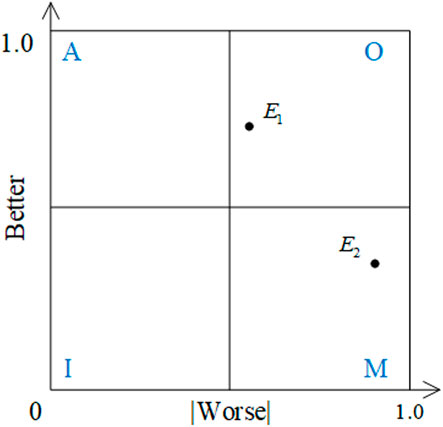
FIGURE 4. Better-worse coefficient quadrant chart.
Furthermore, the final weight of the demand attribute,
where
Based on the domain ontology constructed in Section 4.1 and the categories of demand attributes determined earlier, the demand attribute
4.2.3 Construction of the relationship matrix and determination of expected attribute weights
Based on the determined demand attributes and expected attributes, the degrees of correlation between demand attributes and expected attributes can be evaluated by the expert group. Let
Then, the importance weight and the weight of the expected attributes
Furthermore, the relationship matrix
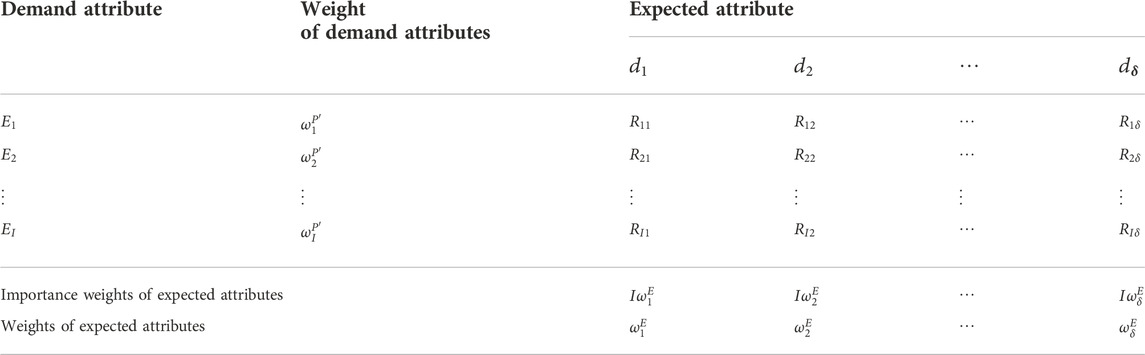
TABLE 3. Relationship matrix between
4.3 Selection of the NEV component supplier based on CBR
Case retrieval is usually regarded as the most important step in CBR (Tadrat et al., 2012). The target of this process is to retrieve those cases in the case base that are closest to the new problem. To achieve this aim effectively, the similarities between the target case and the stored cases are measured (Homem et al., 2020). In this section, the expectation given by the decision-maker is taken as the target case, and the alternative NEV component suppliers are taken as the historical cases. By calculating the attribute similarity and hybrid similarity between the target case and the historical cases, the NEV component supplier that meets the expectations of the decision-maker is selected.
4.3.1 Attribute similarity measure for each format of attribute value
In case retrieval, there are usually multiple attributes involved, which may have different attribute value formats. In this study, four common attribute value formats are considered in NEV component supplier selection: ontology concepts, crisp numbers, interval numbers, and fuzzy linguistic variables. The attribute values of historical cases and target cases of the same expected attribute are expressed in the same format. Let
Considering the four attribute value formats, the method of measuring expected attribute similarity for each attribute value format is given as follows.
4.3.1.1 Attribute similarity measurement for ontology concept format attribute values
For
where
In Eq. 28,
However, the similarity algorithm based on semantic distance does not fully consider the factors that affect the similarity between ontology concepts, which may affect the accuracy of the case retrieval results (Wen et al., 2017). To improve the accuracy of the case retrieval results, the two factors that affect the similarity are considered, that is, the node depth and node density. The concept node depth is the number of sides included in the shortest path between the concept node and the root node. The semantic similarity of ontology concepts can be calculated using the node depth (Zhang et al., 2013), that is,
where
Furthermore, the semantic similarity of ontology concepts can be calculated using the node density (Wen et al., 2011), that is,
where
By comprehensively considering the influence of various factors of the concept semantic similarity, the concept semantic similarity between the historical case
where
4.3.1.2 Attribute similarity measurement for crisp number format attribute values
For
where
4.3.1.3 Attribute similarity measurement for interval number format attribute values
For
where
4.3.1.4 Attribute similarity measurement for fuzzy linguistic variable format attribute values
For
where
Thus,
Next, the attribute similarity between
4.3.2 Hybrid similarity measurement
To retrieve and find the suitable NEV component supplier, the hybrid similarity needs to be measured. In accordance with the simple additive weighting method, the hybrid similarity between
Obviously,
5 Empirical study
An empirical study on the supplier selection of the XP NEV manufacturer is given to illustrate the use of the proposed method.
5.1 Case description
The XP NEV manufacturer was founded in 2014 and is headquartered in Guangzhou. It is mainly engaged in NEV products such as electric vehicles and hybrid electric vehicles. XP manufacturers started the X project in 2019 and set up an expert group consisting of three sales managers and three senior product design engineers. The group is mainly responsible for the development and design of the EV3 series electric vehicles and plans to mass-produce them in 2022. In the stage of product design, XP manufacturers plan to purchase some required components through outsourcing, such as a power battery, motor, motor controller, and sensor. For this, four component suppliers (
5.2 Selection process of the NEV component supplier
To help an XP manufacturer select a suitable component supplier to carry out the X project smoothly, the method proposed in this paper was carried out. Some key calculation processes and results are described as follows.
5.2.1 Construction of domain ontology
First, “NEV,” “selection and evaluation of supplier,” and “automotive industry” were used as keywords and “2010–2021” was used as search years, and relevant references on the selection and evaluation of NEV suppliers were retrieved from the CNKI, WanFang, ScienceDirect, and Web of Science databases. The duplicate references were removed, and the set of domain literature was obtained, that is,
Then, as shown in Figures 5, 6, the domain literature
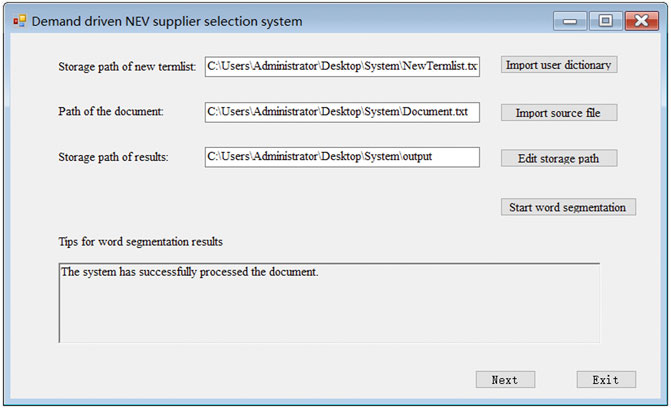
FIGURE 5. Text data word segmentation interface.
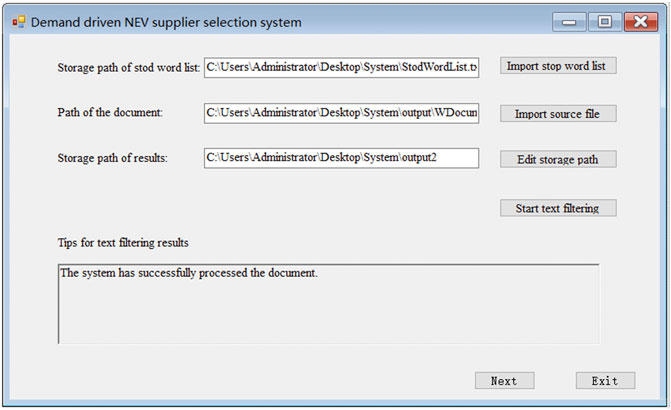
FIGURE 6. Stop word deletion interface.
According to the process of extracting domain concepts proposed in this paper, LDA was used to extract domain topics from the preprocessed domain literature, where the parameters of LDA were set as
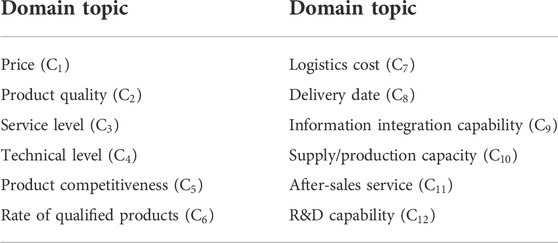
TABLE 4. Extracted domain topics based on LDA.
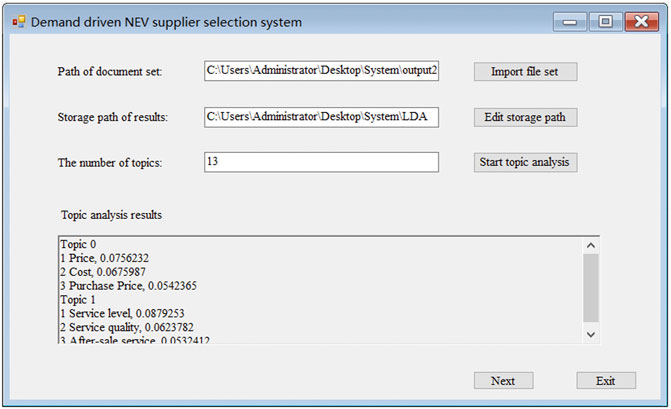
FIGURE 7. Topic analysis result interface.
According to the extracted domain concepts, the relations between domain concepts were extracted by the HAC algorithm and association rules. The results are shown in Figure 8 and Table 5 respectively. Then, the initial domain ontology of the NEV component supplier selection criteria could be obtained, and Protégé 5.2.0 software was used to visualize the initial domain ontology, as shown in Figure 9.
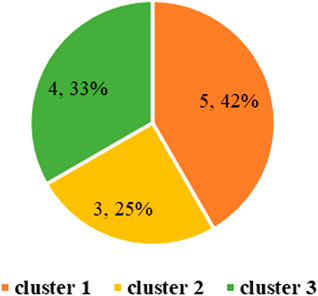
FIGURE 8. Clustering results of domain concepts.
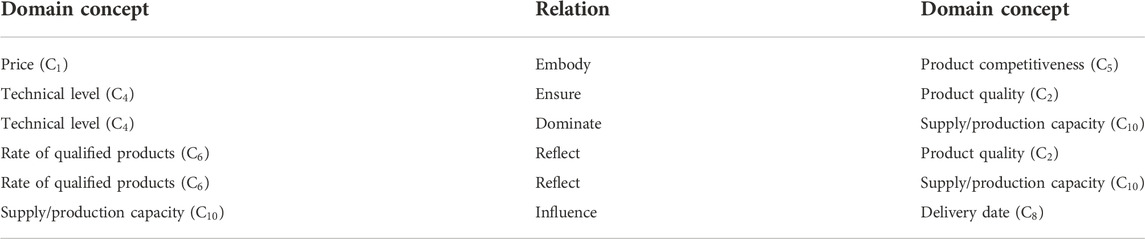
TABLE 5. Non-taxonomic relations of domain concepts.
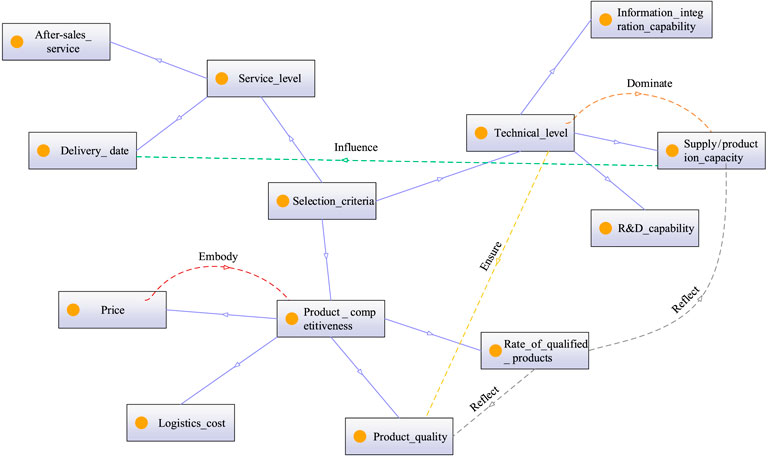
FIGURE 9. Initial domain ontology for NEV component supplier selection criteria.
To further enrich the initial domain ontology, NVivo 11 software was used to code and analyze the set of domain literature
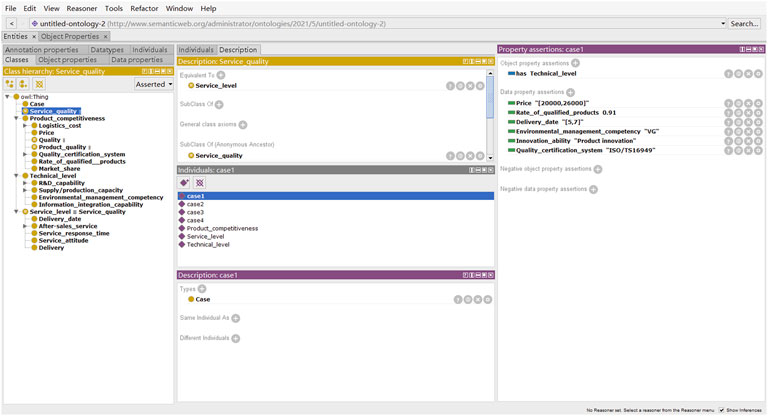
FIGURE 10. Domain ontology case for NEV component supplier selection criteria.
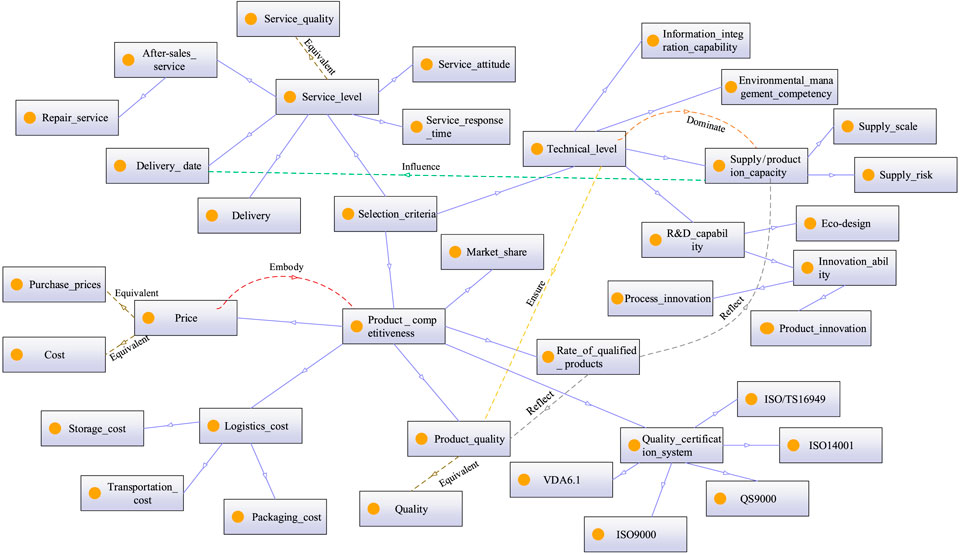
FIGURE 11. Domain ontology for NEV component supplier selection criteria.
5.2.2 Determination of expected attributes and their weights
By preprocessing 416 valid demand documents
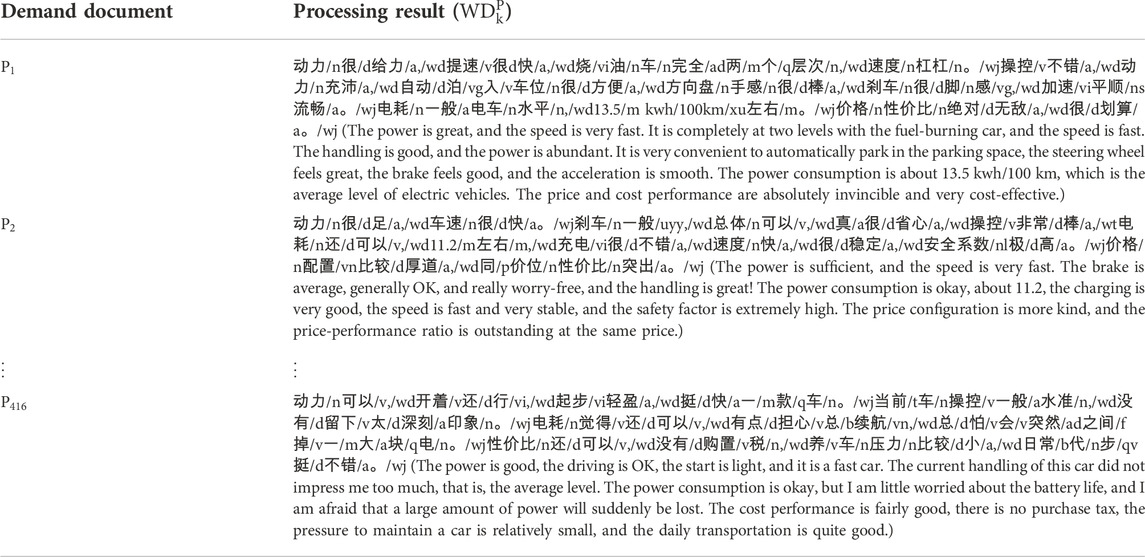
TABLE 6. Processing results of the demand documents of users.
Furthermore, the demand attribute
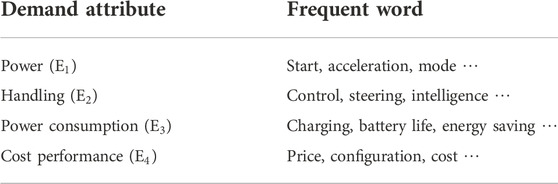
TABLE 7. Extracted demand attributes based on LDA.
Based on
Using Eqs 14–16, the positive sentiment dictionary and negative sentiment dictionary concerning demand attributes were established, that is,

TABLE 8. Main sentiment words included in
Using the proposed sentiment analysis algorithm, the sentiment strength of the demand document concerning each demand attribute, that is,
Furthermore, the value of
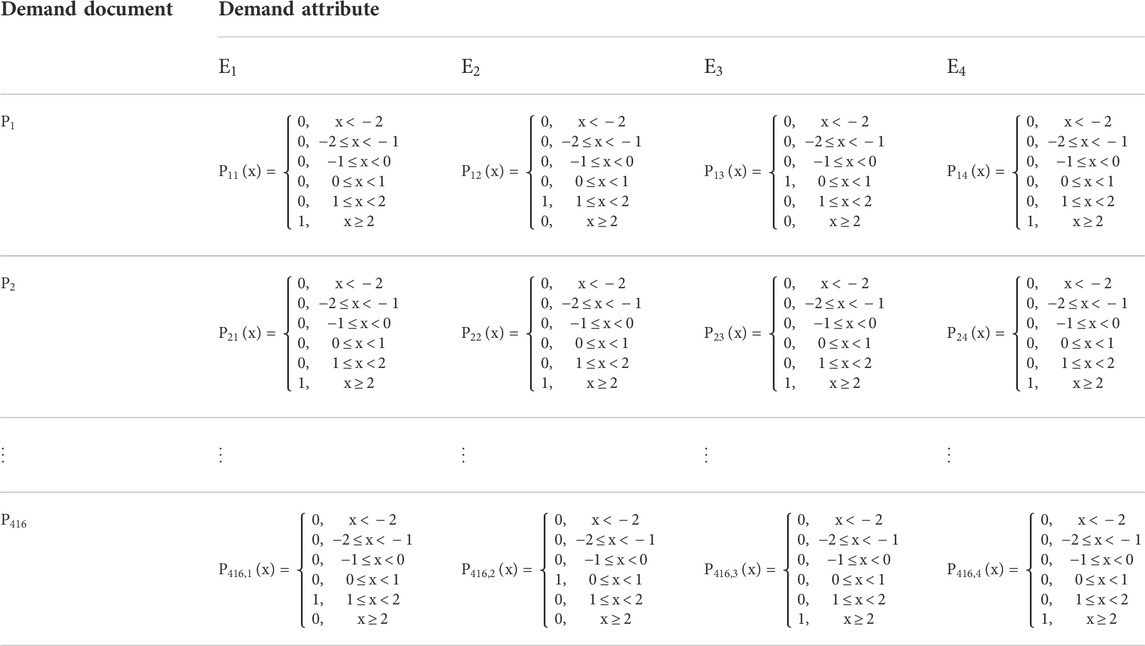
TABLE 9. Attribute value in the form of multi-granularity sentiment strength distribution.
Using Eqs 18–21, the weights of demand attributes were obtained, that is,
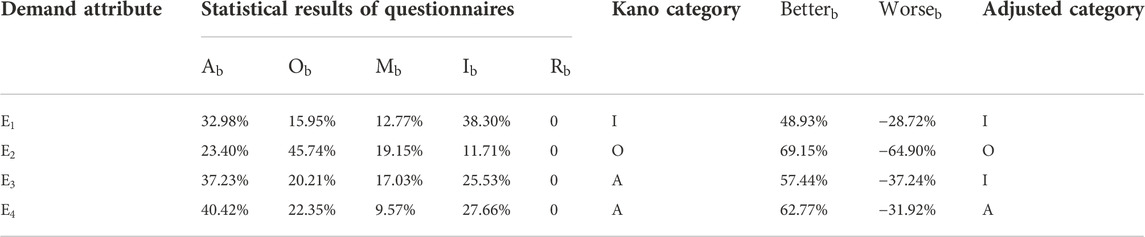
TABLE 10. Kano category of demand attribute
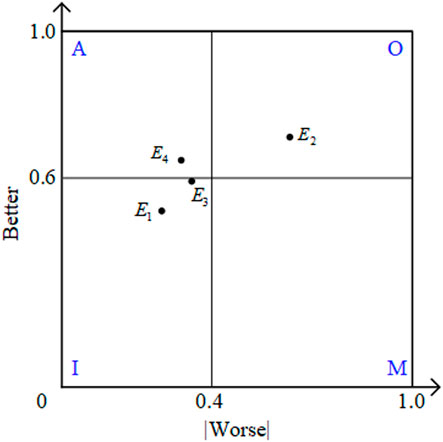
FIGURE 12. Better-Worse coefficient quadrant chart.
Using Eq. 24, the adjusted demand attribute weights were obtained, that is,
According to the constructed domain ontology and the Kano category of each demand attribute, the demand attributes were transformed into the expected attributes by an expert group, and the relevant description of the expected attribute is shown in Table 11. The correlation degree between the demand attribute and the expected attribute was evaluated by expert group discussion, that is,
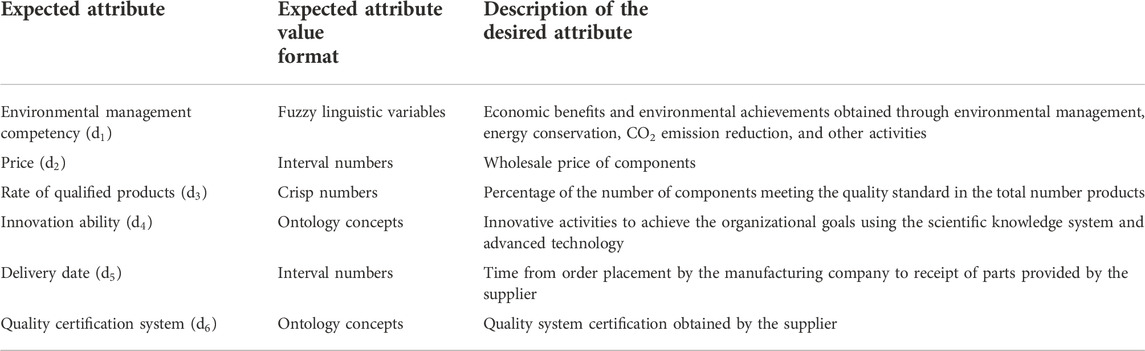
TABLE 11. Expected attributes and related descriptions.
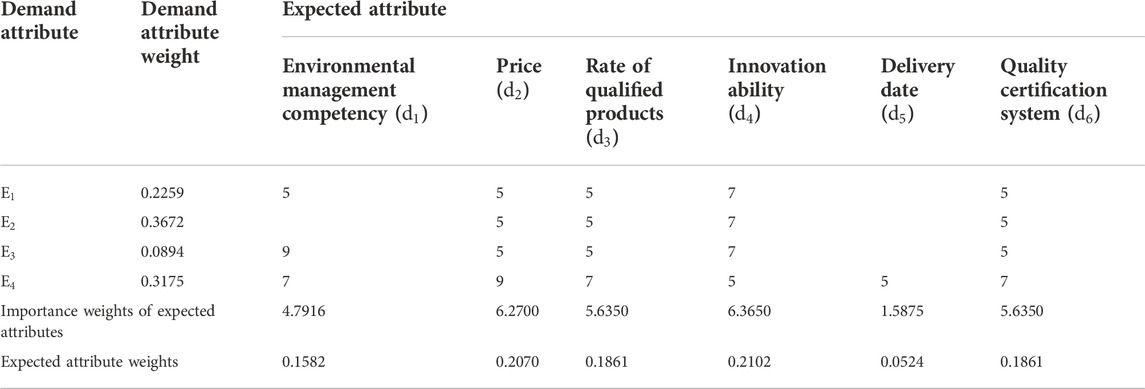
TABLE 12. Relationship matrix between demand attributes and expected attributes.
5.2.3 Selection of the NEV component supplier
According to
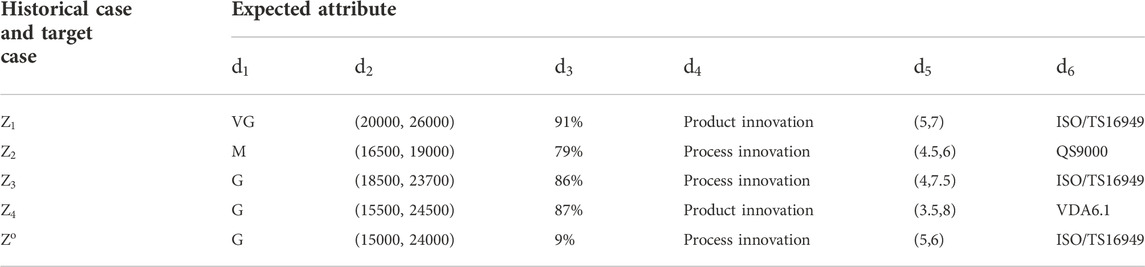
TABLE 13. Expected attribute values involved in historical cases and target case.
Using Eqs 27–38, the similarity between the historical case and the target case concerning
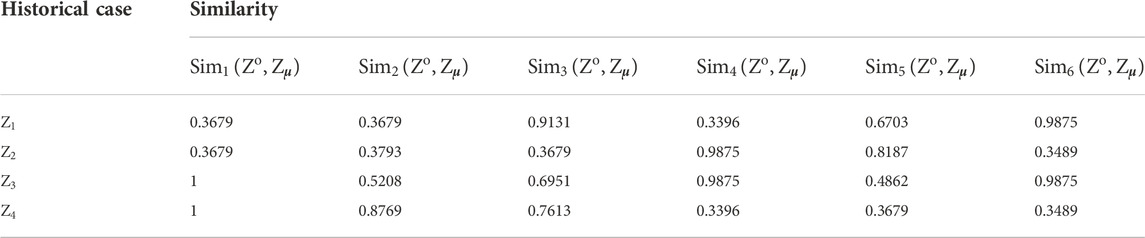
TABLE 14. Computation results of
Using Eq. 39, the hybrid similarity between the historical case and the target case, that is,
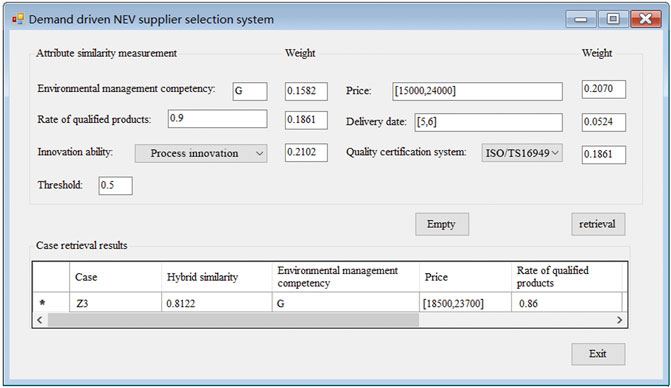
FIGURE 13. Screenshot of retrieval results.
5.3 Comparative analysis
In order to further analyze the advantages of the proposed method, we compare it with a similar method that was proposed by Yang and Chai (2018). Based on the case background and original data in this study, the method in this literature (Yang and Chai 2018) was used, and the ranking results of the alternative NEV component suppliers were
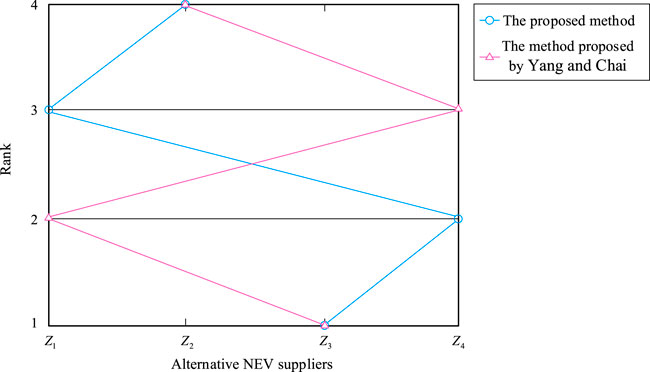
FIGURE 14. Ranking of the alternative NEV suppliers obtained by different methods.
In addition, in terms of acquiring demand attributes, Yang and Chai (2018) obtain demand attributes through questionnaires, which cannot fully reflect the complex thoughts and opinions of users on a demand and are costly and expensive, while demand documents are collected through the network in this study and demand attributes are obtained by mining demand documents. This makes the user’s demand expression unconstrained, thereby improving the accuracy and comprehensiveness of the demand information obtained. In determining the expected attributes of suppliers, Yang and Chai (2018) adopt the Delphi method to determine the expected attributes, which is highly subjective. However, this study determines expected attributes based on the mined user demands and the constructed domain ontology of NEV component supplier selection criteria, which is significantly more objective and realistic.
6 Conclusion and future work
This paper presents an integrated method for demand-driven NEV supplier selection based on ontology–QFD–CBR. In the method, the literature on the selection criteria of an NEV component supplier is first preprocessed. Second, the domain concepts are extracted using LDA, and the HAC algorithm and association rules are used to extract the relations between domain concepts so as to construct the domain ontology of NEV component supplier selection criteria. Then, demand attributes and their weights are determined based on LDA, the information entropy method, and the Kano model. On the basis of this, the expected attributes and their weights are determined based on QFD. Furthermore, the attribute similarities and hybrid similarities between the alternative cases and target cases are calculated based on ontology theory and CBR, and the most suitable NEV component supplier is selected. The four major contributions of this study are as follows.
First, a new solution framework for demand-driven NEV supplier selection based on ontology–QFD–CBR is proposed. Compared with the existing ones, free-form documents are used in an information acquisition way instead of traditional ways such as scales and questionnaires so as to enable users to express their demands more freely and improve the accuracy of obtaining demand information. Moreover, the framework integrates the merits of ontology, QFD, and CBR. To our knowledge, no previous studies have investigated the problem of NEV component supplier selection with this kind of integrated method.
Second, in the construction of supplier selection criteria and the determination of their weight, the domain ontology of NEV component supplier selection criteria is constructed based on text information mining, and the logical and semantic relationships of selection criteria are fully considered. In addition, the weights of selection criteria are determined based on QFD, which considers the demands of users and ensures objectivity.
Third, in the supplier selection decision, a concept semantic similarity calculation method is proposed based on semantic distance, node depth, and node density, and the semantic similarity is integrated into the calculation of hybrid similarity for retrieval, which is an extension to the traditional hybrid similarity calculation method and can improve the accuracy and efficiency of supplier case retrieval and provide good scalability and sharing for domain knowledge. In addition, the alternative suppliers are compared with the decision-maker’s expectations, and multiple forms of attribute value formats (i.e., crisp numbers, interval numbers, fuzzy linguistic variables, and ontology concepts) are considered comprehensively. The supplier that meets the decision-maker’s expectations is selected, which is closer to the reality and considered more comprehensively.
Fourth, in the processing of demand information and the determination of the weights of demand attributes, two improvements have been made. One is the multi-granularity sentiment analysis algorithm, which is developed to capture different sentiment strengths contained in different sentiment polarities. It is an extension to the traditional sentiment strength method and can effectively avoid the loss of information caused by only considering the positive and negative sentiment polarities. The other is to determine the weights of demand attributes using entropy weight and considering the Kano category of demand attributes, which fully embodies the idea of “letting the data speak for themselves,” ensures objectivity and authenticity, and avoids the influence of subjective factors to a large extent.
In terms of future work, three interesting directions can be considered. First, to help NEV manufacturers manage component suppliers more effectively, a decision support system embedded in the proposed method can be developed. Second, intelligent algorithms such as deep learning will also be combined to rank a large number of potential suppliers so as to select suitable suppliers. Third, the application of the proposed method will be extended to solve the problems of supplier selection in other sectors, such as the oil industry and the paper industry.
Data availability statement
The raw data supporting the conclusion of this article will be made available by the authors, without undue reservation.
Author contributions
All authors contributed to the study conception and design. Material preparation, data collection, and analysis were performed by JZ, Y-HL, and Z-PF. The first draft of the manuscript was written by JZ, and all authors commented on previous versions of the manuscript. All authors read and approved the final manuscript.
Funding
This work was partly supported by the National Science Foundation of China (grant number 72031002), the China Postdoctoral Science Foundation (grant number 2019M653794), the Philosophy and Social Science Innovative Talent Support Program of Henan (grant number 2022-CXRC-27), the Training Program for Young Key Teacher of Higher Education Institutions in Henan Province (grant number 2021GGJS060), the Logistics Research Center Project of the Key Research Base of Humanities and Social Sciences in Henan Province (grant number 2015-JD-04) and the 111 Project of China (grant number B16009).
Conflict of interest
The authors declare that the research was conducted in the absence of any commercial or financial relationships that could be construed as a potential conflict of interest.
Publisher’s note
All claims expressed in this article are solely those of the authors and do not necessarily represent those of their affiliated organizations, or those of the publisher, the editors, and the reviewers. Any product that may be evaluated in this article, or claim that may be made by its manufacturer, is not guaranteed or endorsed by the publisher.
References
Adnan, N., Nordin, S. M., Rahman, I., and Amini, M. H. (2017). A market modeling review study on predicting Malaysian consumer behavior towards widespread adoption of PHEV/EV. Environ. Sci. Pollut. Res. 24 (22), 17955–17975. doi:10.1007/s11356-017-9153-8
Agrawal, R., Mannila, H., Srikant, R., Toivonen, H., and Verkamo, A. I. (1996). “Fast discovery of association rules,” in Advances in knowledge discovery and data mining (California, USA: AAAI/MIT Press), 307–328.
Ayağ, Z., and Samanlioglu, F. (2014). An intelligent approach to supplier evaluation in automotive sector. J. Intell. Manuf. 27, 889–903. doi:10.1007/s10845-014-0922-7
Azizi, A., Aikhuele, D. O., and Souleman, F. S. (2015). A fuzzy TOPSIS model to rank automotive suppliers. Procedia Manuf. 2, 159–164. doi:10.1016/j.promfg.2015.07.028
Balazs, J. A., and Velásquez, J. D. (2016). Opinion mining and information fusion: A survey. Inf. Fusion 27, 95–110. doi:10.1016/j.inffus.2015.06.002
Bastida-Molina, P., Hurtado-Pérez, E., Pérez-Navarro, Á., and Alfonso-Solar, D. (2021). Light electric vehicle charging strategy for low impact on the grid. Environ. Sci. Pollut. Res. 28 (15), 18790–18806. doi:10.1007/s11356-020-08901-2
Berger, C., Blauth, R., Bolster, C., Burchill, G., Dumouchel, W., Pouliot, F., et al. (1993). Kano’s methods for understanding customer-defined quality. Cent. Qual. Manag. J. 2 (4), 3–36.
Bi, J. W., Liu, Y., Fan, Z. P., and Cambria, E. (2019a). Modelling customer satisfaction from online reviews using ensemble neural network and effect-based Kano model. Int. J. Prod. Res. 57 (22), 7068–7088. doi:10.1080/00207543.2019.1574989
Bi, J. W., Liu, Y., Fan, Z. P., and Zhang, J. (2019b). Wisdom of crowds: Conducting importance-performance analysis (IPA) through online reviews. Tour. Manag. 70, 460–478. doi:10.1016/j.tourman.2018.09.010
Blei, D. M., Ng, A. Y., and Jordan, M. I. (2003). Latent Dirichlet allocation. J. Mach. Learn. Res. 3, 993–1022.
Büyüközkan, G., and Çifçi, G. (2011). A novel fuzzy multi-criteria decision framework for sustainable supplier selection with incomplete information. Comput. Industry 62 (2), 164–174. doi:10.1016/j.compind.2010.10.009
Cano, Z. P., Banham, D., Ye, S., Hintennach, A., Lu, J., Fowler, M., et al. (2018). Batteries and fuel cells for emerging electric vehicle markets. Nat. Energy 3 (4), 279–289. doi:10.1038/s41560-018-0108-1
Castells, P., Fernandez, M., and Vallet, D. (2007). An adaptation of the vector-space model for ontology-based information retrieval. IEEE Trans. Knowl. Data Eng. 19 (2), 261–272. doi:10.1109/tkde.2007.22
Chen, P. (2020). Effects of the entropy weight on TOPSIS. Expert Syst. Appl. 168 (8), 114186. doi:10.1016/j.eswa.2020.114186
Chen, R. C., Liang, J. Y., and Pan, R. H. (2008). Using recursive ART network to construction domain ontology based on term frequency and inverse document frequency. Expert Syst. Appl. 34 (1), 488–501. doi:10.1016/j.eswa.2006.09.019
Dai, Q., and Zhu, J. (2019). Research on the classification method of auto parts suppliers based on the typical sample set. J. Nanjing Univ. Sci. Technol. 43 (4), 527–534.
Dargi, A., Anjomshoae, A., Galankashi, M. R., Memari, A., and Tap, M. B. M. (2014). Supplier selection: A fuzzy-ANP approach. Procedia Comput. Sci. 31, 691–700. doi:10.1016/j.procs.2014.05.317
Deng, X., Liu, L., and Zhang, R. (2021). Optimal design of fitness game system based on Kano-QFD. Packag. Eng. 42 (14), 148–154.
Dong, L., Hu, Y., and Zhang, X. (2013). Method for non-taxonomical relations from domain concepts. Comput. Eng. Appl. 49 (4), 157.
Du, Y. W., and Gao, K. (2020). Ecological security evaluation of marine ranching with AHP-entropy-based TOPSIS: A case study of yantai, China. Mar. Policy 122, 104223. doi:10.1016/j.marpol.2020.104223
Dweiri, F., Kumar, S., Khan, S. A., and Jain, V. (2016). Designing an integrated AHP based decision support system for supplier selection in automotive industry. Expert Syst. Appl. 62, 273–283. doi:10.1016/j.eswa.2016.06.030
Eydi, A., and Fazli, L. (2019). A decision support system for single-period single sourcing problem in supply chain management. Soft Comput. 23 (24), 13215–13233. doi:10.1007/s00500-019-03864-0
Fan, Z. P., Chen, Z. W., and Zhao, X. (2020). Battery outsourcing decision and product choice strategy of an electric vehicle manufacturer. Int. Trans. Oper. Res. 29, 1943–1969. doi:10.1111/itor.12814
Fan, Z. P., Li, Y. H., Wang, X. H., and Liu, Y. (2014). Hybrid similarity measure for case retrieval in CBR and its application to emergency response towards gas explosion. Expert Syst. Appl. 41 (5), 2526–2534. doi:10.1016/j.eswa.2013.09.051
Feng, J., and Zhang, Y. (2017). Research on the method of detecting and analyzing scientific fronts based on LDA and ontology. Inf. Studies:Theory Appl. 40 (8), 49–54.
Galankashi, M. R., Helmi, S. A., and Hashemzahi, P. (2016). Supplier selection in automobile industry: A mixed balanced scorecard–fuzzy AHP approach. Alexandria Eng. J. 55 (1), 93–100. doi:10.1016/j.aej.2016.01.005
Gong, H., Wang, M. Q., and Wang, H. (2013). New energy vehicles in China: Policies, demonstration, and progress. Mitig. Adapt. Strateg. Glob. Chang. 18 (2), 207–228. doi:10.1007/s11027-012-9358-6
Guo, Y., Barnes, S. J., and Jia, Q. (2017). Mining meaning from online ratings and reviews: Tourist satisfaction analysis using latent Dirichlet allocation. Tour. Manag. 59, 467–483. doi:10.1016/j.tourman.2016.09.009
Guo, Y., and Zhou, J. (2017). Data mining modeling and its application in CAPP by integrating ontology and CBR. Mech. Sci. Technol. Aerosp. Eng. 36 (4), 579–585.
Gupta, S., Soni, U., and Kumar, G. (2019). Green supplier selection using multi-criterion decision making under fuzzy environment: A case study in automotive industry. Comput. Industrial Eng. 136, 663–680. doi:10.1016/j.cie.2019.07.038
Han, P., Li, Y., Yin, Y., and An, N. (2019). Cham, 34–45.Ontology construction for eldercare services with an agglomerative hierarchical clustering methodProc. Hum. Aspects IT Aged Popul. Des. Elder. Technol. Accept.
Hao, Z., Li, Z., Ni, H., Lv, S., Wang, X., and Zhu, Y. (2021). Present situation and prospect of new energy vehicle industry in China. IOP Conf. Ser. Earth Environ. Sci. 791, 012153. doi:10.1088/1755-1315/791/1/012153Qingdao, China
He, J. K. (2016). Global low-carbon transition and China’s response strategies. Adv. Clim. Change Res. 7 (4), 204–212. doi:10.1016/j.accre.2016.06.007
He, X., Zhan, W., and Hu, Y. (2018). Consumer purchase intention of electric vehicles in China: The roles of perception and personality. J. Clean. Prod. 204, 1060–1069. doi:10.1016/j.jclepro.2018.08.260
Hendiani, S., Mahmoudi, A., and Liao, H. (2020). A multi-stage multi-criteria hierarchical decision-making approach for sustainable supplier selection. Appl. Soft Comput. 94, 106456. doi:10.1016/j.asoc.2020.106456
Högström, C., Rosner, M., and Gustafsson, A. (2010). How to create attractive and unique customer experiences. Mark. Intell. Plan. 28 (4), 385–402. doi:10.1108/02634501011053531
Homem, T. P. D., Santos, P. E., Reali Costa, A. H., da Costa Bianchi, R. A., and Lopez de Mantaras, R. (2020). Qualitative case-based reasoning and learning. Artif. Intell. 283, 103258. doi:10.1016/j.artint.2020.103258
Hosseini, S., and Sarder, M. D. (2019). Development of a Bayesian network model for optimal site selection of electric vehicle charging station. Int. J. Electr. Power & Energy Syst. 105 (4), 110–122. doi:10.1016/j.ijepes.2018.08.011
Huang, G., and Zhou, Z. (2007). Research on domain ontology-based concept semantic similarity calculation. Comput. Eng. Des. 28 (10), 2460–2463.
Huang, S. L., and Cheng, W. C. (2015). Discovering Chinese sentence patterns for feature-based opinion summarization. Electron. Commer. Res. Appl. 14 (6), 582–591. doi:10.1016/j.elerap.2015.08.007
Huth, C., Kieckhäfer, K., and Spengler, T. S. (2015). Make-or-buy strategies for electric vehicle batteries—A simulation-based analysis. Technol. Forecast. Soc. Change 99, 22–34. doi:10.1016/j.techfore.2015.06.027
Ilyas, M., Carpitella, S., and Zoubir, E. (2021). Designing supplier selection strategies under COVID-19 constraints for industrial environments. Procedia CIRP 100, 589–594. doi:10.1016/j.procir.2021.05.128
Jain, V., Sangaiah, A. K., Sakhuja, S., Thoduka, N., and Aggarwal, R. (2018). Supplier selection using fuzzy AHP and TOPSIS: A case study in the Indian automotive industry. Neural comput. Appl. 29 (7), 555–564. doi:10.1007/s00521-016-2533-z
Jiang, Y. P., Fan, Z. P., and Ma, J. (2008). A method for group decision making with multi-granularity linguistic assessment information. Inf. Sci. 178 (4), 1098–1109. doi:10.1016/j.ins.2007.09.007
Kano, N., Seraku, N., Takahashi, F., and Tsuji, S. (1984). Attractive quality and must-be quality. J. Jpn. Soc. Qual. Control 14 (2), 147–156.
Kendall, M. (2018). Fuel cell development for New Energy Vehicles (NEVs) and clean air in China. Prog. Nat. Sci. Mater. Int. 28 (2), 113–120. doi:10.1016/j.pnsc.2018.03.001
Khan, S. A. K., Dweiri, F., and Jain, V. (2016). Integrating analytical hierarchy process and quality function deployment in automotive supplier selection. Int. J. Bus. Excell. 9 (2), 156–177. doi:10.1504/ijbex.2016.074851
Konidari, P., and Mavrakis, D. (2007). A multi-criteria evaluation method for climate change mitigation policy instruments. Energy Policy 35 (12), 6235–6257. doi:10.1016/j.enpol.2007.07.007
Küçük, D. (2015). A high-level electrical energy ontology with weighted attributes. Adv. Eng. Inf. 29 (3), 513–522. doi:10.1016/j.aei.2015.04.002
Le, T-D. B., and Lo, D. (2015). Montreal, QC, Canada, 331–340.Beyond support and confidence: Exploring interestingness measures for rule-based specification mining, Proceedings of the 2015 IEEE 22nd International Conference on Software Analysis, Evolution, and Reengineering (SANER)
Lee, C-H., Wang, Y-H., and Trappey, A. J. C. (2015). Ontology-based reasoning for the intelligent handling of customer complaints. Comput. Industrial Eng. 84, 144–155. doi:10.1016/j.cie.2014.11.019
Li, L., and Jing, X. (2019). Xiamen, China, 315–320.Analysis of tax policy for promoting the development of China's new energy vehicles industry, Proceedings of the Proceedings of the 2019 4th International Conference on Humanities Science and Society Development (ICHSSD 2019)
Li, S., Yan, Z., Jian, L., and Xu, J. (2015). Leicester, UK, 521–527.Study on auto parts suppliers composition selection based on adaptive genetic algorithm, Proceedings of the 2015 IEEE International Conference on Grey Systems and Intelligent Services (GSIS)
Li, Y-H., Zheng, J., Fan, Z-P., and Wang, L. (2021a). Sentiment analysis-based method for matching creative agri-product scheme demanders and suppliers: A case study from China. Comput. Electron. Agric. 186, 106196. doi:10.1016/j.compag.2021.106196
Li, Y-H., Zheng, J., Yue, S-T., and Fan, Z-P. (2021b). Capturing and analyzing e-WOM for travel products: A method based on sentiment analysis and stochastic dominance. K. (In press). doi:10.1108/k-02-2021-0146
Li, Z., Li, D., and Zhao, P. (2018). Research on automatic extraction of ontology concept and its relation in e-commerce. Inf. Sci. 36 (7), 85–90.
Liao, H., and Xu, Z. (2015). Approaches to manage hesitant fuzzy linguistic information based on the cosine distance and similarity measures for HFLTSs and their application in qualitative decision making. Expert Syst. Appl. 42 (12), 5328–5336. doi:10.1016/j.eswa.2015.02.017
Lima-Junior, F. R., and Carpinetti, L. C. R. (2016). A multicriteria approach based on fuzzy QFD for choosing criteria for supplier selection. Comput. Industrial Eng. 101, 269–285. doi:10.1016/j.cie.2016.09.014
Liu, A., Xiao, Y. X., Lu, H., Tsai, S-B., and Song, W. (2019). A fuzzy three-stage multi-attribute decision-making approach based on customer needs for sustainable supplier selection. J. Clean. Prod. 239, 118043. doi:10.1016/j.jclepro.2019.118043
Liu, D., Xu, L., Sadia, U. H., and Wang, H. (2021a). Evaluating the CO2 emission reduction effect of China's battery electric vehicle promotion efforts. Atmos. Pollut. Res. 12 (7), 101115. doi:10.1016/j.apr.2021.101115
Liu, G., Fan, S., Tu, Y., and Wang, G. (2021b). Innovative supplier selection from collaboration perspective with a hybrid MCDM model: A case study based on NEVs manufacturer. Symmetry 13 (1), 143. doi:10.3390/sym13010143
Liu, H., Zhang, D. X., and Shi, F. M. (2016). First record of sonotrella gorochov (orthoptera: Gryllidae) from Laos, with description of a new species. Zootaxa 36 (24), 189–194. doi:10.11646/zootaxa.4114.2.8
Liu, P., Hu, Y., Wang, X., and Liu, K. (2011). Shanghai, China, 1–5.A methodology for domain ontology construction in information science, Proceedings of the 2011 International Conference on E-Business and E-Government (ICEE)
Liu, Y., Bi, J. W., and Fan, Z. P. (2017). A method for ranking products through online reviews based on sentiment classification and interval-valued intuitionistic fuzzy TOPSIS. Int. J. Info. Tech. Dec. Mak. 16 (6), 1497–1522. doi:10.1142/s021962201750033x
Lu, C., Liu, H. C., Tao, J., Rong, K., and Hsieh, Y. C. (2017). A key stakeholder-based financial subsidy stimulation for Chinese EV industrialization: A system dynamics simulation. Technol. Forecast. Soc. Change 118, 1–14. doi:10.1016/j.techfore.2017.01.022
Lu, C., Tao, J., An, Q., and Lai, X. (2020). A second-order cone programming based robust data envelopment analysis model for the new-energy vehicle industry. Ann. Oper. Res. 292 (1), 321–339. doi:10.1007/s10479-019-03155-9
Luo, Y., Chen, X., Fang, F., Zhang, X., and Guo, N. (2021). A trust-enhanced and preference-aware collaborative method for recommending new energy vehicle. Environ. Sci. Pollut. Res. 28 (7), 7901–7917. doi:10.1007/s11356-020-10834-9
Manello, A., and Calabrese, G. (2019). The influence of reputation on supplier selection: An empirical study of the European automotive industry. J. Purch. Supply Manag. 25 (1), 69–77. doi:10.1016/j.pursup.2018.03.001
Mathiyazhagan, K., Sudhakar, S., and Bhalotia, A. (2018). Modeling the criteria for selection of suppliers towards green aspect: A case in Indian automobile industry. OPSEARCH 55 (1), 65–84. doi:10.1007/s12597-017-0315-8
Matzler, K., and Hinterhuber, H. H. (1998). How to make product development projects more successful by integrating Kano's model of customer satisfaction into quality function deployment. Technovation 18 (1), 25–38. doi:10.1016/s0166-4972(97)00072-2
Memari, A., Dargi, A., Akbari Jokar, M. R., Ahmad, R., and Abdul, A. R. A. R. (2019). Sustainable supplier selection: A multi-criteria intuitionistic fuzzy TOPSIS method. J. Manuf. Syst. 50, 9–24. doi:10.1016/j.jmsy.2018.11.002
Mou, N., Chang, J., and Chen, Z. (2018). Sustainable supplier selection based on PD-HFLTS and group decision-making theory. Comput. Integr. Manuf. Syst. 24 (5), 1261–1278.
Noori, A., Bonakdari, H., Salimi, A. H., and Gharabaghi, B. (2021). A group Multi-Criteria Decision-Making method for water supply choice optimization. Socio-Economic Plan. Sci. 77, 101006. doi:10.1016/j.seps.2020.101006
Park, S. C., and Lee, J. H. (2017). Supplier selection and stepwise benchmarking: A new hybrid model using DEA and AHP based on cluster analysis. J. Operational Res. Soc. 69 (3), 449–466. doi:10.1057/s41274-017-0203-x
Poria, S., Cambria, E., and Gelbukh, A. (2016). Aspect extraction for opinion mining with a deep convolutional neural network. Knowledge-Based Syst. 108, 42–49. doi:10.1016/j.knosys.2016.06.009
Qian, S., Zhang, T., Xu, C., and Shao, J. (2016). Multi-modal event topic model for social event analysis. IEEE Trans. Multimed. 18 (2), 233–246. doi:10.1109/tmm.2015.2510329
Ray, S., and Chandra, N. (2012). Domain based ontology and automated text categorization based on improved term frequency - inverse document frequency. Int. J. Mod. Educ. Comput. Sci. 4 (4), 28–35. doi:10.5815/ijmecs.2012.04.04
Ren, F. (2012). A cheap domain ontology construction method based on graph generation and conversion method. J. Inf. Comput. Sci. 9 (18), 5823–5830.
Tadrat, J., Boonjing, V., and Pattaraintakorn, P. (2012). A new similarity measure in formal concept analysis for case-based reasoning. Expert Syst. Appl. 39 (1), 967–972. doi:10.1016/j.eswa.2011.07.096
Tan, R., and Lin, B. (2019). Public perception of new energy vehicles: Evidence from willingness to pay for new energy bus fares in China. Energy Policy 130 (4), 347–354. doi:10.1016/j.enpol.2019.04.010
Tan, Z., Yang, Y., Wang, P., and Li, Y. (2021). Charging behavior analysis of new energy vehicles. Sustainability 13 (9), 4837. doi:10.3390/su13094837
Tang, L., Guo, C., Chen, J., and Sun, L. (2020). Learning concept hierarchies from Chinese academic literature for domain ontology construction. J. China Soc. Sci. Tech. Inf. 39 (4), 387–398.
Tavana, M., Shaabani, A., Santos-Arteaga, F. J., and Valaei, N. (2021). An integrated fuzzy sustainable supplier evaluation and selection framework for green supply chains in reverse logistics. Environ. Sci. Pollut. Res. 28, 53953–53982. doi:10.1007/s11356-021-14302-w
Teixeira, A. C., and Sodre, J. (2018). Impacts of replacement of engine powered vehicles by electric vehicles on energy consumption and CO2 emissions. Transp. Res. Part D Transp. Environ. 59, 375–384. doi:10.1016/j.trd.2018.01.004
Tirunillai, S., and Tellis, G. J. (2014). Mining marketing meaning from online chatter: Strategic brand analysis of big data using latent Dirichlet allocation. J. Mark. Res. 51 (4), 463–479. doi:10.1509/jmr.12.0106
Wang, R., Li, X., and Li, C. (2021). Optimal selection of sustainable battery supplier for battery swapping station based on Triangular fuzzy entropy -MULTIMOORA method. J. Energy Storage 34, 102013. doi:10.1016/j.est.2020.102013
Wang, R., Song, Y., Xu, H., Li, Y., and Liu, J. (2022). Life cycle assessment of energy consumption and CO2 emission from HEV, PHEV and BEV for China in the past, present and future. Energies 15 (18), 6853. doi:10.3390/en15186853
Wang, Y., Yu, Y., Huang, K., Chen, B., Deng, W., and Yao, Y. (2017). Quantifying the environmental impact of a Li-rich high-capacity cathode material in electric vehicles via life cycle assessment. Environ. Sci. Pollut. Res. 24 (2), 1251–1260. doi:10.1007/s11356-016-7849-9
Wen, J., Guo, W., and Shao, H. (2017). Case retrieve methodology based on domain ontology and case-based reasoning. Comput. Integr. Manuf. Syst. 23 (7), 1377–1385.
Wen, Y., Gao, C. M., and Pan, H. W. (2011). Research on concept semantic similarity computation based on ontology. Proceedings of the 2011 IEEE 2nd International Conference on Computing, Control and Industrial Engineering, 284–287.
Wu, Y., Xu, C., Huang, Y., and Li, X. (2020). Green supplier selection of electric vehicle charging based on Choquet integral and type-2 fuzzy uncertainty. Soft Comput. 24 (5), 3781–3795. doi:10.1007/s00500-019-04147-4
Xiao, G. (2020). Dalian, China, 451–454.Research on key manufacturing technologies of new energy vehicles based on artificial intelligenc, Proceedings of the 2020 IEEE International Conference on Artificial Intelligence and Computer Applications (ICAICA)
Xie, J., Li, J., Yang, F., and Liang, L. (2020). Decision-making and coordination optimized for multi-stage closed-loop supply chain of new energy vehicle. J. Industrial Eng. Eng. Manag. 34 (2), 185–198.
Xu, N., Finkelman, R. B., Dai, S., Xu, C., and Peng, M. (2021). Average linkage hierarchical clustering algorithm for determining the relationships between elements in coal. ACS Omega 6 (9), 6206–6217. doi:10.1021/acsomega.0c05758
Xu, Q., Jiao, R. J., Yang, X., Helander, M., Khalid, H. M., and Opperud, A. (2009). An analytical Kano model for customer need analysis. Des. Stud. 30 (1), 87–110. doi:10.1016/j.destud.2008.07.001
Yang, D., and Chai, H. (2018). Research on green product design selection based on QFD and case-based reasoning. Sci. Technol. Manag. Res. 38 (16), 251–259.
Yoo, D., and No, S. (2014). Ontology-based economics knowledge sharing system. Expert Syst. Appl. 41 (4), 1331–1341. doi:10.1016/j.eswa.2013.08.031
You, X., Lei, X., and Shi, Y. (2018). Criteria of green supplier selection for lightweight design in automotive industry. Sci. Technol. Manag. Res. 38 (16), 45–51.
Yu, R., Cong, L., Hui, Y., Zhao, D., and Yu, B. (2022). Life cycle CO2 emissions for the new energy vehicles in China drawing on the reshaped survival pattern. Sci. Total Environ. 826, 154102. doi:10.1016/j.scitotenv.2022.154102
Zhang, X., Hou, X., Chen, X., and Zhuang, T. (2013). Ontology-based semantic retrieval for engineering domain knowledge. Neurocomputing 116, 382–391. doi:10.1016/j.neucom.2011.12.057
Zhao, K., and Yu, X. (2011). A case based reasoning approach on supplier selection in petroleum enterprises. Expert Syst. Appl. 38 (6), 6839–6847. doi:10.1016/j.eswa.2010.12.055
Zheng, S., Huang, Q., Zhang, G., Li, Y., and Chen, X. (2019). A ontology construction method for user generated content. Inf. Sci. 37 (11), 43–47.
Keywords: new energy vehicle, supplier selection, ontology, quality function deployment, case-based reasoning, users’ demands
Citation: Zheng J, Li Y-H and Fan Z-P (2023) Demand-driven NEV supplier selection: An integrated method based on ontology–QFD–CBR. Front. Energy Res. 10:958885. doi: 10.3389/fenrg.2022.958885
Received: 01 June 2022; Accepted: 24 October 2022;
Published: 09 January 2023.
Edited by:
Helena Martín, Universitat Politecnica de Catalunya, SpainReviewed by:
Gerard Escudero, Universitat Politecnica de Catalunya, SpainJuan José Mesas, Universitat Politecnica de Catalunya, Spain
Copyright © 2023 Zheng, Li and Fan. This is an open-access article distributed under the terms of the Creative Commons Attribution License (CC BY). The use, distribution or reproduction in other forums is permitted, provided the original author(s) and the copyright owner(s) are credited and that the original publication in this journal is cited, in accordance with accepted academic practice. No use, distribution or reproduction is permitted which does not comply with these terms.
*Correspondence: Yong-Hai Li, eW9uZ2hhaS5saUAxNjMuY29t