 Ying Liang1,2,3*
 Jinxi Wang1,3
- 1School of Chemistry & Chemical Engineering, Yulin University, Yulin, China
- 2School of Chemical Engineering, Northwest University, Xi’an, China
- 3Shaanxi Key Laboratory of Low Metamorphic Coal Clean Utilization, School of Chemistry and Chemical Engineering, Yulin University, Yulin, China
Abstract:In the process of oil extraction and transportation, due to the interaction between oil, gas and water, hydrates are easily generated and pipelines are blocked. Based on this, from the perspective of energy enterprise automation technology, testing and research on oil and gas multiphase flow models and flow models are carried out. The hydrate formation area is analyzed by using the hydrate formation phase equilibrium theory, and the formation rate, deposition characteristics and blockage formation mechanism are analyzed. The influence of phase flow and heat transfer; after the boundary interface coefficient between oil, gas and water is clarified, a multiphase flow model of oil, gas and water is established. In the experimental test, the differential pressure signal is used to carry out the research on the oil and gas multiphase flow model and flow model, and it is concluded that the minimum critical superficial liquid velocity among the three flow patterns of oil, water and gas is 0.113 m/s, It can clearly characterize the characteristics of the flow pattern transition, which has certain practical significance for the sustainable development of energy enterprises.
Introduction
Oil has played a very important role in the development of the country, so the mixed transportation of oil and gas has been more widely used. In order to make the oil and gas mixing technology (Wu et al., 2021) more suitable for the actual needs of the project, experts in related fields have carried out in-depth research on it, and multiphase flow testing (Li et al., 2021a) and flow model testing (Mitsuru and Yuhu, 2019) have gradually become hot topics in the industry. In the multiphase flow test model, the parameters have a certain random variability, and the use of energy enterprise automation technology to identify the flow pattern of the changing parameter signals can greatly improve the oil and gas transmission efficiency in my country (Mouketou and Kolesnikov, 2018). However, at present, the development of automation in energy enterprises is still in its infancy, and relevant theoretical knowledge and practical applications are constrained by various conditions, such as lack of scientific research funds and lack of advanced technical support, and have not played its real role. Moreover, considering the incorporation of liquid phase in the oil transmission process, the oil pipeline will be blocked to a certain extent, thereby reducing the oil transmission efficiency. In order to take the oil and gas mixed transportation technology to a new level, corresponding measures must be taken to accurately predict the location and area where the oil pipeline may be blocked, analyze the relationship between the various phases, and lead and guide the automation technology of energy enterprises (Le et al., 2021) ]development of. However, how to accurately predict the blockage position of oil pipelines is still an important factor affecting the efficiency of oil production due to the lack of corresponding theoretical guidance and experimental data.
In view of the above problems, the literature (Yan et al., 2017) combined the optical fiber distributed acoustic wave sensing system with the optical fiber temperature pressure gauge and the optical fiber distributed temperature monitoring system by analyzing the main performance parameters and technical indicators of the multiphase flow hydrate environment. At the same time, various information of oil and gas wells are obtained, and experimental values of multiphase flow hydrate suitable for large-diameter, long-distance and high-pressure oil pipelines are proposed.
This method has the advantages of long life, long transmission distance, long monitoring distance and high temperature resistance. It can eliminate the electromagnetic influence during downhole operation, but when the oil pipeline is blocked, the blockage position cannot be predicted in time. Reference (Li and Dong, 2019) focuses on oil and natural gas. Equal pipeline transportation, in order to ensure the ideal accuracy of the multiphase flow test results, on the basis of ensuring the reliability of transportation management, the V-cone flowmeter structure is built, and the multiphase flow measurement correction model is introduced to ensure the high accuracy of the multiphase flow experiment. Precision. This method does not reach the environment where water and oil are mixed downhole, and there is a certain error between the accuracy of multiphase flow and the actual results. Reference (Han et al., 2019) established a multiphase flow test system based on the principle of optical fiber distributed acoustic wave sensing. Carry out monitoring and research on oil wells. Although the system obtains accurate downhole acoustic signals and realizes real-time monitoring of downhole production and susceptibility, it also does not consider the downhole hydrate formation area, which makes the research results unsatisfactory.
The above methods have achieved certain results in multiphase flow test accuracy and acoustic signal acquisition, but they do not consider the current development trend of the oil industry, and use advanced automation technology to seek more accurate pipeline blockage location prediction methods to help energy companies improve oil production. Quantity. Based on this, this paper conducts in-depth research on oil and gas multiphase flow testing and flow simulation testing from the perspective of energy enterprise automation. First, measure the hydrate in the oil pipeline. The measurement is mainly carried out from the hydrate formation area, decomposition rate (Li et al., 2021b), deposition characteristics and blockage formation mechanism, and the hydrate deposition rate at each location in the oil pipeline is determined, so that corresponding measures can be taken to ensure the normal exploitation and transportation of oil; A hydrate-containing multiphase flow model was established to analyze the thermal resistance effect of hydrate blockage on oil pipelines. Based on the continuity equation (Zhang et al., 2022), momentum equation and energy equation (Aglave et al., 2015), the relationship between the three phases of water is established; the multiphase flow model of oil, gas and water is established, and the boundary interface coefficient value of each phase is clarified (Wu et al., 2018). In the experimental test, the minimum critical superficial liquid velocity between laminar flow, wavy flow and slug flow is obtained as 0.113 m/s. Using the method in this paper, the transformation characteristics between the three flow patterns can be well described, as It has played a major role in promoting the development of the oil industry.
Measurement method of gas hydrate
In actual oil mining mines, there will inevitably be a certain degree of hydrate, forming the phenomenon of water-oil mixture. In the long run, hydrate formation will have a serious impact on normal oil exploitation and transportation. In order to get accurate test results of multiphase flow, the areas where hydrate usually forms, decomposition rate (Bahrami et al., 2016), sedimentary characteristics and blocking formation mechanism are analyzed, so as to have an in-depth understanding of hydrate deposition law in petroleum mine system, providing scientific reference for accurate prediction of hydrate area and prevention and control of oil exploitation.
Hydrate formation zone
Firstly, the possible regions of hydrate formation are analyzed, and the equilibrium theory of hydrate formation phase is used in this paper. The hydrate formation phase equilibrium theory refers to the fact that under different environmental factors, different temperatures and pressures of natural gas hydrates correspond to different phase systems in which hydrates exist. When the temperature in the mine is lower than the phase equilibrium temperature, the mine pressure value is larger than the phase equilibrium pressure value at the current temperature, and hydrate will be formed.
In this paper, the temperature and pressure required for hydrate formation are calculated by using hydrate phase equilibrium equation:
In the formula,
Rate of hydrate formation and decomposition
In the hydrate formation zone, gas and water molecules constantly interact to form new hydrates. The speed of hydrate formation is related to many conditions, which can be roughly divided into three categories: intrinsic kinetic factors, heat transfer process and mass transfer process. At present, there are many calculation methods for hydrate formation rate. By comprehensive comparison, Formula 3 is used in this paper to complete the calculation of hydrate formation rate. In the ring fog flow system, part of the water will evaporate with the air flow through the way of small droplets, drift mine environment; Some of the water will flow along the pipe, forming a liquid film of a certain thickness on the pipe wall. Both droplet and liquid film contain hydrates, but the gas-phase contact relationship between them and hydrates is very different. Hydrate formation rate is calculated under the ring fog flow theory, and the formula is shown in Eq. 3:
In the formula,
The hydrate formation rate under other conditions can be calculated by Vsniausk as& Bishnoi model (Martins et al., 2021).
When the gas hydrate is generated in the oil mine, it will move upward along with the upward transportation of oil. As it moves, the hydrates decompose under pressure (Li, 2022a). The calculation formula of hydrate decomposition rate is shown in Eq. 4:
In the formula,
Characteristics of hydrate deposition and mechanism of blockage formation
Under the circumstance of annular mist flow, part of the hydrate in the oil mine will sublime with the gas, and the other part will be deposited on the wall of the pipeline to form a hydrate layer of a certain thickness. In severe cases, it can lead to blockage of the pipeline. Under the action of the liquid film of the oil pipeline, the super-strong adhesive force makes the hydrate tightly adsorb on the pipeline wall, which can easily cause the blockage of the oil pipeline. Then it can be obtained that the hydrate deposition rate (Aziz et al., 2015) under the condition of annular fog flow is:
In the formula,
After a long time of deposition, the hydrate on the inner wall of the oil pipeline will gradually thicken and form the hydrate layer (Emmanuel and Dimitrios, 2019), whose specific thickness can be calculated by Eq. 7:
Then, the dimensionless hydrate layer thickness
In the formula,
It should be noted here that the data error between the hydrate thickness calculation method used in this paper and the standard ring fog flow condition is controlled within ±10%.
Hydrate formation takes time to accumulate, which is not a slow process, and some of it is carried away by sublimation, not all of it adsorbed to the wall of the pipeline. Therefore, even if the current environment meets all the conditions for hydrate formation, it will not cause hydrate blockage immediately. In practical application, the formation and blockage of hydrate in each position can be understood by calculating the thickness value of hydrate in different positions, so as to take corresponding measures to minimize the probability of hydrate blockage and ensure the normal operation of oil pipeline (Podryga et al., 2021).
Gas hydrate multiphase flow model
In hydrate formation conditions, two essential factors are water and gas, which interact with each other to form a new solid phase and change with the change of heat during hydrate formation and decomposition. At the same time, with more and more hydrate adsorbed on the inner wall of the oil pipeline, the oil flow area will continue to decrease and hydrate layer with thermal resistance effect will be formed gradually (Song et al., 2020). With the passage of time, the thermal resistance effect gradually increases. After considering the influence of hydrate generation and deposition on multi-phase flow and heat transfer in oil mines (Frank et al., 2019), a multi-phase flow model of oil and gas containing hydrate was established. Phase transformation exists between gas phase and hydrate phase, but cannot be completed between gas phase and liquid phase due to lack of mass transfer. There is a stable radial heat transfer between the oil mine and the bottom layer, and the fluid in the mine is always in a state of thermodynamic equilibrium. In the multiphase flow model, the interface between each phase can be regarded as a discontinuity plane, and the fluid in each phase satisfies the basic laws of conservation of mass, momentum and energy. These laws describe the relevant laws that should be followed in the process of oil exploitation from three aspects of continuity equation momentum equation and energy equation respectively.
Continuity equation
Based on the mass conservation law (Li et al., 2018), the continuity equation between each phase is calculated as follows:
The gas phase:
The liquid phase:
The cutting phase:
Hydrate phase:
In the formula,
Momentum equation
According to the momentum conservation theorem, momentum equations of multiphase flow of gas, liquid and solid phases can be calculated, as shown in Eq. 13:
In the formula,
Energy equation
1) Temperature field equation
In the oil mine, the heat transfer process of gas is not a stable one. Under multiple constraints of temperature and pressure, gas and hydrate will undergo phase transformation and absorb or release some heat. Due to the influence of hydrate’s own characteristics, it is endothermic during decomposition and exothermic during formation. Therefore, the effect of hydrate phase transition must be taken into account when establishing the energy equation.
The temperature field equation of unsteady flow of gas-liquid mixture in annular air can be expressed as:
The temperature field equation in the drill string can be expressed as:
In the formula,
2) Energy equation
The energy balance equation (Peng et al., 2017) between oil pipeline and drill string can be expressed as:
In the formula,
Oil-gas-water multiphase flow model
The oil-gas-water multiphase flow model established in this paper is shown in Figure 1. Among them, one for the computer monitoring system, two for pressure sensor, three for the open joint, four for the mixture export, five for liquid storage tanks, six for the cuttings collection barrels, seven for transparent pipe, eight for gas storage tank, A nine for air compressor, 10 for A gas flowmeter, 11 for the gas phase entrance, 12 for the cuttings funnel, 13 for water funnel, 14 for electromagnetic air pump, 15 is gas flowmeter B, 16 is ball valve, 17 is mixture inlet, 18 is temperature sensor, 19 is solid phase inlet, 20 is air compressor B, 21 is ozone storage tank.
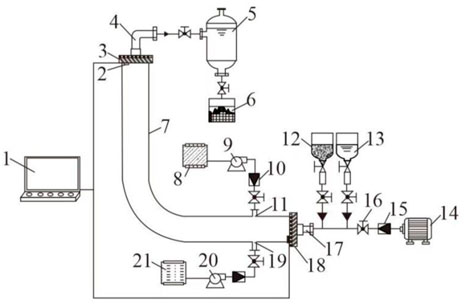
FIGURE 1. Device diagram of oil-gas-water multiphase flow model.
For oil flow calculation, turbine flowmeter is adopted in this paper (Cheng et al., 2018). Because gas has certain compressibility, it is greatly affected by temperature and pressure in oil pipeline. Therefore, real-time compensation and correction technology of temperature and pressure is introduced here (Fatemi, 2015). After accurate calculation of gas flowmeter, turbine flowmeter and vortex flowmeter, the control of gas phase flow is realized under the action of ball valve.
By calculating the continuity equation for the volume ratio of a single phase, the interface between multiple phases can be obtained. Assuming that phase exists, its boundary interface can be calculated by:
In the formula,
The properties of produced oil are determined by the phase fractions of all the controlled volumes in the annulus. The formula for calculating the average density of the volume ratio is:
Through the momentum equation solved above, the velocity field of each phase is calculated, as shown in Eq. 21:
In the formula,
Then, the formula for calculating the pressure drop between each phase interface is:
In the formula,
The normal vector of the unit surface around the inner wall of the oil pipeline is calculated as:
In the formula,
The equation of the average variable of the calculated vector is:
In the formula,
Assuming that the normal line of the surface
The calculation formula of surface curvature
In the formula, the value of the normal vector coefficient
According to the divergence theorem, surface tension can be converted into volume force and substituted into the left and right source terms in the equation of average variables:
Assuming that only two phases can exist in a unit, then
Experimental verification
Using differential pressure signal to study flow characteristics is a very common way in multiphase flow test. On the basis of differential pressure signal, the multi-phase flow model and flow model of oil and gas are tested. Differential pressure signal was obtained through experimental simulation in this paper. The diameter of oil pipeline 8 times was taken as the pressure sampling interval, i.e. 1000mm, and the sampling frequency was set as 100 Hz (Wang et al., 2018). The experimental platform uses Windows2018 operating system, with CPU of 8 GB and operating memory size of 4 GB. The multi-phase flow experimental system of oil, gas and water has been established. The oil phase is no. 40 oil. In addition to the casing at the mine end, the plexiglass pipe with an inner diameter of 40 mm and a total length of 20 m was used in the experiment (Hulsurkar et al., 2018), which was placed 15 m away from the entrance of the oil mine. Two groups of pressure transmitters are placed on the plexiglass tube with a distance of 200 mm between them. Each group consists of transmitters placed on the upper and lower sides of the plexiglass tube. In addition, the fluctuation of differential pressure signal in the experiment was obtained by the capacitive differential pressure transmitter. The total length of differential pressure measurement was 200m, which could meet the experimental needs. Other basic data about oil pipeline ends are shown in Table 1.
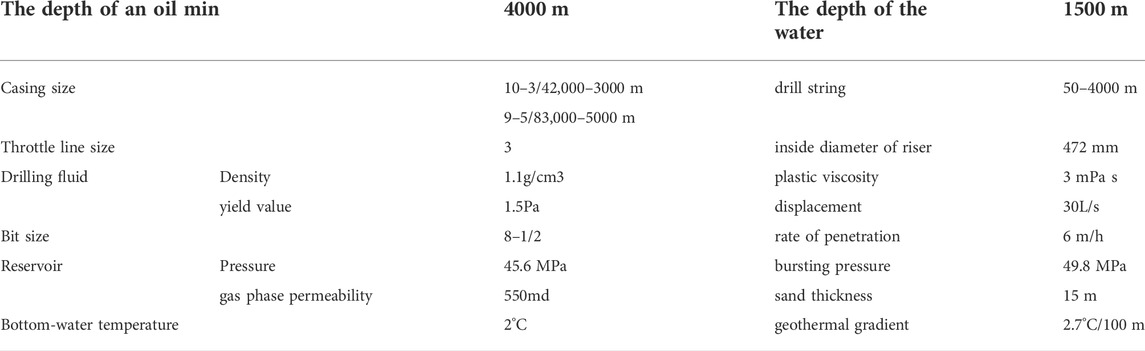
TABLE 1. Basic experimental data of oil pipeline end.
When the apparent velocity of both the gas and liquid phases in the pipeline is low, lamellar flow will be formed in the pipeline (Zhang and Tao, 2016). Stratified flow is one of the most common flow patterns in oil pipelines. A very smooth interface forms between the gas phase and the liquid phase, separating them, with the gas phase on top and the liquid phase on the bottom. When layered flow occurs, the time domain signal and flow pattern are shown in Figure 2.
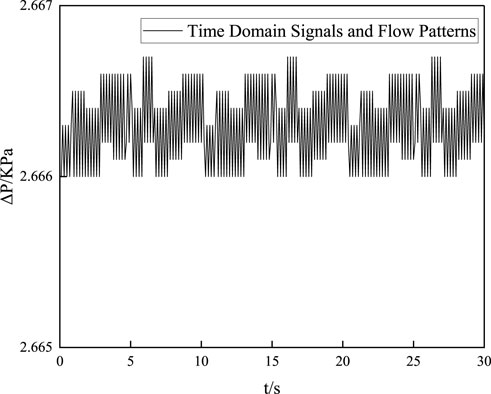
FIGURE 2. Stratified flow differential pressure time domain signal and flow pattern diagram.
As can be seen from Figure 2, when the apparent velocity of gas and liquid phase is small, the differential pressure time-domain signal and flow pattern present a layered flow, which is in a relatively stable state with only a small range of fluctuation (Gharaibah et al., 2015). At this time, the oil pipeline is normal, there is no blockage and other circumstances. At the same time, it can be considered that the time-domain signal has a stable value of 4.56 KPa and does not change with time.
With the increase of the apparent velocity, the boundary between gas and liquid phase begins to appear disturbance waves moving along the flow direction. Under the influence of such disturbed waves, a certain degree of fluctuation appeared on the interface, so the layered flow was transformed into a wave-like flow. At this time, the fluctuation of differential pressure signal gradually increased, as shown in Figure 3.
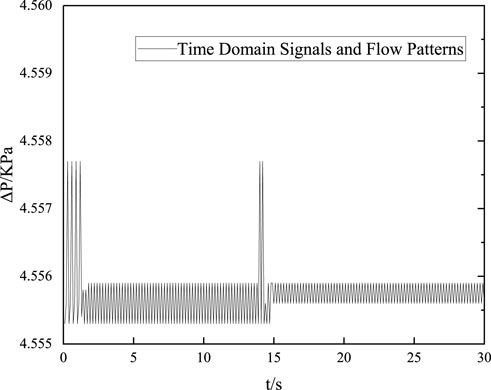
FIGURE 3. Time-domain signal and flow pattern of undulating flow differential pressure.
It can be clearly seen from Figure 3 that compared with stratified flow, undulating flow fluctuates more clearly, but the overall fluctuation range is not very large and always fluctuates around 2.666Kpa (Khayat et al., 2017). In addition, it can be seen from Figure 3 that the time-domain signal curve is less affected by time and does not change greatly with time.
In the oil pipeline, when the apparent velocity of the fluid rises to a certain extent, the wavy flow gradually begins to transform into slug flow, and the time-domain curve of the differential pressure signal will fluctuate greatly with obvious peaks and troughs. At this point, the liquid phase will rapidly fill the pipeline and form a long liquid plug. Behind the liquid plug is a very long air mass, and there will be liquid phase under the air mass, as shown in Figure 4.
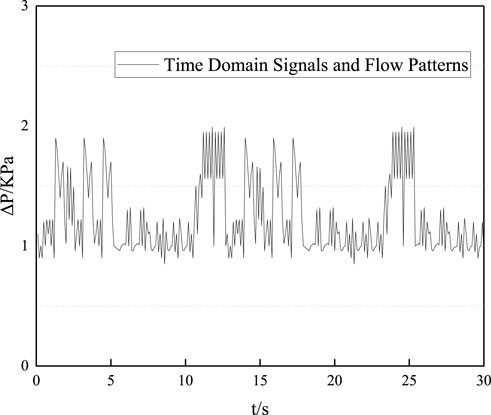
FIGURE 4. Slug flow differential pressure signal and flow pattern diagram.
By observing Figure 4, it can be concluded that when slug flow occurs in oil pipeline, the fluctuation of time domain signal curve is very large. Within 30 s of the experiment, there were eight obvious peaks. However, it can also be seen that the time-domain signal curve of slug flow has no obvious rule with the change of time, so it can also be considered that the time-domain signal curve of slug flow is not affected by time.
In conclusion, by analyzing the changes of time domain signal curves of middle-layer flow, wavy flow and slug flow in Figure 2 to Figure 4, it can be concluded that: The multiphase flow model and flow model in this paper can well extract the time-domain curve of differential pressure signal, and on the basis of the trend of the three curves, the transition characteristics between oil, water and gas multiphase flow patterns can be analyzed. By analyzing the transition characteristics of each phase, it can be found that the minimum critical apparent liquid velocity for the transition from layered flow to slug flow is
Conclusion
In this paper, from the perspective of energy enterprise automation, the multiphase flow model and flow model of oil and gas pipelines are tested, and three flow patterns of laminar flow, wavy flow and slug flow are obtained, and the conversion between the three flow patterns is obtained. Interface.
First, under the action of the liquid film on the oil pipeline wall, hydrate deposits form a hydrate layer, which is very prone to blockage of the oil pipeline. In this paper, after analyzing the hydrate formation area, decomposition rate, deposition characteristics and blockage formation mechanism, a multiphase flow model including hydrate is constructed. A multiphase flow model of oil and gas is established to obtain the volume ratio, velocity field and pressure drop of each phase. In the channel, while the apparent velocity of liquid phase increases, the apparent velocity of the transition between laminar flow and slug flow shows a downward trend. Therefore, it can be concluded that the method in this paper can describe and characterize the flow pattern transition clearly and unambiguously. This of great significance to the exploration, development and transportation of oil. We will further study the influence mechanism of various factors to provide more scientific and favorable guidance for oil exploitation and transportation.
Data availability statement
The raw data supporting the conclusion of this article will be made available by the authors, without undue reservation.
Author contributions
YL conceived the idea and designed experiments, JW performed data analysis and drawn conclusions, finally, YL and JW wrote the manuscript.
Funding
This paper is supported by Bureau of Science and Technology in Yulin “Design and application of a new type sampler for multiphase flow in wellhead,” (2019-84-1).
Conflict of interest
The authors declare that the research was conducted in the absence of any commercial or financial relationships that could be construed as a potential conflict of interest.
Publisher’s note
All claims expressed in this article are solely those of the authors and do not necessarily represent those of their affiliated organizations, or those of the publisher, the editors and the reviewers. Any product that may be evaluated in this article, or claim that may be made by its manufacturer, is not guaranteed or endorsed by the publisher.
References
Aglave, R., Baran, O., Tandon, M. P., and Karnik, S. L. (2015). “Numerical simulation of dense Gas㏒olid fluidized beds: Comparison between eulerian multiphase and discrete element methods,” in AICHE Annual Conference, Salt lake city, UT, November 8-13, 2015.
Al-Qutami, T. A., Ibrahim, R., and Ismail, I. (2017). “Radial basis function network to predict gas flow rate in multiphase flow,” in International Conference on Machine Learning & Computing, 24 February 2017 (ACM).
Aziz, I. A., Brandt, I., Gunasekera, D., and Håtveit, B. (2015). Multiphase flow simulation-optimizing field productivity[J]. Oilfield Rev. 27 (1), 26–37.
Bahrami, N., Pena, D., and Lusted, I. (2016). Well test, rate transient analysis and reservoir simulation for characterizing multi-fractured unconventional oil and gas reservoirs. J. Pet. Explor. Prod. Technol. 6 (4), 675–689. doi:10.1007/s13202-015-0219-1
Bs, A., Wf, A., and Ning, W. B. (2019). Multiphase flow modeling of gas intrusion in oil-based drilling mud[J]. J. Petroleum Sci. Eng. 174, 1142–1151. doi:10.1016/j.petrol.2018.12.018
Cheng, L., Gao, Z. K., and Jin, N. D., Springerbriefs in applied sciences and technology multiphase flow series editors nonlinear analysis of gas-water/oil-water two-phase flow in complex networks 123. 2018.
Emmanuel, I. E., and Dimitrios, I. G. (2019). Drill cuttings transport and deposition in complex annular geometries of deviated oil and gas wells: A multiphase flow analysis of positional variability ScienceDirect. Chem. Eng. Res. Des. Trans. Institution Chem. Eng. 151, 214–230. doi:10.1016/j.cherd.2019.09.013
Fatemi, M. S. (2015). Multiphase flow and hysteresis phenomena in oil recovery by water alternating gas (WAG) injection. Engineering.
Frank, M., Kamenicky, R., Drikakis, D., Thomas, L., Ledin, H., and Wood, T. (2019). Multiphase flow effects in a horizontal oil and gas separator. Energies 12 (11), 2116. doi:10.3390/en12112116
Gharaibah, E., Read, A., and Scheuerer, G. (2015). “Overview of CFD multiphase flow simulation tools for subsea oil and gas system design, optimization and operation,” in OTC Brasil, Rio de Janeiro, Brazil, October 27–29, 2015.
Han, S., Wang, T., and Zhu, S. (2019). Research on factors influencing the detection accuracy of multiphase flow based on CFD simulation. Sci. public Sci. Technol. innovation (11), 2.
Hulsurkar, P., Awoleke, O. O., and Ahmadi, M. (2018). Experimental study of the multiphase flow of sand, viscous oil, and gas in a horizontal pipe. SPE Prod. operations 33 (4), 837–856. doi:10.2118/187212-pa
Jiang, Z., and Yang, Y. (2018). Design and numerical simulation of double-grade gas-liquid separator. Petroleum Tubul. Goods Instrum.
Khayat, O., Afarideh, H., and Mohammadi, A. H. . Computational fluid dynamics (CFD) analysis and modeling of mass flow rates of gas, oil and water in multiphase flow through venturi meter using LSSVM method. 2017
Le, S., Wu, Y., Guo, Y., and Del Vecchio, C. (2021). Game Theoretic Approach for a service function chain routing in NFV with coupled constraints. IEEE Trans. Circuits Syst. II Express Briefs 68, 3557–3561. doi:10.1109/TCSII.2021.3070025
Li, H. (2022). SCADA data based wind power interval prediction using LUBE-based deep residual networks. Front. Energy Res. 10, 920837. doi:10.3389/fenrg.2022.920837
Li, H. (2022). Short-term wind power prediction via spatial temporal analysis and deep residual networks. Front. Energy Res. 10, 920407. doi:10.3389/fenrg.2022.920407
Li, H., Deng, J., Yuan, S., Feng, P., and Arachchige, D. (2021). Monitoring and identifying wind turbine generator bearing faults using deep belief network and EWMA control charts. Front. Energy Res. 9, 770. doi:10.3389/fenrg.2021.799039
Li, H., Deng, J., Feng, P., Pu, C., Arachchige, D., and Cheng, Q. (2021). Short-term nacelle orientation forecasting using bilinear transformation and ICEEMDAN framework. Front. Energy Res. 9, 780928. doi:10.3389/fenrg.2021.780928
Li, W., and Dong, J. (2019). Experimental apparatus and testing technology for multiphase flow hydrate in large submarine mixed transportation pipeline. Chem. Eng. Equip. 10, 3.
Li, Y., Chen, J., and Kong, W. (2018). Design and optimization of the fiber-optic probe array for measuring gas holdup in oil-gas-water multiphase flow. J. Ambient Intell. Humaniz. Comput (1). doi:10.1007/s12652-017-0674-2
Martins, O., Nduka, N. B., and Abam, F. (2021). Diagnostic and prognostic development of a mechanistic model for multiphase flow in oil-gas pipelines. J. King Saud University-Science (1). doi:10.1016/j.jksues.2020.12.010
Mitsuru, T, and Yuhu, W (2019). MayerType optimal control of probabilistic boolean control network with uncertain selection probabilities. IEEE Trans. Cybern. 51, 3079–3092. doi:10.1109/TCYB.2019.2954849
Mouketou, F. N., and Kolesnikov, A. (2018). Modelling and simulation of multiphase flow applicable to processes in oil and gas industry. Chem. Prod. Process Model. 14. doi:10.1515/cppm-2017-0066
Peng, W. F., Yao, Z. Y., and Sui, G. (2017). Detection of the radiation of multiphase flow meter on the oil and gas production platform in a sea area in 2015. Occupation and Health.
Podryga, V. O., Polyakov, S. V., and Tarasov, N. I. (2021). Developing of multiscale Approach to HPC-simulation of multiphase fluid flows. Lobachevskii J. Math. 42 (11), 2626–2636. doi:10.1134/s1995080221110160
Song, G., Li, Y., and Sum, A. K. (2020). Characterization of the coupling between gas hydrate formation and multiphase flow conditions. J. Nat. Gas Sci. Eng. 83, 103567. doi:10.1016/j.jngse.2020.103567
Sun, B. (2016). Multiphase flow in oil and gas well drilling (Sun/Multiphase flow in oil and gas well drilling). Weiley. doi:10.1002/9781118720288:1-24
Wang, H., Gala, D. P., and Sharma, M. M. (2018). Effect of fluid type and multiphase flow on sand production in oil and gas wells. SPE J. 24, 733–743. doi:10.2118/187117-PA
Wu, S., Dong, J., Wang, B., Fan, T., and Li, H. (2018). “A general purpose model for multiphase compositional flow simulation,” in SPE Asia Pacific Oil and Gas Conference and Exhibition, Brisbane, Australia, October 23–25, 2018. doi:10.2118/191996-ms
Wu, Y., Guo, Y., and Toyoda, M. (2021). Policy iteration approach to the infinite horizon average optimal control of probabilistic boolean networks. IEEE Trans. Neural Netw. Learn. Syst. 32, 2910–2924. doi:10.1109/TNNLS.2020.3008960
Yan, Z., Luo, D., and Tang, S. (2017). Research on downhole multiphase flow measurement based on optical fiber distributed acoustic sensor. Oil gas well Test. 26 (2), 4.
Zhang, Y., Qian, T., and Tang, W. (2022). Buildings-to-distribution-network integration considering power transformer loading capability and distribution network reconfiguration. Energy 244, 123104. doi:10.1016/j.energy.2022.123104
Keywords: energy, multiphase flow test, hydrate, continuity equation, multiphase flow model
Citation: Liang Y and Wang J (2022) Research on multi-phase flow test and flow simulation test in energy enterprise automation. Front. Energy Res. 10:972570. doi: 10.3389/fenrg.2022.972570
Received: 18 June 2022; Accepted: 18 July 2022;
Published: 16 August 2022.
Edited by:
Tinghui Ouyang, National Institute of Advanced Industrial Science and Technology (AIST), JapanCopyright © 2022 Liang and Wang. This is an open-access article distributed under the terms of the Creative Commons Attribution License (CC BY). The use, distribution or reproduction in other forums is permitted, provided the original author(s) and the copyright owner(s) are credited and that the original publication in this journal is cited, in accordance with accepted academic practice. No use, distribution or reproduction is permitted which does not comply with these terms.
*Correspondence: Ying Liang, eWx1bml2ZXJzaXR5MTAzMEAxNjMuY29t