 Guo Rong1
 Md Qamruzzaman2*
- 1Xi’an Jiaotong University City College Department of Management, Xi’an, China
- 2School of Business and Economics, United International University, Dhaka, Bangladesh
This study aimed to gauge the impact of economic policy uncertainty, oil price, and technological innovation on renewable energy consumption in the top five oil-importing nations for the period 1990–2021. The study employed a linear and nonlinear framework in exploring the association and variable elasticities on renewable energy consumption. According to linear assessment, the study documented positive effects from technological innovation and oil price volatility, whereas economic policy uncertainty adversely caused renewable energy integration, especially in the long run. The study disclosed long-run and short-run asymmetric connections between TI, EPU, and REC for asymmetric assessment. For directional causality, the study documented feedback hypothesis that explain the nexus between oil price and renewable energy consumption in China [OIL←→REC]; economic policy uncertainty and renewable energy consumption [EPU←→REC] in China, India, Japan, and South Korea; and technological innovation and renewable energy consumption [TI←→REC] in South Korea. On a policy note, the study established that efficient energy transition from fossil fuel to renewable energy demands economic stability and, therefore, stability must be ensured. Furthermore, oil prices should be considered while formulating energy policies.
1 Introduction
Since the 1970s, environmental degradation and climate change have come to the top of the list of the most difficult and controversial issues confronting the globe, and there is a growing international agreement that these major challenges must be addressed immediately (Boutabba, 2014; Andriamahery and Qamruzzaman, 2022). In recent years, carbon dioxide emissions (CO2) have increased at an alarming pace, with a substantial increase from 22 thousand million tons in 1990 to 37 thousand million tons in 2018–2019, according to the World Bank’s Carbon Emissions Inventory. Developed and developing nations have put serious concerns on environmental degradation and adversity to socio-economic development; in the light of pollution and degradation reduction, nations have formulated and implemented environmental protection initiatives to combat climate change consequences. The war on climate change has considered renewable energy (RE, hereafter) to be the key weapon for survival and has been extensively promoted by the economy for inclusion instead of conventional sources. Inclusion of clean energy substantially supports declining greenhouse gas (GHG) emissions in the eco-system and establishes ecological balance (Chien et al., 2022). Urbanization, industrialization, and globalization have accelerated economic development with the acceleration of additional energy demand in the economy. Excessive application of conventional energy such as fossil fuel has tremendously challenged the environmental protection program and limited the ultimate benefits of environmental development. Oil demand, according to the statistical review of world energy (2021), decreased most in the United States (−2.3 million b/d), the European Union (−1.5 million b/d), and India (−480,000 b/d). China was virtually the only country where consumption increased (220,000 b/d). Global oil production decreased by 6.6 million b/d, with OPEC accounting for two-thirds of the decline. Libya (−920,000 b/d) and Saudi Arabia (−790,000 b/d) faced the largest OPEC declines, while Russia (−1.0 million b/d) and the United States (−600,000 b/d) faced non-OPEC reductions.
Inferring to the importance of clean energy, that is, energy from renewable sources, has extensively investigated and positively documented critical rules in economic growth and environmental protection (Adebayo and Kirikkaleli, 2021; Dogan and Shah, 2021; Nair et al., 2021; Andriamahery and Qamruzzaman, 2022; Qamruzzaman, 2022a; Banga et al., 2022; Qamruzzaman, 2022a; Guan and Qamruzzaman, 2022; Gyimah et al., 2022; Li and Qamruzzaman, 2022; Ma and Qamruzzaman, 2022; Weixiang et al., 2022; Xia et al., 2022; Zafar et al., 2022; Zhuo and Qamruzzaman, 2022). For instance, in the study of Toumi and Toumi (2019), asymmetric causality to REC, carbon dioxide emissions (CE), and real GDP via nonlinear broadcasting between these variables via the nonlinear autoregressive distributed lag model was carried out in order to investigate the short- and long-run asymmetries. The findings of the nonlinear asymmetric causality test indicate that negative shocks in carbon dioxide emissions have only long-term beneficial effects on real GDP, but these effects are not immediately visible. Positive real GDP shocks have distinct consequences from negative REC shocks throughout the short and long term. Further evidence was found in the study of Attiaoui et al. (2017). In the case of Ghana, Gyimah, Yao (Gyimah et al., 2022) postulated that the inclusion of renewable energy in the economy intensifies the aggregated output through direct and indirect channels. Wang, Xia (Wang et al., 2022) explained that production of renewable energy, efficiency of that energy, expansion of the economy, and emission of carbon dioxide are the most important aspects of using renewable energy. However, technological advancements have significantly reduced the need for renewable energy.
Balancing socio-economic development with environmental protection, the application of renewable energy sources has emerged as an alternative source over conventional energy reliance. Furthermore, the importance of renewable energy inclusion and its critical role in socio-economic development have extensively been investigated (Mohsin et al., 2021; Ahmed et al., 2022; Qamruzzaman, 2022b; Chien et al., 2022; Qamruzzaman, 2022c; Qamruzzaman, 2022d; Gyimah et al., 2022). Cui, Weng (Cui et al., 2022) investigated, for example, the role of renewable energy in establishing environmental sustainability and documented that reliance on clean energy positively ties with establishing ecological sustainability by reducing environmental adversity. Another line of evidence has been available in the literature focusing on the key determinants for RE inclusion over fossil fuel (Ergun et al., 2019; Chen et al., 2021a; Awijen et al., 2022). Uzar (2020), for instance, documented that income inequality adversely affects the inclusion of REC in the economy, suggesting that equitable income distribution in society enhances the REC integration process and increases renewable energy consumption. For the case of Africa, Ergun, Owusu (Ergun et al., 2019) explored that FDI inflows ignite the renewable energy consumption propensity, while human capital development, trade openness, and economic growth are negatively connected to REC. In the case of Iran, Mukhtarov, Mikayilov Mukhtarov et al., (2022) have discovered that higher oil price negatively affects REC, suggesting that higher oil price in the economy hinders the energy transition to renewable energy from conventional fossil fuel consumption.
This study aimed to explore the effects of economic policy uncertainty, oil price shocks, and environmental quality on renewable energy consumption in the top five oil-importing nations from 1990 to 2021 with the application of both symmetric and asymmetric frameworks. The following facts induce the selection of the sample economy: first, oil price significantly influences the energy transition from conventional to renewable energy, indicating that energy cost has a significant role in energy source selection. The present study motivates the top five oil-importing nations to see how international oil prices play a role in energy selection even though environmental adversity discourages conventional energy consumption. Second, technological advancement has appreciated the developed and developing economies; precisely, the selected economy is well-known for technological adoption and development. Thus, the study addresses technological innovation’s role in including renewable energy consumption over conventional energy.
As for the discussion, the present study considered economic policy uncertainty (EPU), oil price shocks, and technological innovation in renewable energy consumption assessment. The selection of explanatory variables and top oil-importing nations has an impact on the following facts: first, according to the existing literature focusing on the effects of EPU on macro-fundamentals, it is revealed that an increasing number of studies have been implemented and documented the critical role of socio-economic development. However, the effects of EPU on energy transition are yet to be extensively investigated; even though a few studies have been initiated in the recent period, the observation of renewable energy inclusion or development is still an untouched area. The present study intended to mitigate the research gap by exploring the fresh insight dealing with the nexus between EPU and REC and support effective energy and environmental policy formulation and implementation. Second, technological innovation has emerged as the catalyst for economic and environmental sustainability through carbon reduction, energy efficiency, and energy transition. On environmental concerns, the development of renewable energy has emerged as a resolution in managing environmental degradation and, thus, the energy transition from fossil fuel to renewable energy. The present study is likely to research the role of technological innovation in the process of REC with an expectation that environmental innovation supports environmental development. Third, extensive use of oil as a prime energy source, according to the literature, even supports economic growth by promoting domestic activities at the cost of environmental degradation. On the other hand, applying REC in the production process is the key to environmental developmental protection with carbon management. Therefore, it is assumed that oil price volatility has a significant effect on energy selection on the ground energy efficiency and security; moreover, a higher oil price can be considered a boosting factor for renewable energy growth with a lower environmental speed of environmental degradation. Fourth, on methodological extension, the study implemented both symmetric and asymmetric nexus in exploring the elasticities of explanatory variables on REC. The literature firmly established that asymmetrical assessment, the positive and negative spirited innovation, immensely supports effective and efficient policy formulation, which is the biggest limitation in conventional assessment.
The rest of the study is structured as follows. Section 2outlines the relevant literature survey focusing on the empirical nexus. Section 3outlines the research variabledefinition and methodology of the study. Section 4 deals with empirical model estimation and interpretation. Section 5outlines the discussion. Finally, Section 6outlines the conclusion and policy suggestions.
2 Literature review
2.1 Oil price and renewable energy
Oil price movement has produced economic volatility through the channel of disruption in production, hike of the overall price level, and household consumption adversity by reducing the purchasing capacity. According to the income-transfer proposition, the instability in oil price encourages a capital shift from oil-importing nations to oil-exporting nations due to higher oil prices. Moreover, following the actual business cycle models of Kim and Loungani (1992), energy costs may also influence economic activity through their impact on labor and capital productivity. The existing literature has produced growing evidence focusing on the impact of oil prices on macro-determinants (Farzanegan and Markwardt, 2009; Rafiq et al., 2009; Qianqian, 2011; Jia et al., 2021; Sun et al., 2021). Chaudhry, Azali (Chaudhry et al., 2020), for instance, investigated the effects of oil prices on Pakistan’s environmental degradation from 1975 to 2018. The study postulated that increasing oil prices discouraged the inclusion of fossil fuels, supporting environmental development with lower carbon emissions. The asymmetric assessment revealed positive and negative shocks in oil prices negatively linked to environmental degradation. In the case of renewable energy integration, Alola et al. (2019) have explored that environmental degradation is positively linked, suggesting environmental adversity has created concern for environmental sustainability and induces transit energy selection from fossil fuel to renewable energy consumption.
It is a widely held idea that renewable energy can effectively replace older forms of fossil fuels, most notably oil; as a result, a large change in the price of oil on the worldwide market may have a negative impact on the growth of renewable energy (Padhan et al., 2020; Mukhtarov et al., 2022). The study by Zhao, Zhang (Zhao et al., 2021) has documented the negative association between the increase in international oil prices and renewable energy output in China. Furthermore, on a policy note, they suggested that renewable energy reliance can offset price volatility, that is, the crude oil price will be reduced, although Omri, Daly (Omri et al., (2015) found limited evidence of oil price effects on renewable energy consumption. Evidence shows that renewable energy is just a compliment and not a perfect substitute for crude oil, at least in the short run. Apergis and Payne (2015) used a panel co-integration and error correction model to investigate factors influencing renewable energy consumption. The study revealed that in the short term, an increase in real oil prices raises the consumption of renewable energy per capita in response to a substitution of fossil fuel prices, with a retroactive effect of the increase in renewable energy consumption per capita on the fall in real oil prices. The asymmetric concern is the positive and negative shocks of oil price movements on renewable energy consumption. Hsiao, Lin (Hsiao et al., 2019) considered the VAR model with innovations using the factor-GARCH (generalized autoregressive conditional heteroscedasticity) method to investigate the effect of market co-movements and time-varying volatility and correlation between the international oil price and China’s renewable energy market. The study revealed that international oil price has a substantial price spillover effect on the stock prices of China’s renewable energy listed companies. Additionally, the fluctuations in international oil price influence the stock price variations of Chinese renewable energy listed companies. According to the impulse response function, international oil shock negatively affects China’s renewable energy market in the short run. Referring to the directional association, Geng and Ji (2016) used panel co-integration techniques and the FMOLS model to examine the co-integration relationship between renewable energy consumption and its driving factors. The study revealed significant unidirectional causality from international crude oil prices to renewable energy technological innovation. The influence of international crude oil prices on renewable energy consumption is different for these six countries. The international crude oil price positively impacts renewable energy consumption at the 1% significance level for France, Germany, and Italy. On the other hand, the international crude oil price significantly negatively impacts the United States and Canada. This result is consistent with the findings of Sadorsky (2009) and Asongu, El Montasser (Asongu et al., 2016).
Kyritsis and Serletis (2019) applied the bivariate structural VAR model. It is modified to accommodate GARCH-in-mean errors to examine the relationship between oil prices and stock returns of clean energy. The study revealed that oil price uncertainty has a positive but statistically insignificant influence on renewable energy. Murshed (2021) used cross-sectional dependency analysis, generation panel unit root analysis, and panel regression analysis to investigate the nonlinear link between renewable energy consumption and crude oil prices concerning four net oil-importing South Asian economies. The study revealed that crude oil prices impacted the transition to renewable energy in the South Asian countries studied. A similar line of findings is available in the study of Managi and Okimoto, 2013) and Troster, Shahbaz (Troster et al., 2018). Song, Ji (Song et al., 2019) used the connectedness network method to investigate the static and dynamic information spillover effects of the three factors (the fossil energy market, investor sentiment toward renewable energy, and the renewable energy stock market) in terms of return and volatility. The study finds that the influence of the fossil energy market, particularly crude oil, on the renewable energy stock market is larger in both the return and volatile systems than the effect of investor sentiment on the renewable energy stock market. The study demonstrates that the renewable energy stock market is inextricably linked to the fossil energy market. Bamati and Raoofi (2020) revealed that oil price has little influence on renewable energy production in both groups.
2.2 Economic policy uncertainty and renewable energy consumption
Economic activity, as measured by economic growth, is expected to be a direct result of energy consumption, especially when the economy is seen as extremely reliant on energy owing to its immense size. However, the question of what will happen to the use of renewable energy in the face of unclear economic policy circumstances persists. Should a state support renewable energy efforts to lessen economic policy unpredictability? The existing empirical literature may be traced back to the ground-breaking work of Hamilton (1983). Hamilton (1983) argued that economic policy uncertainty and energy consumption are closely related due to fluctuations in energy prices caused by supply and demand shocks on the market, as well as negative expectations regarding economic activities, which may influence firm and consumer energy consumption decisions.
Lei, Liu (Lei et al., 2022) have investigated the impact of economic policy uncertainty and financial development on renewable energy consumption in China for the period 1990–2019 with an asymmetric framework. The study established that an asymmetric association between positive and negative shocks of EPU is positively connected to renewable energy consumption. In particular, 1% positive (negative) innovation in EPU will result in an increase (decrease) of REC by 0.3216% (0.1461%). In another study, Zhang, Qamruzzaman (Zhang et al., 2021) used the unit root test, long-run co-integration, bound testing approach, tBDM test, ARDL, FMOLS and DOLS, and canonical co-integrating regression to find out fresh evidence on the relationship between EPU and REC along with the reconciling role of forcing FDI and financial development (FD). The study revealed that economic policy uncertainty (EPU) has a negative long-term and short-term impact on renewable energy consumption (REC), according to ARDL estimates. In the literature, another line of evidence is available dealing with the nexus between economic policy uncertainty and energy prices (Scarcioffolo and Etienne, 2021; Dai et al., 2022; Ma et al., 2022). Findings from the study by Yu, Shi (Yu et al., 2021) show that the relationship between growing energy prices and economic policy uncertainty is fluid and ever-evolving. Badshah, Demirer (Badshah et al., 2019) explored the link between economic policy uncertainty and energy price volatility. The study showed that future energy volatility is predictable using indicators that depict macroeconomic concerns.
The impacts of economic policy uncertainty and oil price shocks on renewable energy were studied by Kang and Ratti (2013). The research found that the demand-side oil price shock had a favorable effect on renewable energy firms, whereas economic policy uncertainty negatively affected renewable energy usage. Energy users are now debating using hydropower, wind, and solar power as renewable energy sources. The accompanying economic policy vulnerabilities, such as oil prices, currency rates, and bond and stock markets, accelerate the energy transition. Economic policy uncertainty is vital for spreading renewable energy use (Zeng and Yue, 2022). Through favorable tax rules, transfer payments, expedited depreciation, investment credits, and government subsidies, the economic policy encourages the early development of the clean energy sector. However, environmentalists and economists differ on the link between the use of renewable energy and economic policy uncertainty. To shed light on the link between economic policy uncertainty and use of renewable energy, further research is required (Ivanovski and Marinucci, 2021). Increasing dependence on renewable energy sources may, in some unexplained manner, help institutional stability. A key element contributing to policy uncertainty is whether or not an investment in renewable energy is financially sustainable. The greater the prevalence of the use of renewable energy, the greater the awareness of its advantages. If this were to occur, the risks associated with using energy sources would be greatly minimized. It is anticipated that the growth of renewable energy projects will also assist the development and diffusion of new technologies, leading to higher economies of scale in the sector. Consequently, the cost of producing and using renewable energy will decrease. In such a situation, lobbying efforts are also more likely to fail, which might lead to more stable laws. This demonstrates that growth in renewable energy sources has a major beneficial effect on society and hence reduces the likelihood of political instability, which suggests that policy uncertainty has positive and negative consequences on renewable energy use.
2.3 Technological innovation and renewable energy consumption
Due to excessive usage of fossil fuels, the global temperature has increased since the turn of the previous century. This circumstance has driven a shift toward eco-friendly energy sources. In this energy transition setting, technical innovation is vital. The role of technological innovation in environmental quality with the reduction of carbon emission and ecological improvement has been extensively investigated and a positive interlinkage has been established between them (Khattak et al., 2020; Chen et al., 2021b; Godil et al., 2021; Andriamahery and Qamruzzaman, 2022). In the case of BRICS, Santra (2017) assessed the impact of technological innovation on carbon emission and unveiled a negative connection between technological innovation and carbon emission, indicating that innovation in energy production results in a reduction in carbon concentration. Lee and Tang (2022) investigated technological innovation’s thresholds and contingency impact on renewable energy consumption using panel data estimation. They advocated that renewable energy inclusion has been enhanced through promoting technological innovation; moreover, the contingent effects of technological innovation are established between them.
Global CO2 emissions are increasingly related to an assortment of economic activities. Measurement of environmental degradation in the context of the growth–energy–emissions nexus has thus progressed beyond initial inquiries into the relationship between GDP and emissions. Renewable energy can reduce CO2 emissions and promote a more environmentally friendly atmosphere, as climate change specialists have recognized for some time. Several prior research initiatives have investigated alternative renewable energy sources in managing environmental adversity (Bai et al., 2020; Töbelmann and Wendler, 2020; He et al., 2021; Niu, 2021). For the case of developed and developing nations, Dong, Zhu (Dong et al., 2022) established that clean energy integration and energy efficiency have significantly promoted green technological innovation and development. Furthermore, the study postulated that environmental innovation actively supported the control of carbon emissions, especially in the long run.
3 Variable definition and methodology of the study
3.1 Model specification
Following the literature dealing with macro-determinants of renewable energy development and its contribution to environmental sustainability (Andriamahery and Qamruzzaman, 2022; Qamruzzaman, 2022a; Qamruzzaman, 2022b; Miao et al., 2022; Mughal et al., 2022; Omri and Saidi, 2022; Usman et al., 2022), the present study investigates the symmetric and asymmetric nexus between oil prices, economic policy uncertainty, and technological innovation on renewable energy consumption in the top five oil-importing nations. Furthermore, the study has extended the existing studies of Qamruzzaman, Karim (Qamruzzaman et al., 2022) and Murshed and Tanha (2021) and established the following empirical relationship for investigation.
where REC stands for renewable energy consumption, OIL stands for oil price, TI stands for technological innovation, and EPU stands for economic policy uncertainty. All the variables have been transformed into a natural log before executing the target model. After transformation, the following equation is obtained (Boutabba, 2014) :
where the coefficient of the constant term stands for
For an aggregation of research variables, the study considered several public domains such as world development indicators (WDIs) published by the World Bank (World Bank, 2022), international financial statistics (IFS) published by IMF (International financial statistics, 2018), economic policy uncertainty published by the Economic Policy Uncertainty Index (Economic Policy Uncertainty Index, 2021) following Baker, Bloom (Baker et al., 2016), and U.S. Energy Information Administration (U.S. Energy Information Administration, 2021). The proxy measures of research variables are explained in the Table 1.
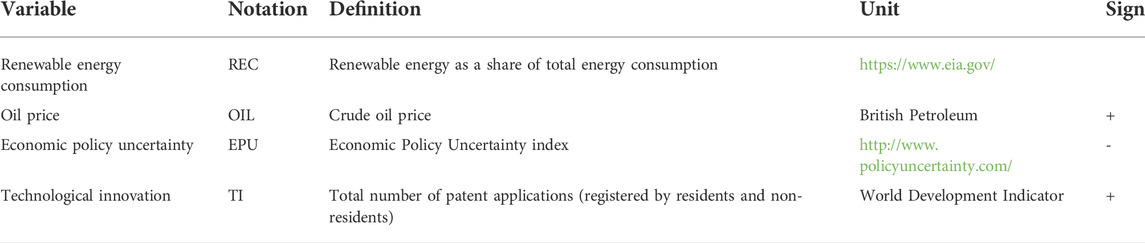
TABLE 1. Proxy measures of research variables.
4 Methodology of the study
4.1 Unit root test
An appropriate econometric technique section is appropriately guided by the research variable selection and their inherent properties; thus, the application of the stationary test has become one of the pre-assessment methods in the literature. We have considered several unit root tests following the ADF test given by Dickey and Fuller (1979), the P–P test familiarized by Phillips and Perron (1988), the GF–DLS test following Elliott, Rothenberg (Elliott et al., 1996), and the KPSS test introduced by Kwiatkowski, Phillips (Kwiatkowski et al., 1992).
4.2 Bayer–Hanck combined co-integration test
The study implemented the co-integration test by following the framework proposed by Bayer and Hanck (2013), commonly known as the combined co-integration test. The proposed co-integration test consists of four conventional tests of co-integration familiarized by Banerjee, Dolado (Banerjee et al., 1998), Peter Boswijk (1994), Johansen (1991), and Engle and Granger (1987) with the null hypothesis of a no-co-integration test. The following Fishers’ equation is considered in deriving the test statistics for detecting long-run association.
where PBDM, PBO, PJOH, and PEG stand for the significance levels of Banerjee et al. (1998), Boswijk (1995), Johansen (1991), and Engle and Granger (1987), respectively.
4.3 Autoregressive distributed lag (ARDL)
The long-run association in the empirical literature has been implemented with several conventional co-integration tests such as Engle and Granger (1987), Johansen (1998), and Johansen and Juselius (1990); the proposed co-integration test demands research variables’ unique order of integration, suggesting that the mixed order of integration, that is, I (0) or I (1), is not applicable. The prevailing limitation in conventional co-integration tests is the process of mitigating the problem, Pesaran, Shin (Pesaran et al., 2001) have familiarized cointegration tests with mixed order of variable integration commonly known as autoregressive distributed lag (ARDL). Since then, the ARDL approach has been extensively used in investigating long-run associations in empirical studies (Qamruzzaman and Jianguo, 2018; Qamruzzaman and Karim, 2020a; Qamruzzaman and Karim, 2020b; Qamruzzaman et al., 2020). ARDL estimation possesses certain benefits over traditional co-integration tests: 1) (Boutabba, 2014) efficient estimation regardless of the study’s sample size (Ghatak and Ju, 2001; Rehman et al., 2021; Qamruzzaman, 2022e; Li and Qamruzzaman, 2022; Xia et al., 2022); 2) (Andriamahery and Qamruzzaman, 2022) capability of handling mixed-order variable integration, and model stability and efficiency can be obtained by selecting appropriate lag specifications (Pesaran et al., 2001; Faruqui et al., 2015; Farhana and Md, 2017; Ahmad et al., 2022); and 3) (Chien et al., 2022) unbiased estimation for both long-run and short-run elasticity Banerjee, Dolado (Banerjee et al., 1993).
Following Pesaran, Shin (Pesaran et al., 2001), the generalized ADRL model for the study was considered for detecting both long-run and short-run coefficients by using the following equation.
where ∆ indicates differencing of variables, while being the error term (white noise), and (t-1) for the lagged period is the long-run coefficient. Based on linear ARDL 11, the long-run coefficient is available from
Pesaran, Shin (Pesaran et al., 2001) and Sam, McNown (Sam et al., 2019) presented two sets of asymptotic critical values, one for I (1) regressors and another for I (0) regressors. If the F-test statistic’s value was less than the lower-bound critical value or the t-test statistic’s absolute value was less than the absolute lower-bound critical value, the null hypothesis of “no long-run connection” could not be rejected. This indicated that there was no long-run connection between the variables. By contrast, if the F-test statistic’s value exceeds the upper limit critical value or the t-test statistic’s absolute value exceeds the upper-bound critical value, the null hypothesis may be rejected (Meng et al., 2021; Miao and Qamruzzaman, 2021; Zhang et al., 2021). This indicated the existence of long-run connections between the variables. Finally, if the test statistic’s value was neither less than nor higher than the two critical values, indicating that the value lies between the two critical values, the conclusion about the long-run associations between the variables was ambiguous (Qamruzzaman, 2015; Qamruzzaman and Ferdaous, 2015; Qamruzzaman and Jianguo, 2017) see, Table 2 for details.

TABLE 2. Null hypotheses for all three tests are defined as follows.
The study implemented the following equation with error correction terms to capture the short-run dynamics.
4.4 Nonlinear ARDL (NARDL)
The study considered a nonlinear framework following Shin, Yu (Shin et al., 2014) empirical assessment for detecting the asymmetric impact of economic policy uncertainty and financial inclusion on remittances. For gauging the asymmetric effects of oil price (OIL), economic policy uncertainty (EPU), and technological Innovation (TI) on renewable energy consumption (REC)), the following generalized equation is to be implemented:
where
Now, the equation () is transformed into asymmetric long-run and short-run coefficient assessment as follows:
A standard Wald test with a null symmetry hypothesis is implemented to detect long-run and short-run asymmetry. Only the insignificant test statistics will confirm the asymmetric association in the long and short run. Furthermore, the asymmetric long-run co-integration is assessed by following F-bound testing, joint primality test, and tBDM test; the higher test statistics relative to the critical value will confirm asymmetric co-integration in the empirical model.
5 Results and interpretation
5.1 Unit root test
The study has implemented several stationary tests to establish the variable’s order of integration. The results of the unit root test are displayed in Table 3. According to the test statistics derived with ADF, GF–DLS, and P–P tests, all the variables are exposed to stationarity after the first difference, while KPSS test statistics established variables are stationary at a level. Neither variable has been exposed to stationarity at a second difference, which is desirable for robust econometrical estimation.
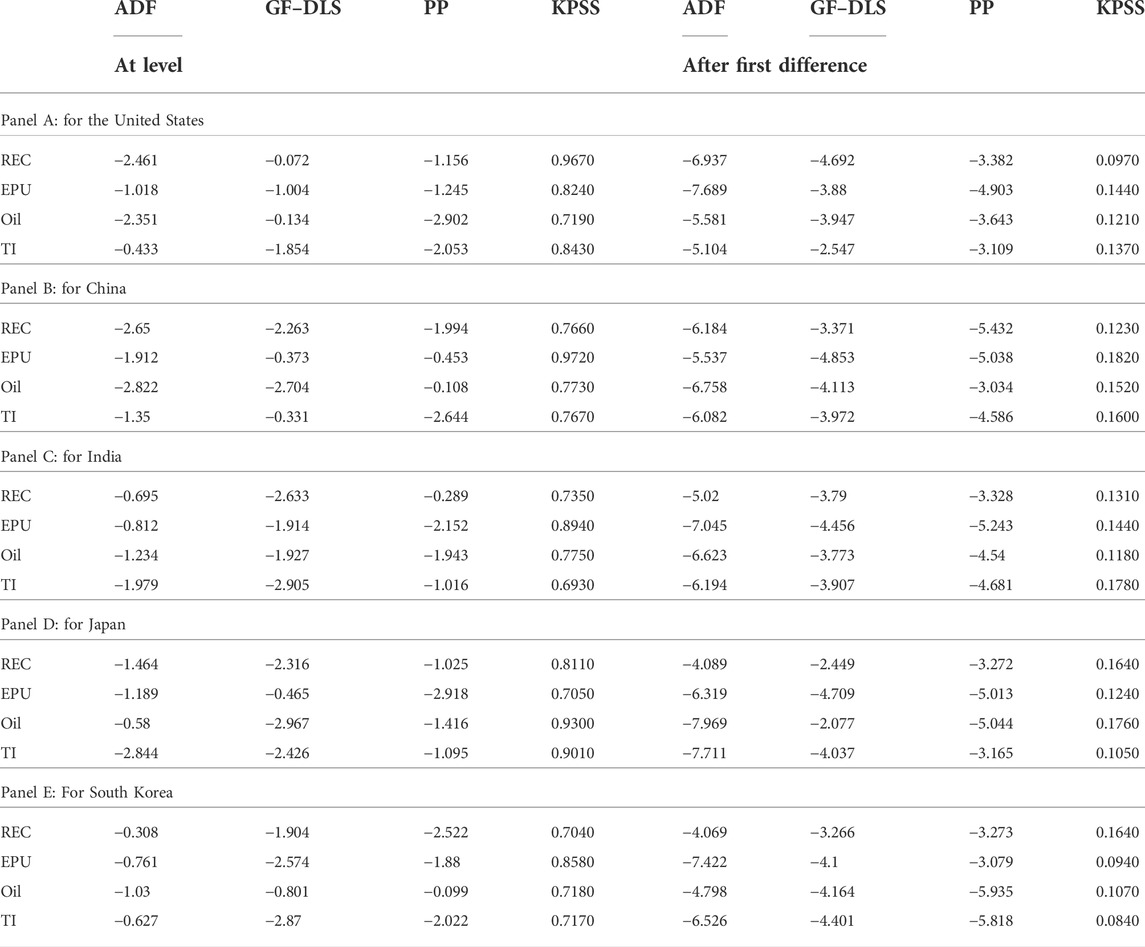
TABLE 3. Results of the unit root test.
The study implemented the combined co-integration test following Bayer and Hanck (2013), and the estimated results are displayed in Table 4. According to the test statistics, there is a long-run association between oil prices, economic policy uncertainties, technological innovation, and renewable energy consumption.
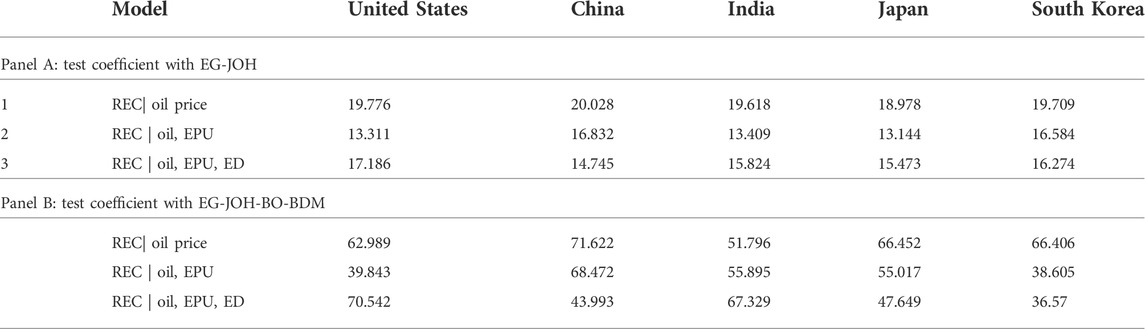
TABLE 4. Bayer and Hanck combined cointegration test.
5.2 Symmetric estimation of oil price, technological innovation, and economic policy uncertainty
The results of ARDL estimation are displayed in Table 5, which includes four-panel output such as the long-run cointegration output displayed in panel A, the long-run and short-run coefficients exhibited in panels B and C, and the residual diagnostic test results available in panel D, respectively.
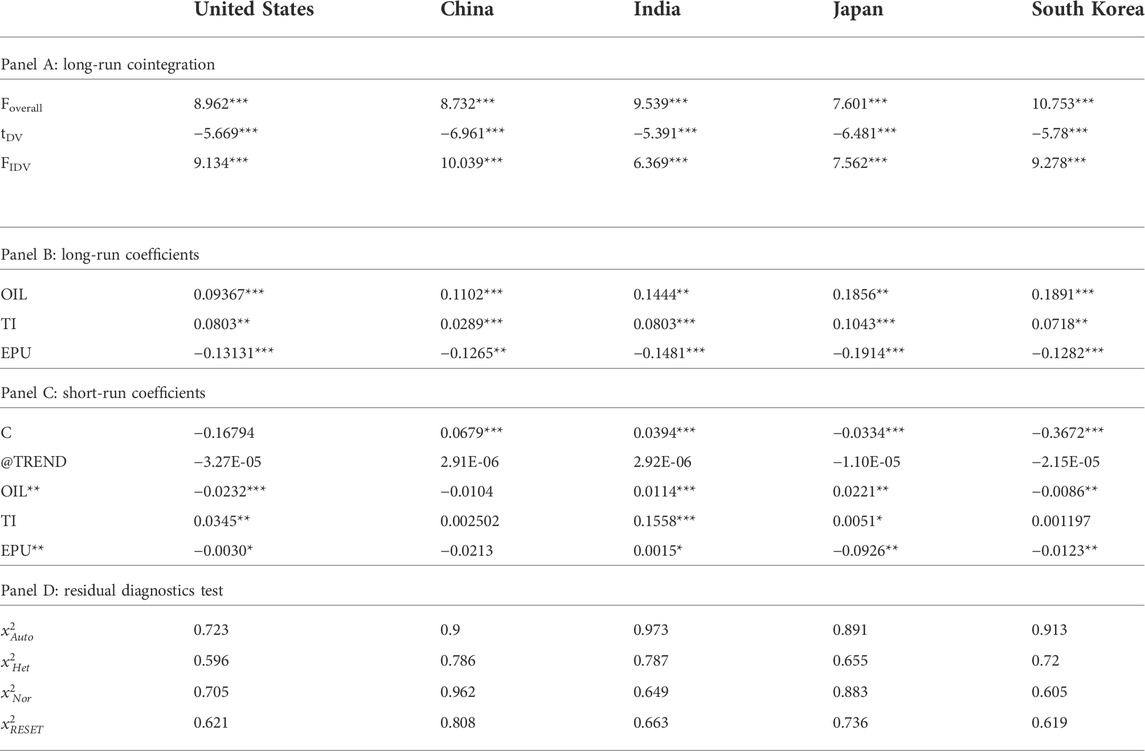
TABLE 5. Long-run and short-run coefficients from ARDL estimation.
The long-run cointegration results (see panel A) were derived from the proposed testing framework following Pesaran, Shin (Pesaran et al., 2001), Narayan and Smyth (2005), and Sam, McNown (Sam et al., 2019). The test statistics of Foverall, tDV, and FIDV have been found statistically significant at a 1% level. Alternatively, the test statistics are higher than the upper-bound critical value in all three assessments, suggesting a long-run association between economic policy uncertainty, oil price, environmental degradation, and renewable energy consumption. Once the long-run association has been documented, we next investigate the variable’s elasticities on renewable energy consumption in the long-run and short-run horizons.
In the long run (see panel B), for oil price impact on renewable energy consumption, the study documented a positive and statistically significant linkage to renewable energy consumption in the United States (a coefficient of 0.0937), China (a coefficient of 0.1102), India (a coefficient of 0.1444), Japan (a coefficient of 0.1856), and South Korea (a coefficient of 0.1891). Precisely, the study established that a 10% increase in oil price in the international market will result from positive effects on renewable energy consumption, indicating the shifting of the oil intense energy consumption to renewable sources with changes of 0.937% in the United States, 1.102% in China, 1.444% in India, 1.856% in Japan, and 1.891% in South Korea. Referring to short-run coefficients, the study revealed a negative association between oil price and renewable energy consumption in the United States (a coefficient of −0.0232), China (a coefficient of −0.0104), and South Korea (a coefficient of −0.0086). The study findings suggest that reduction in oil prices accelerates the inclusion and demand of renewable energy consumption in the economy, indicating that the energy transition from fossil fuel to renewable sources is a continuous and time-led process; therefore, any changes in the oil price, precisely reduction of oil price, does not motivate nations to stop energy transition activities. Furthermore, energy price reduction in the short run is ideally not conducive to increasing conventional consumption instead of renewable sources.
On the other hand, a positive linkage was unveiled in India (a coefficient of 0.0114) and Japan (a coefficient of 0.0221). Considering the coefficient magnitudes, it is apparent that long-run elasticity has revealed significance compared with the short-run assessment. Our study findings suggest that oil price changes positively support renewable energy inclusion, which is supported by the existing literature (see, for instance, Omri, Daly (Omri et al., 2015), Apergis and Payne (2015), Sadorsky (2009), Kyritsis and Serletis (2019), and Managi and Okimoto (2013)). However, our findings are opposite to those found in the existing literature offered by Mukhtarov, Mikayilov (Mukhtarov et al., (2020).
The study documented a positive and statistically significant link between technological innovation and renewable energy consumption in the sample economy. In the long run, a 10% further development in the process of technological integration will result in renewable energy inclusion over conventional energy by 0.803% in the United States, 0.0.289% in China, 0.803% in India, 1.043% in Japan, and by 0.718% in South Korea. The study findings suggest that technological advancement has been a blessing for energy development, particularly renewable energy development. Our findings are supported by the existing literature, such as Geng and Ji (2016), Khan, Chenggang (Khan et al., 2021), and Yüksel, Dinçer (Yüksel et al., 2020). Referring to short-run assessment, the study established positive connections in the United States (a coefficient of 0.0345), China (a coefficient of 0.0025), India (a coefficient of 0.1558), Japan (a coefficient of 0.0051), and South Korea (a coefficient of 0.00119). According to the elasticities of target variables, the long-run coefficients are more significant than the short-run coefficients.
Economic policy uncertainty has been found to adversely influence the process of renewable energy consumption; according to the long-run coefficient, a 1% excess EPU in the economy will result in renewable energy integration in the United States by −0.1313%, China by −0.1265%, India by −0.1481%, Japan by −0.1914%, and South Korea by −0.1282%. The study findings suggest that energy transition requires economic and financial stability, indicating that a progressive economic environment promotes clean energy integration with developing renewable energy and technologies in the economy. On account of short-run assessment, the study established a negative and statistically significant association between the United States (a coefficient of −0.0030), India (a coefficient of 0.0015), Japan (a coefficient of −0.0926), and South Korea (a coefficient of −0.0123), except in China. Our study findings suggest that the negative association between EPU and REC is supported by the existing literature of Appiah-Otoo (2021), Qamruzzaman, Karim (Qamruzzaman et al., 2022), and Lei, Liu (Lei et al., 2022).
5.3 Asymmetric estimation of oil price, technological innovation, and economic policy uncertainty
The results of the asymmetric estimation are displayed in Table 6, which includes panel A for asymmetric long-run cointegration, panel–B for asymmetric long-run coefficients, panel C for short-run coefficients, and panel D for residual diagnostic test output.
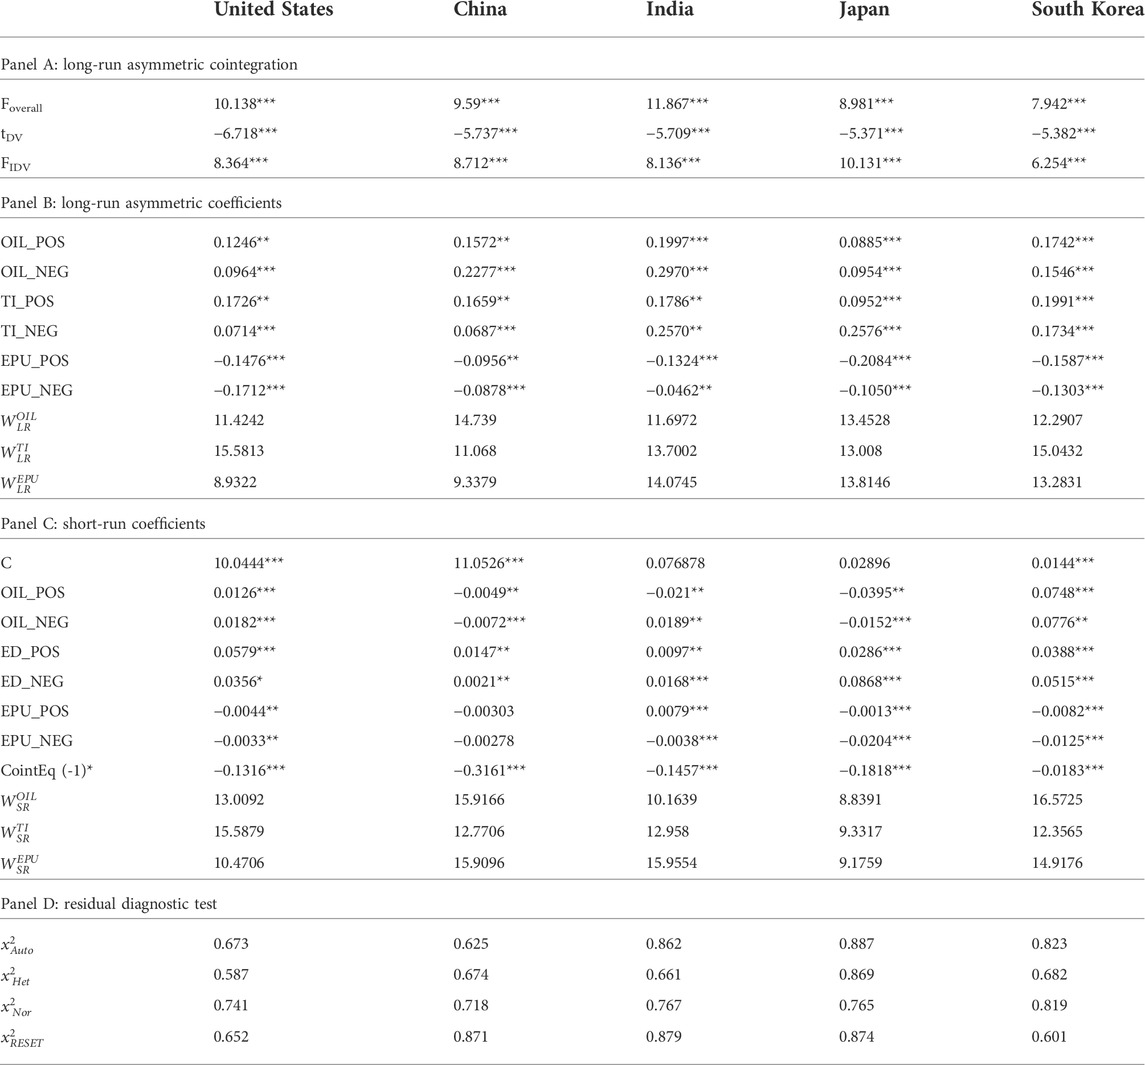
TABLE 6. Results of asymmetric effects of oil price, technological innovation, and economic policy uncertainty.
Referring to the results displayed in panel A, it is apparent that the test statistics from the standard Wald test have rejected the null hypothesis of “no cointegration.” Alternatively, it established the presence of an asymmetric long-run association available among economic policy uncertainty, technological innovation, oil price, and renewable energy consumption. Once the long-run association had been established, we next assessed the asymmetric elasticity of independent variables on REC.
For long-run asymmetric assessment (see panel B),in the case of oil price asymmetric effects on renewable energy consumption, the study documented a positive and statistically significant link between positive (negative) shocks of oil price and renewable energy consumption in the United States with a coefficient of 0.1246 (0.0964), China with a coefficient of 0.1572 (0.2277), India with a coefficient of 0.1997 (0.2970), Japan with a coefficient of 0.0885 (0.0954), and South Korea with a coefficient of 0.1742 (0.1546). In particular, a 10% increase in oil price will result in additional demand for renewable energy consumption in the United States by 1.246%, China by 1.572%, India by 1.997%, Japan by 0.885%, and South Korea by 1.749%. However, the same negative change that is the reduction in oil price acts as a deterrent factor for renewable energy consumption in the U.S. economy by 0.964%, in the Chinese economy by 2.277%, in the Indian economy by 2.970%, in the Japanese economy by 0.954%, and in the South Korean economy by 1.546%. Our study found that asymmetric shocks of oil prices positively connected to renewable energy are supported by the existing literature (see, for instance, Lee and Baek (2018)). In the short run, the study disclosed a positive (negative) variation in oil prices and revealed a positive (positive) and significant linkage between the United States and South Korea and a negative (negative) connection between China and Japan. Furthermore, positive shocks exposed negative connections and negative shocks exposed a positive connection to renewable energy consumption in India. In particular, a 10% positive (negative) change in oil price will result in an increase (decrease) in renewable energy consumption in the United States by 0.126% (0.182%) and South Korea by 0.0748% (0.0776%). Furthermore, a 10% asymmetric shock in oil prices will result in a renewable energy consumption decrease in China and Japan, suggesting that small firms prefer to use the readily available energy for their operation; on the other hand, renewable energy sources require capital investment for use, and therefore, short-run price changes induce small firms to opt for conventional energy rather than renewable sources.
The study refers to asymmetric effects of technological innovation on renewable energy consumption in top oil-importing nations. In the long run, the study documented positive (negative) shocks of technological innovation positively connected to renewable energy consumption in the United States with a coefficient of 0.1726 (0.0714), in China with a coefficient of 0.1659 (0.0687), in India with a coefficient of 0.1786 (0.2570), in Japan with a coefficient of 0.0952 (0.2576), and in South Korea with a coefficient of 0.1991 (0.1734). The asymmetric assessment suggested that technological innovation has emerged as the catalyst for energy transition, precisely the inclusion of renewable energy, whereas the degradation of technological development can preclude renewable energy integration and augment environmental adversity. According to short-run coefficients, a positive connection with renewable energy consumption is apparently observed, in particular a 1% positive (negative) shocks in technological innovation results in renewable energy development (degradation) in the United States by 0.0579% (0.0356%), China by 0.0147% (0.0021%), India by 0.0097% (0.0168%), Japan by 0.0286% (0.0868%), and in South Korea by 0.0286% (0.0868%). In comparison, the long-run asymmetric shocks of technological innovation have disclosed more significance than the short-run innovation in technological development.
According to asymmetric assessment, economic policy uncertainty adversely influenced renewable energy development and integration in the economy in the long and short run. Referring to long-run asymmetric output, the positive (negative) variations in EPU have revealed a negative (negative) connection to renewable energy consumption in the United States with a coefficient of −0.1476 (−0.1712), China with a coefficient of −0.0956 (−0.0878), India with a coefficient of −0.1324 (−0.0462), Japan with a coefficient of −0.2084 (−0.1050), and South Korea with a coefficient of −0.1587 (−0.1303). In particular, a 10% positive shock in EPU will result from the decrease in clean energy integration in the United States by 1.476%, China by 0.956%, India by 1.324%, Japan by 2.084%, and South Korea by 1.587%. On the other hand, the economic stability of EPU by 10% can accelerate the clean energy inclusion in the economy by 1.712% in the United States, 0.878% in China, 0.462% in India, and 1.050% in Japan, and 1.303% in South Korea. The negative association between asymmetric shocks in EPU and renewable energy consumption is supported by Qamruzzaman, Karim (Qamruzzaman et al., 2022) and Lei, Liu (Lei et al., 2022). In addition to long-run assessment, the study revealed the negatively associated asymmetric shocks of EPU in the short run. The study findings suggest that an energy transition that includes clean energy from renewable sources can be intensified with the assurance of economic stability.
Next, the study implemented the Granger non-causality test following Toda and Yamamoto (1995) and the causality test results are displayed in Table 7. Referring to test statistics, the study documented several directional causalities among variables. However, we are focused on target relations. For the feedback hypothesis, the study established a connection between oil price and renewable energy consumption in China [OIL←→REC]; economic policy uncertainty and renewable energy consumption [EPU←→REC] in China, India, Japan, and South Korea; and technological innovation and renewable energy consumption [TI←→REC] in South Korea. Referring to unidirectional causality, oil price, economic policy uncertainty, and technological innovation in the United States established a directional effect transition to renewable energy consumption.
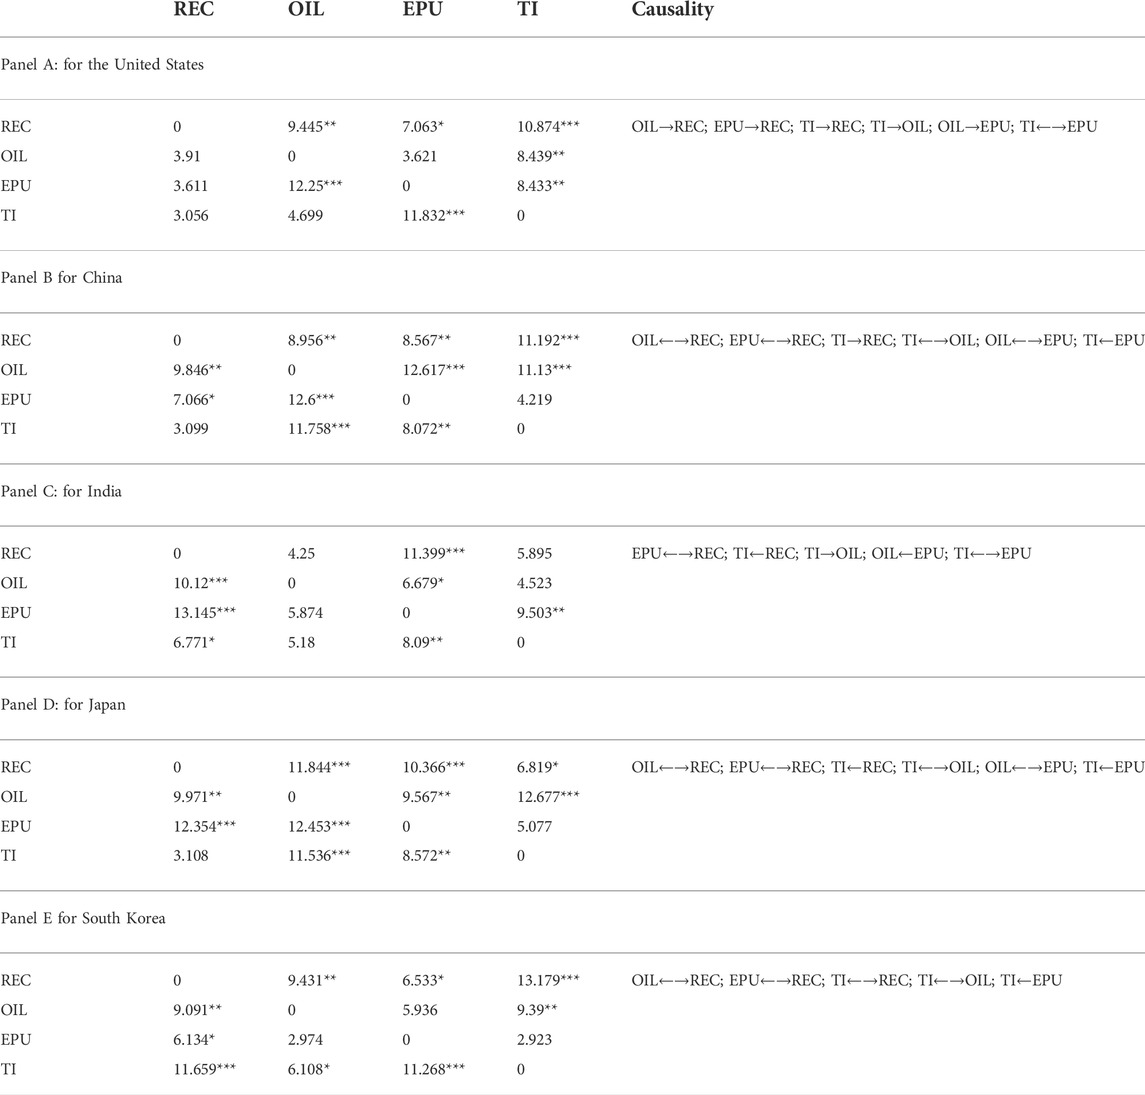
TABLE 7. Results of the directional causality test following Toda-Yamamoto.
4 Discussion
According to symmetric assessment, the study documented a positive and statistically significant linkage between oil prices and renewable energy consumption in all targeted economies. According to symmetric assessment, in the long run, a 10% increase in oil price in the international market will result from positive effects on renewable energy consumption, indicating the transition of the oil intense energy consumption to renewable sources with changes by 0.937% in the United States, 1.102% in China, 1.444% in India, 1.856% in Japan, and 1.891% in South Korea. Our study findings suggest that oil price changes positively support renewable energy inclusion, which is supported by the existing literature; see, for instance, Omri, Daly (Omri et al., 2015); Apergis and Payne (2015), Sadorsky (2009), Kyritsis and Serletis (2019), Managi and Okimoto (2013). In the case of China, Zhao, Zhang (Zhao et al., 2021) investigated the impact of international oil price changes on renewable energy consumption, and the study documented that international oil price increases (decreases) can accelerate (degrade) the output and investment in renewable energy. However, our findings are opposite to those of the existing literature offered by Mukhtarov, Mikayilov (Mukhtarov et al., 2020). Payne (2012) argues that there is no causal link between real oil prices and the deployment of renewable energy. Sadorsky (2009) argues that there is only a weak association between oil prices and renewable energy. Moreover, the link between renewable energy and oil pricing varies by country and time (Lee et al., 2017). The asymmetric oil price shocks on renewable energy consumption have revealed positive and statistically significant effects, especially in the long run. The asymmetric shocks of oil price on renewable energy consumption can be observed in the study of Long and Liang (2018), Wei (2019), and Zhang, Liu (Zhang et al., 2018).
The effects of technological innovation on renewable energy consumption have revealed positive and statistically significant linear and nonlinear assessments. The asymmetric assessment suggested that technological innovation has emerged as the catalyst for energy transition, precisely the inclusion of renewable energy, whereas the degradation of technological development can preclude renewable energy integration and augment environmental adversity. Furthermore, the importance of TI in reducing carbon dioxide emissions is widely established. The ecology of the host nations has improved, and CO2 emissions have decreased, thanks to technological progress and conservation initiatives. Technological advancement has the potential to make a big impact in areas like emission reduction and energy savings. The best way to use both traditional and alternative energy sources is to take advantage of the latest technological developments. Improvements in agricultural technology have opened the door to developing alternative energy sources. Future energy demand is more likely to be fulfilled by renewable sources due to technological advancements that have increased the potential for renewable energy. Many believe that renewable energy will soon become the dominant energy source, which is beneficial for the environment and can meet our growing energy needs.
The study documented that economic policy uncertainty adversely influenced renewable energy consumption in the economy both in the long and short run. Furthermore, according to asymmetric assessment, the positive and negative shocks of EPU are negatively tied to REC in the long and short run. Considering the study findings, it is established that economic stability has played the role of a catalyst in ensuring the smooth energy transition that is clean energy integration instead of fossil fuel reliance. Moreover, the investment in energy development, particularly for renewable energy output, requires economic stability because the demand for clean energy has been raised from domestic expansion with environmental concerns, which are established with the assurance of economic growth with no issue. In particular, a 10% positive shock in EPU will result from the decrease in clean energy integration in the United States by 1.476%, China by 0.956%, India by 1.324%, Japan by 2.084%, and South Korea by 1.587%. On the other hand, the economic stability of EPU by 10% can accelerate the clean energy inclusion in the economy by 1.712% in the United States, 0.878% in China, 0.462% in India, 1.050% in Japan, and 1.303% in South Korea. The negative association between asymmetric shocks in EPU and renewable energy consumption is supported by Qamruzzaman, Karim (Qamruzzaman et al., 2022) and Lei, Liu (Lei et al., 2022). In addition to long-run assessment, the study revealed the negatively associated asymmetric shocks of EPU in the short run. The study findings suggest that an energy transition that includes clean energy from renewable sources can be intensified with the assurance of economic stability. Furthermore, it is widely accepted that enormous expenditures are encountered in the renewable energy generating business, which may expedite the desired economies of scale, are the most efficient approach to reduce the costs of producing and using renewable energy.
5 Policy implications
On a policy note, the study suggested the following guidelines for future development. First, the transition from fossil fuels to renewable energy sources is shown in the growing demand for renewable energy as the price of oil increases, while the falling demand for renewable energy and the increased use of conventional energy in the industry are reflected in the falling price of oil. Furthermore, there is an asymmetry between the influence of increasing and decreasing worldwide oil prices on renewable energy usage, with the latter having a more significant effect. As a result, we argue that policymakers ought to pay greater attention to the damage that falling oil prices are causing to the renewable energy sector.
Economic and energy policies contribute significantly to increased uncertainty during periods of economic instability. An energy-efficient, ecologically friendly public and corporate environment must be established, maintained, and promoted while preserving economic stability. How successful it is in this endeavor will depend on how well its leaders comprehend the factors that influence energy use and the dynamics of those factors’ impacts over time. If businesses feel more uncertain, they can be less willing to invest in new technologies that enhance productivity or decrease energy usage. In light of this, a model formulation based on EPU implies that future energy usage may increase significantly.
Second, a smooth energy transition demands economic stability and financial support for the economy. The study suggested that effective monetary and fiscal policies bring stability to economic activities and ensure sustainability in economic progress, which eventually leads to investment in infrastructural and energy development. Thus, it is suggested that the government has to ensure institutional presence and contribution to ensure stability, which is imperative for clean energy inclusion and economic development.
6 Conclusion
The study aimed to investigate the effects of economic policy uncertainty, oil price, and technological innovation on renewable energy consumption. The study employed symmetric and asymmetric frameworks following Pesaran, Shin (Pesaran et al., 2001) and shin, Yu (Shin et al., 2014) to document fresh insight. According to linear assessment, the study documented positive effects from technological innovation and oil price volatility, whereas economic policy uncertainty adversely caused renewable energy integration, especially in the long run. The study disclosed long-run and short-run asymmetric connections between TI, EPU, and REC for asymmetric assessment. For the case of directional causality, the study documented feedback hypothesis that holds in to explain the nexus between oil price and renewable energy consumption in China [OIL←→REC]; economic policy uncertainty and renewable energy consumption [EPU←→REC] in China, India, Japan, and South Korea; and technological innovation and renewable energy consumption [TI←→REC] in South Korea.
Even though the present study has investigated the impact of EPU and oil prices on renewable energy consumption in top five oil-importing nations with the implementation of both linear and nonlinear frameworks, the present study possesses the following limitations, which can be addressed in future studies. First, inflows of FDI have critical significance on energy selection; thus, the existing empirical equation can be extended with the inclusion of FDI as an explanatory variable. Second, the inclusion of institutional quality in the assessment will result and explore the importance of effective institutional quality in fostering clean energy development.
Data availability statement
Publicly available datasets were analyzed in this study. These data can be found here: https://www.eia.gov/British Petroleum http://www.policyuncertainty.com/World Development Indicator.
Author contributions
MQ: Introduction, methodology, and empirical model estimation; GR: Conceptualization, discussion, first draft preparation, and final preparation.
Funding
The study has received financial support from the Institutions for Advanced Research (IAR), United International University, under Supplementary publication Grant—IAR/2022/PUB/010.
Conflict of interest
The authors declare that the research was conducted in the absence of any commercial or financial relationships that could be construed as a potential conflict of interest.
Publisher’s note
All claims expressed in this article are solely those of the authors and do not necessarily represent those of their affiliated organizations, or those of the publisher, the editors, and the reviewers. Any product that may be evaluated in this article, or claim that may be made by its manufacturer, is not guaranteed or endorsed by the publisher.
References
Adebayo, T. S., and Kirikkaleli, D. (2021). Impact of renewable energy consumption, globalization, and technological innovation on environmental degradation in Japan: Application of wavelet tools. Environment, Development and Sustainability 23 (11), 16057–16082. doi:10.1007/s10668-021-01322-2
Ahmad, M., Jabeen, G., Shah, S. A. A., Rehman, A., Ahmad, F., and Işik, C. (2022). Assessing long- and short-run dynamic interplay among balance of trade, aggregate economic output, real exchange rate, and CO2 emissions in Pakistan. Environ. Dev. Sustain. 24 (5), 7283–7323. doi:10.1007/s10668-021-01747-9
Ahmed, Z., Adebayo, T. S., Udemba, E. N., Murshed, M., and Kirikkaleli, D. (2022). Effects of economic complexity, economic growth, and renewable energy technology budgets on ecological footprint: The role of democratic accountability. Environ. Sci. Pollut. Res. 29 (17), 24925–24940. doi:10.1007/s11356-021-17673-2
Alola, A. A., Alola, U. V., and Akadiri, S. S. (2019). Renewable energy consumption in coastline mediterranean countries: Impact of environmental degradation and housing policy. Environ. Sci. Pollut. Res. 26 (25), 25789–25801. doi:10.1007/s11356-019-05502-6
Andriamahery, A., and Qamruzzaman, M. (2022). A symmetry and asymmetry investigation of the nexus between environmental sustainability, renewable energy, energy innovation, and trade: Evidence from environmental kuznets curve hypothesis in selected MENA countries. Front. Energy Res. 9 (873), 778202. doi:10.3389/fenrg.2021.778202
Apergis, N., and Payne, J. E. (2015). Renewable energy, output, carbon dioxide emissions, and oil prices: Evidence from south America. Energy Sources, Part B Econ. Plan. Policy 10 (3), 281–287. doi:10.1080/15567249.2013.853713
Appiah-Otoo, I. (2021). Impact of economic policy uncertainty on renewable energy growth. Energy Res. Lett. 2 (1), 19444. doi:10.46557/001c.19444
Asongu, S., El Montasser, G., and Toumi, H. (2016). Testing the relationships between energy consumption, CO2 emissions, and economic growth in 24 african countries: A panel ARDL approach. Environ. Sci. Pollut. Res. 23 (7), 6563–6573. doi:10.1007/s11356-015-5883-7
Attiaoui, I., Toumi, H., Ammouri, B., and Gargouri, I. (2017). Causality links among renewable energy consumption, CO2 emissions, and economic growth in Africa: Evidence from a panel ARDL-PMG approach. Environ. Sci. Pollut. Res. 24 (14), 13036–13048. doi:10.1007/s11356-017-8850-7
Awijen, H., Belaïd, F., Zaied, Y. B., Hussain, N., and Lahouel, B. B. (2022). Renewable energy deployment in the MENA region: Does innovation matter? Technol. Forecast. Soc. Change 179, 121633. doi:10.1016/j.techfore.2022.121633
Badshah, I., Demirer, R., and Suleman, M. T. (2019). The effect of economic policy uncertainty on stock-commodity correlations and its implications on optimal hedging. Energy Econ. 84, 104553. doi:10.1016/j.eneco.2019.104553
Bai, C., Feng, C., Yan, H., Yi, X., Chen, Z., and Wei, W. (2020). Will income inequality influence the abatement effect of renewable energy technological innovation on carbon dioxide emissions? J. Environ. Manag. 264, 110482. doi:10.1016/j.jenvman.2020.110482
Baker, S. R., Bloom, N., and Davis, S. J. (2016). Measuring economic policy uncertainty. Q. J. Econ. 131 (4), 1593–1636. doi:10.1093/qje/qjw024
Bamati, N., and Raoofi, A. (2020). Development level and the impact of technological factor on renewable energy production. Renew. Energy 151, 946–955. doi:10.1016/j.renene.2019.11.098
Banerjee, A., Dolado, J., and Mestre, R. (1998). Error-correction mechanism tests for cointegration in a single-equation framework. J. Time Ser. Analysis 19 (3), 267–283. doi:10.1111/1467-9892.00091
Banerjee, A., Dolado, J. J., Galbraith, J. W., and Hendry, D. (1993). Co-integration, error correction, and the econometric analysis of non-stationary data. OUP Catalogue.
Banga, C., Deka, A., Kilic, H., Ozturen, A., and Ozdeser, H. (2022). The role of clean energy in the development of sustainable tourism: Does renewable energy use help mitigate environmental pollution? A panel data analysis. Environ. Sci. Pollut. Res. 29, 59363–59373. doi:10.1007/s11356-022-19991-5
Bayer, C., and Hanck, C. (2013). Combining non-cointegration tests. J. Time Ser. Analysis 34 (1), 83–95. doi:10.1111/j.1467-9892.2012.00814.x
Boutabba, M. A. (2014). The impact of financial development, income, energy and trade on carbon emissions: Evidence from the Indian economy. Econ. Model. 40, 33–41. doi:10.1016/j.econmod.2014.03.005
Chaudhry, I. S., Azali, M., Faheem, M., and Ali, S. (2020). Asymmetric dynamics of oil price and environmental degradation: Evidence from Pakistan. Rev. Econ. Dev. Stud. 6 (1), 1–12. doi:10.47067/reads.v6i1.179
Chen, C., Pinar, M., and Stengos, T. (2021). Determinants of renewable energy consumption: Importance of democratic institutions. Renew. Energy 179, 75–83. doi:10.1016/j.renene.2021.07.030
Chen, M., Sinha, A., Hu, K., and Shah, M. I. (2021). Impact of technological innovation on energy efficiency in industry 4.0 era: Moderation of shadow economy in sustainable development. Technol. Forecast. Soc. Change 164, 120521. doi:10.1016/j.techfore.2020.120521
Chien, F., Hsu, C-C., Ozturk, I., Sharif, A., and Sadiq, M. (2022). The role of renewable energy and urbanization towards greenhouse gas emission in top Asian countries: Evidence from advance panel estimations. Renew. Energy 186, 207–216. doi:10.1016/j.renene.2021.12.118
Cui, L., Weng, S., Nadeem, A. M., Rafique, M. Z., and Shahzad, U. (2022). Exploring the role of renewable energy, urbanization and structural change for environmental sustainability: Comparative analysis for practical implications. Renew. Energy 184, 215–224. doi:10.1016/j.renene.2021.11.075
Dai, M., Qamruzzaman, M., and Hamadelneel Adow, A. (2022). An assessment of the impact of natural resource price and global economic policy uncertainty on financial asset performance: Evidence from bitcoin. Front. Environ. Sci. 10. doi:10.3389/fenvs.2022.897496
Dickey, D. A., and Fuller, W. A. (1979). Distribution of the estimators for autoregressive time series with a unit root. J. Am. Stat. Assoc. 74 (366), 427–431. doi:10.2307/2286348
Dogan, E., and Shah, S. F. (2021). Analyzing the role of renewable energy and energy intensity in the ecological footprint of the United Arab Emirates. Sustainability 14 (1), 227. doi:10.3390/su14010227
Dong, F., Zhu, J., Li, Y., Chen, Y., Gao, Y., Hu, M., et al. (2022). How green technology innovation affects carbon emission efficiency: Evidence from developed countries proposing carbon neutrality targets. Environ. Sci. Pollut. Res. 29 (24), 35780–35799. doi:10.1007/s11356-022-18581-9
Economic Policy Uncertainty Index (2021). Economic policy uncertainty index 2021. Available from: https://www.policyuncertainty.com/all_country_data.html.
Elliott, G., Rothenberg, T. J., and Stock, J. (1996). Efficient tests for an autoregressive unit root. Econometrica 64 (4), 813–836. doi:10.2307/2171846
Engle, R. F., and Granger, C. W. (1987). Co-Integration and error correction: Representation, estimation, and testing. Econometrica 55, 251–276. doi:10.2307/1913236
Ergun, S. J., Owusu, P. A., and Rivas, M. F. (2019). Determinants of renewable energy consumption in Africa. Environ. Sci. Pollut. Res. 26 (15), 15390–15405. doi:10.1007/s11356-019-04567-7
Farhana, F., and Md, Q. (2017). “Export, import, economic growth, and carbon emissions in Bangladesh: A granger causality test under VAR (restricted) environment,” in Management of Cities and Regions. Editor B. Vito. IntechOpen, 6. doi:10.5772/intechopen.70782
Faruqui, G. A., Ara, L. A., and Acma, Q. (2015). TTIP and TPP: Impact on Bangladesh and India economy. Pac. Bus. Rev. Int. 8 (2), 59–67.
Farzanegan, M. R., and Markwardt, G. (2009). The effects of oil price shocks on the Iranian economy. Energy Econ. 31 (1), 134–151. doi:10.1016/j.eneco.2008.09.003
Geng, J-B., and Ji, Q. (2016). Technological innovation and renewable energy development: Evidence based on patent counts. Int. J. Glob. Environ. Issues 15 (3), 217–234. doi:10.1504/ijgenvi.2016.076945
Ghatak, S., and Ju, S. (2001). The use of the ARDL approach in estimating virtual exchange rates in India. J. Appl. Statistics 28 (5), 573–583. doi:10.1080/02664760120047906
Godil, D. I., Yu, Z., Sharif, A., Usman, R., and Khan, S. A. R. (2021). Investigate the role of technology innovation and renewable energy in reducing transport sector CO2 emission in China: A path toward sustainable development. Sustain. Dev. 29 (4), 694–707. doi:10.1002/sd.2167
Guan, C., and Qamruzzaman, M. (2022). A symmetric and asymmetric nexus between environmental sustainability and tourism development in BRIC nations: What is the role of good governance and globalization? Front. Environ. Sci. 10. doi:10.3389/fenvs.2022.973420
Gyimah, J., Yao, X., Tachega, M. A., Sam Hayford, I., and Opoku-Mensah, E. (2022). Renewable energy consumption and economic growth: New evidence from Ghana. Energy 248, 123559. doi:10.1016/j.energy.2022.123559
He, A., Xue, Q., Zhao, R., and Wang, D. (2021). Renewable energy technological innovation, market forces, and carbon emission efficiency. Sci. Total Environ. 796, 148908. doi:10.1016/j.scitotenv.2021.148908
Hsiao, C. Y., Lin, W., Wei, X., Yan, G., Li, S., and Sheng, N. (2019). The impact of international oil prices on the stock price fluctuations of China’s renewable energy enterprises. Energies 12 (24), 4630. doi:10.3390/en12244630
Imf.org. (2018). IMF Data [online]. Available from: http://www.imf.org/external/data.htm#global. (accessed March 12, 2019)
Ivanovski, K., and Marinucci, N. (2021). Policy uncertainty and renewable energy: Exploring the implications for global energy transitions, energy security, and environmental risk management. Energy Res. Soc. Sci. 82, 102415. doi:10.1016/j.erss.2021.102415
Jia, Z., Wen, S., and Lin, B. (2021). The effects and reacts of COVID-19 pandemic and international oil price on energy, economy, and environment in China. Appl. Energy 302, 117612. doi:10.1016/j.apenergy.2021.117612
Johansen, S. (1991). Estimation and hypothesis testing of cointegration vectors in Gaussian vector autoregressive models. Econometrica 59, 1551–1580. doi:10.2307/2938278
Johansen, S. (1998). Statistical analysis of co integration vectors. J. Econ. Dyn. Control 10 (4), 231–254. doi:10.1016/0165-1889(88)90041-3
Johansen, S., and Juselius, K. (1990). Maximum likelihood estimation and inference on cointegration – with applications to the demand for money. Oxf. Bull. Econ. Statistics 51, 169–210. doi:10.1111/j.1468-0084.1990.mp52002003.x
Kang, W., and Ratti, R. A. (2013). Oil shocks, policy uncertainty and stock market return. J. Int. Financial Mark. Institutions Money 26, 305–318. doi:10.1016/j.intfin.2013.07.001
Khan, A., Chenggang, Y., Hussain, J., and Kui, Z. (2021). Impact of technological innovation, financial development and foreign direct investment on renewable energy, non-renewable energy and the environment in belt & Road Initiative countries. Renew. Energy 171, 479–491. doi:10.1016/j.renene.2021.02.075
Khattak, S. I., Ahmad, M., Khan, Z. U., and Khan, A. (2020). Exploring the impact of innovation, renewable energy consumption, and income on CO2 emissions: New evidence from the BRICS economies. Environ. Sci. Pollut. Res. 27 (12), 13866–13881. doi:10.1007/s11356-020-07876-4
Kim, I-M., and Loungani, P. (1992). The role of energy in real business cycle models. J. Monetary Econ. 29 (2), 173–189. doi:10.1016/0304-3932(92)90011-p
Kwiatkowski, D., Phillips, P., Schmidt, P., and Shin, Y. (1992). Testing the null hypothesis of stationarity against the alternative of a unit root: How sure are we that economic time series have a unit root? J. Econ. 54 (1-3), 159–178. doi:10.1016/0304-4076(92)90104-y
Kyritsis, E., and Serletis, A. (2019). Oil prices and the renewable energy sector. Energy J. 40. doi:10.5547/01956574.40.si1.ekyr
Lee, C-Y., and Tang, C. F. (2022). The threshold and contingency effects of technological innovation on renewable energy. Energy Sources, Part B Econ. Plan. Policy, 1–16. doi:10.1080/15567249.2021.1999346
Lee, D., and Baek, J. (2018). Stock prices of renewable energy firms: Are there asymmetric responses to oil price changes? Economies 6 (4), 59. doi:10.3390/economies6040059
Lee, D. H., Kang, D., Rzayeva, I., and Rho, J. J. (2017). Effects of energy diversification policy against crude oil price fluctuations. Energy Sources, Part B Econ. Plan. Policy 12 (2), 166–171. doi:10.1080/15567249.2014.950393
Lei, W., Liu, L., Hafeez, M., and Sohail, S. (2022). Do economic policy uncertainty and financial development influence the renewable energy consumption levels in China? Environ. Sci. Pollut. Res. 29 (5), 7907–7916. doi:10.1007/s11356-021-16194-2
Li, J., and Qamruzzaman, M. (2022). Dose tourism induce Sustainable Human capital development in BRICS through the channel of capital formation and financial development: Evidence from Augmented ARDL with structural Break and Fourier TY causality. Front. Psychol. 13, 804349. doi:10.3389/fpsyg.2022.804349
Long, S., and Liang, J. (2018). Asymmetric and nonlinear pass-through of global crude oil price to China’s PPI and CPI inflation. Econ. Research-Ekonomska Istraživanja 31 (1), 240–251. doi:10.1080/1331677x.2018.1429292
Ma, J., Wang, J., and Shen, X. (2022). Economic policy uncertainty and green economy efficiency: Power or resistance?—empirical evidence from Chinese major urban agglomerations. Econ. Research-Ekonomska Istraz. 35 (1), 657–675. doi:10.1080/1331677x.2021.1931911
Ma, R., and Qamruzzaman, M. (2022). Nexus between government debt, economic policy uncertainty, government spending, and governmental effectiveness in BRIC nations: Evidence for linear and nonlinear assessments. Front. Environ. Sci. 10, 952452. doi:10.3389/fenvs.2022.952452
Managi, S., and Okimoto, T. (2013). Does the price of oil interact with clean energy prices in the stock market? Jpn. World Econ. 27, 1–9. doi:10.1016/j.japwor.2013.03.003
McNown, R., Sam, C. Y., and Goh, S. K. (2018). Bootstrapping the autoregressive distributed lag test for cointegration. Appl. Econ. 50 (13), 1509–1521. doi:10.1080/00036846.2017.1366643
Meng, L., Qamruzzaman, M., and Adow, A. H. E. (2021). Technological adaption and open innovation in SMEs: An strategic assessment for women-owned SMEs sustainability in Bangladesh. Sustainability 13 (5), 2942. doi:10.3390/su13052942
Miao, M., and Qamruzzaman, M. (2021). Dose remittances matter for openness and financial stability: Evidence from least developed economies. Front. Psychol. 12 (2606), 696600. doi:10.3389/fpsyg.2021.696600
Miao, Y., Razzaq, A., Adebayo, T. S., and Awosusi, A. A. (2022). Do renewable energy consumption and financial globalisation contribute to ecological sustainability in newly industrialized countries? Renew. Energy 187, 688–697. doi:10.1016/j.renene.2022.01.073
Mohsin, M., Kamran, H. W., Nawaz, M. A., Hussain, M. S., and Dahri, A. S. (2021). Assessing the impact of transition from nonrenewable to renewable energy consumption on economic growth-environmental nexus from developing Asian economies. J. Environ. Manag. 284, 111999. doi:10.1016/j.jenvman.2021.111999
Mughal, N., Arif, A., Jain, V., Chupradit, S., Shabbir, M. S., Ramos-Meza, C. S., et al. (2022). The role of technological innovation in environmental pollution, energy consumption and sustainable economic growth: Evidence from South Asian economies. Energy Strategy Rev. 39, 100745. doi:10.1016/j.esr.2021.100745
Mukhtarov, S., Mikayilov, J. I., Humbatova, S., and Muradov, V. (2020). Do high oil prices obstruct the transition to renewable energy consumption? Sustainability 12 (11), 4689. doi:10.3390/su12114689
Mukhtarov, S., Mikayilov, J. I., Maharramov, S., Aliyev, J., and Suleymanov, E. (2022). Higher oil prices, are they good or bad for renewable energy consumption: The case of Iran? Renew. Energy 186, 411–419. doi:10.1016/j.renene.2021.12.135
Murshed, M. (2021). Can regional trade integration facilitate renewable energy transition to ensure energy sustainability in South Asia? Energy Rep. 7, 808–821. doi:10.1016/j.egyr.2021.01.038
Murshed, M., and Tanha, M. M. (2021). Oil price shocks and renewable energy transition: Empirical evidence from net oil-importing South Asian economies. Energy Ecol. Environ. 6 (3), 183–203. doi:10.1007/s40974-020-00168-0
Nair, M., Arvin, M. B., Pradhan, R. P., and Bahmani, S. (2021). Is higher economic growth possible through better institutional quality and a lower carbon footprint? Evidence from developing countries. Renew. Energy 167, 132–145. doi:10.1016/j.renene.2020.11.056
Narayan, P. K., and Smyth, R. (2005). The residential demand for electricity in Australia: An application of the bounds testing approach to cointegration. Energy Policy 33 (4), 467–474. doi:10.1016/j.enpol.2003.08.011
Niu, J. (2021). The impact of technological innovation on carbon emissions. E3S Web Conf. 275, 02039. doi:10.1051/e3sconf/202127502039
Omri, A., Daly, S., and Nguyen, D. K. (2015). A robust analysis of the relationship between renewable energy consumption and its main drivers. Appl. Econ. 47 (28), 2913–2923. doi:10.1080/00036846.2015.1011312
Omri, A., and Saidi, K. (2022). Factors influencing CO2 emissions in the MENA countries: The roles of renewable and non-renewable energy. Environ. Sci. Pollut. Res. 29, 55890–55901. doi:10.1007/s11356-022-19727-5
Padhan, H., Padhang, P. C., Tiwari, A. K., Ahmed, R., and Hammoudeh, S. (2020). Renewable energy consumption and robust globalization(s) in OECD countries: Do oil, carbon emissions and economic activity matter? Energy Strategy Rev. 32, 100535. doi:10.1016/j.esr.2020.100535
Payne, J. E. (2012). The causal dynamics between US renewable energy consumption, output, emissions, and oil prices. Energy Sources, Part B Econ. Plan. Policy 7 (4), 323–330. doi:10.1080/15567249.2011.595248
Pesaran, M. H., Shin, Y., and Smith, R. J. (2001). Bounds testing approaches to the analysis of level relationships. J. Appl. Econ. Chichester. Engl. 16 (3), 289–326. doi:10.1002/jae.616
Peter Boswijk, H. (1994). Testing for an unstable root in conditional and structural error correction models. J. Econ. 63 (1), 37–60. doi:10.1016/0304-4076(93)01560-9
Phillips, P. C. B., and Perron, P. (1988). Testing for a unit root in time series regression. Biometrika 75 (2), 335–346. doi:10.1093/biomet/75.2.335
Qamruzzaman, M. (2022). A symmetry and asymmetry investigation of the nexus between environmental sustainability, renewable energy, energy innovation, and trade: Evidence from environmental kuznets curve hypothesis in selected MENA countries. Front. Energy Res. 9, 873. doi:10.3389/fenrg.2021.778202
Qamruzzaman, M. (2022). An asymmetric investigation of the nexus between economic policy uncertainty, knowledge spillover, climate change and green economy: Evidence from BRIC nations. Front. Environ. Sci. 9, 682. doi:10.3389/fenvs.2021.807424
Qamruzzaman, M. (2015). Determinants of foreign direct investment (FDI): Evidence from Bangladesh. Pac. Bus. Rev. Int. 7 (10), 97
Qamruzzaman, M., and Ferdaous, J. (2015). Building a knowledge-based economy in Bangladesh. Asian Bus. Rev. 4 (3), 41–49. doi:10.18034/abr.v4i3.266
Qamruzzaman, M., and Jianguo, W. (2017). Financial innovation and economic growth in Bangladesh. Financ. Innov. 3 (1), 19–24. doi:10.1186/s40854-017-0070-0
Qamruzzaman, M., Jianguo, W., Jahan, S., and Yingjun, Z. (2020). Financial innovation, human capital development, and economic growth of selected South Asian countries: An application of ARDL approach. Int. J. Fin. Econ. 26, 4032–4053. doi:10.1002/ijfe.2003
Qamruzzaman, M., and Jianguo, W. (2018). SME financing innovation and SME development in Bangladesh: An application of ARDL. J. Small Bus. Entrepreneursh. 31, 521–545. doi:10.1080/08276331.2018.1468975
Qamruzzaman, M., and Karim, S. (2020). Do remittance and financial innovation causes stock price through financial development: An application of nonlinear framework. Fourrages 242 (7), 38–68.
Qamruzzaman, M., Karim, S., and Jahan, I. (2022). Nexus between economic policy uncertainty, foreign direct investment, government debt and renewable energy consumption in 13 top oil importing nations: Evidence from the symmetric and asymmetric investigation. Renewable Energy 195, 121
Qamruzzaman, M., and Karim, S. (2020). Nexus between economic volatility, trade openness and FDI: An application of ARDL, NARDL and asymmetric causality. Asian Econ. Financial Rev. 10 (7), 790–807. doi:10.18488/journal.aefr.2020.107.790.807
Qamruzzaman, M. (2022). “Nexus between economic policy uncertainty and institutional quality: Evidence from Indian and Pakistan,” in Macroeconomics and finance in emerging market economies, 1–20. doi:10.1080/17520843.2022.2026035
Qamruzzaman, M. (2022a). Nexus between foreign direct investments renewable energy consumption: What is the role of Government debt? Int. J. Multidiscip. Res. Growth Eval. 3 (3), 514
Qamruzzaman, M. (2022). Nexus between renewable energy, foreign direct investment, and agro-productivity: The mediating role of carbon emission. Renewable Energy 88, 1
Qamruzzaman, M. (2022). Nexus between renewable energy, foreign direct investment, and agro-productivity: The mediating role of carbon emission. Renewable Energy 184, 526–540. doi:10.1016/j.renene.2021.11.092
Qianqian, Z. (2011). The impact of international oil price fluctuation on China's economy. Energy Procedia 5, 1360–1364. doi:10.1016/j.egypro.2011.03.235
Rafiq, S., Salim, R., and Bloch, H. (2009). Impact of crude oil price volatility on economic activities: An empirical investigation in the Thai economy. Resour. Policy 34 (3), 121–132. doi:10.1016/j.resourpol.2008.09.001
Rehman, A., Ma, H., Ahmad, M., Ozturk, I., and Işık, C. (2021). Estimating the connection of information technology, foreign direct investment, trade, renewable energy and economic progress in Pakistan: Evidence from ARDL approach and cointegrating regression analysis. Environ. Sci. Pollut. Res. 28 (36), 50623–50635. doi:10.1007/s11356-021-14303-9
Sadorsky, P. (2009). Renewable energy consumption, CO2 emissions and oil prices in the G7 countries. Energy Econ. 31 (3), 456–462. doi:10.1016/j.eneco.2008.12.010
Sam, C. Y., McNown, R., and Goh, S. K. (2019). An augmented autoregressive distributed lag bounds test for cointegration. Econ. Model. 80, 130–141. doi:10.1016/j.econmod.2018.11.001
Santra, S. (2017). The effect of technological innovation on production-based energy and CO2 emission productivity : Evidence from BRICS countries. Afr. J. Sci. Technol. Innovation Dev. 9 (5), 503–512. doi:10.1080/20421338.2017.1308069
Scarcioffolo, A. R., and Etienne, X. L. (2021). Regime-switching energy price volatility: The role of economic policy uncertainty. Int. Rev. Econ. Finance 76, 336–356. doi:10.1016/j.iref.2021.05.012
Shin, Y., Yu, B., and Greenwood-Nimmo, M. (2014). “Modelling asymmetric cointegration and dynamic multipliers in a nonlinear ARDL framework,” in Festschrift in honor of peter schmidt. Editor R. Sickles, and W. Horrace. (New York, NY: Springer). doi:10.1007/978-1-4899-8008-3_9
Song, Y., Ji, Q., Du, Y-J., and Geng, J-B. (2019). The dynamic dependence of fossil energy, investor sentiment and renewable energy stock markets. Energy Econ. 84, 104564. doi:10.1016/j.eneco.2019.104564
Sun, H., Lu, S., and Solaymani, S. (2021). Impacts of oil price uncertainty on energy efficiency, economy, and environment of Malaysia: Stochastic approach and CGE model. Energy Effic. 14 (2), 21. doi:10.1007/s12053-020-09924-x
Töbelmann, D., and Wendler, T. (2020). The impact of environmental innovation on carbon dioxide emissions. J. Clean. Prod. 244, 118787. doi:10.1016/j.jclepro.2019.118787
Toda, H. Y., and Yamamoto, T. (1995). Statistical inference in vector autoregressions with possibly integrated processes. J. Econ. 66 (1-2), 225–250. doi:10.1016/0304-4076(94)01616-8
Toumi, S., and Toumi, H. (2019). Asymmetric causality among renewable energy consumption, CO2 emissions, and economic growth in KSA: Evidence from a non-linear ARDL model. Environ. Sci. Pollut. Res. 26 (16), 16145–16156. doi:10.1007/s11356-019-04955-z
Troster, V., Shahbaz, M., and Uddin, G. S. (2018). Renewable energy, oil prices, and economic activity: A granger-causality in quantiles analysis. Energy Econ. 70, 440–452. doi:10.1016/j.eneco.2018.01.029
U.S. Energy Information Administration (2021). International energy statistics. U.S. Energy Information Administration. Available from: https://www.eia.gov/outlooks/ieo/.
Usman, M., Jahanger, A., Makhdum, M. S. A., Balsalobre-Lorente, D., and Bashir, A. (2022). How do financial development, energy consumption, natural resources, and globalization affect arctic countries' economic growth and environmental quality? An advanced panel data simulation. Energy 241, 122515. doi:10.1016/j.energy.2021.122515
Uzar, U. (2020). Is income inequality a driver for renewable energy consumption? J. Clean. Prod. 255, 120287. doi:10.1016/j.jclepro.2020.120287
Wang, C., Xia, M., Wang, P., and Xu, J. (2022). Renewable energy output, energy efficiency and cleaner energy: Evidence from non-parametric approach for emerging seven economies. Renew. Energy 198, 91–99. doi:10.1016/j.renene.2022.07.154
Wei, Y. (2019). The relationship between oil and non-oil commodity prices and China’s PPI and CPI: An empirical analysis. Energy Sources, Part B Econ. Plan. Policy 14 (4), 125–146. doi:10.1080/15567249.2019.1630032
Weixiang, S., Qamruzzaman, M., Rui, W., and Kler, R. (2022). An empirical assessment of financial literacy and behavioral biases on investment decision: Fresh evidence from small investor perception. Front. Psychol. 13, 977444. doi:10.3389/fpsyg.2022.977444
World Bank (2022). World development indicators. World Bank. Available from: http://data.worldbank.org/data-catalog/world-development-indicators.
Xia, C., Qamruzzaman, M., and Adow, A. H. (2022). An asymmetric nexus: Remittance-led human capital development in the top 10 remittance-receiving countries: Are FDI and gross capital formation critical for a road to sustainability? Sustainability 14 (6), 3703. doi:10.3390/su14063703
Yu, J., Shi, X., Guo, D., and Yang, L. (2021). Economic policy uncertainty (EPU) and firm carbon emissions: Evidence using a China provincial EPU index. Energy Econ. 94, 105071. doi:10.1016/j.eneco.2020.105071
Yüksel, S., Dinçer, H., and Uluer, G. S. (2020). “The role of technological development on renewable energy usage: An econometric analysis for G7 countries,” in Handbook of research on sustainable supply chain management for the global economy (IGI Global), 136. doi:10.4018/978-1-7998-4601-7.ch007
Zafar, M. W., Saleem, M. M., Destek, M. A., and Caglar, A. E. (2022). The dynamic linkage between remittances, export diversification, education, renewable energy consumption, economic growth, and CO 2 emissions in top remittance‐receiving countries. Sustain. Dev. 30 (1), 165–175. doi:10.1002/sd.2236
Zeng, Q., and Yue, X. (2022). Re-evaluating the asymmetric economic policy uncertainty, conventional energy, and renewable energy consumption nexus for BRICS. Environ. Sci. Pollut. Res. 29 (14), 20347–20356. doi:10.1007/s11356-021-17133-x
Zhang, X., Liu, X., Hang, J., and Yao, D. (2018). The dynamic causality between commodity prices, inflation and output in China: A bootstrap rolling window approach. Appl. Econ. 50 (4), 407–425. doi:10.1080/00036846.2017.1321835
Zhang, Y., Qamruzzaman, M., Karim, S., and Jahan, I. (2021). Nexus between economic policy uncertainty and renewable energy consumption in BRIC nations: The mediating role of foreign direct investment and financial development. Energies 14 (15), 4687. doi:10.3390/en14154687
Zhao, Y., Zhang, Y., and Wei, W. (2021). Quantifying international oil price shocks on renewable energy development in China. Appl. Econ. 53 (3), 329–344. doi:10.1080/00036846.2020.1808173
Keywords: economic policy uncertainty, oil price, renewable energy consumption, technological innovation, linear and nonlinear ARDL
Citation: Rong G and Qamruzzaman M (2022) Symmetric and asymmetric nexus between economic policy uncertainty, oil price, and renewable energy consumption in the United States, China, India, Japan, and South Korea: Does technological innovation influence?. Front. Energy Res. 10:973557. doi: 10.3389/fenrg.2022.973557
Received: 20 June 2022; Accepted: 28 October 2022;
Published: 15 November 2022.
Edited by:
Alan Mickelson, University of Colorado Boulder, United StatesReviewed by:
Onder Ozgur, Ankara Yıldırım Beyazıt University, TurkeyVikash Saini, Malaviya National Institute of Technology, Jaipur, India
Copyright © 2022 Rong and Qamruzzaman. This is an open-access article distributed under the terms of the Creative Commons Attribution License (CC BY). The use, distribution or reproduction in other forums is permitted, provided the original author(s) and the copyright owner(s) are credited and that the original publication in this journal is cited, in accordance with accepted academic practice. No use, distribution or reproduction is permitted which does not comply with these terms.
*Correspondence: Md Qamruzzaman, emFtYW5fd3V0MTZAeWFob28uY29t