 T. M. Thamizh Thentral1S. Usha1
 R. Palanisamy1
 A. Geetha1
 Ahmed M. Alkhudaydi2
 Naveen Kumar Sharma3
 Mohit Bajaj4
 Sherif S. M. Ghoneim5
 Mokhtar Shouran6*
 Salah Kamel7
- 1Department of Electrical and Electronics Engineering, SRM Institute of Science and Technology, Kattankulathur, India
- 2Colleges and Institutes Sector of the Royal Commission in Yanbu, Yanbu, Saudi Arabia
- 3Electrical Engineering Department, I. K. G. Punjab Technical University, Jalandhar, India
- 4Department of Electrical Engineering, Graphic Era (Deemed to be University), Dehradun, India
- 5Department of Electrical Engineering, College of Engineering, Taif University, Taif, Saudi Arabia
- 6Wolfson Centre for Magnetics, School of Engineering, Cardiff University, Cardiff, United Kingdom
- 7Electrical Engineering Department, Faculty of Engineering, Aswan University, Aswan, Egypt
In most industrial applications, AC drives are used. These drives require power electronic modules to convert AC to DC and also DC to AC. The power modules used for power conversion consist of power semiconductor switches. There is distortion in the voltage and current obtained from the power modules due to non-linear behaviors of semiconductor switches. To reduce the distortion in the input current, inductors are used along with the line impedance. A high value of inductance is required to maintain the percentage of THD within limits set by the latest standards. Along with the increased size and cost, it also reduces the power factor and output DC voltage at higher loads. The use of a passive power filter (PPF) is the conventional method followed for the reduction of percentage THD and promotion of the power factor. PPFs comprise passive elements such as the resistor, inductor, and capacitor. These passive elements are connected at the point of common coupling (PCC) in shunt to compensate for the harmonics present in the input current. In this study, a modified multi-tuned passive filter is considered to reduce the source current harmonics. A bridge rectifier with resistive load, three-phase induction motor drive, and linear resistive–inductive load is connected at the point of common coupling to analyze the harmonics present in the source current, and also unbalanced created in one phase. To achieve proper selection of the resistance value for the passive filter, the class topper optimization technique is used. To validate the simulation results obtained for the multi-tuned passive filter, the hardware is implemented with a three-phase AC induction motor drive load, in which the speed of the motor is controlled with voltage by a frequency control algorithm using an FPGA controller; The 50% THD is reduced by using the fifth-order filter alone, 75% by combining the fifth- and seventh-order filters, 85% by combining the 5th-, 7th-, 11th-, 13th-, and higher-order filters, and 90% for varying loads. For single-phase AC induction motor load, THD % is reduced to 4%, and for three-phase AC induction motor drive, THD % is reduced to 10% with the same value of the filter.
Introduction
The productivity and profit of the major industries particularly depend upon modern semiconductor technology. Power quality problems are raised particularly due to society’s huge demand for non-linear loads such as uninterrupted power supply (UPS), frequency converters, and switched-mode power supply (SMPS). The power system receives harmonic currents through these non-linear loads, which results in voltage distortion. These harmonics cause critical issues, even reducing the overall efficiency of the system, electronics system failure, transformer losses, and overheating in the motor. It is necessary to maintain harmonics within a range to avoid big troubles, according to national standard limits. Above all, the traditional way to limit harmonics is the implementation of the filter with controllers, which are larger in size. In recent years, many filters have been introduced with small size and low cost with highly efficient operation.
Semiconductor device-based systems are usually designated to provide clean energy. The controllable switches applied in the system increase the efficiency of the system; however, non-linearity causes disturbances due to harmonics and results in reactive power demand. A pure AC supply is essential for the sensitive load-type system. In order to achieve high efficiency and quality power within international standards, clean power has to be maintained (Mohammed, 2019). Harmonics in the power system is a significant issue because of the reduced quality of power in the power system. In recent years, this has been considered a severe concern in the electrical network for both consumers and suppliers. However, due to enlargement in non-linear load used in different appliances like SMPS, variable frequency systems may result in current distortion with a larger frequency than the fundamental frequency.
The harmonics cause adverse effects to other components in power system sectors; some may be immediate effects like interference, control of circuits, and noise in the system, while others may be long-term effects like damage, power loss, heating, transmission line loss, and reduction in transmission network overall efficiency. Therefore, it is a clear fact that harmonics should be reduced in the electrical grid. Load conditioning is the one different approach to mitigate harmonic effects, which results in electrical equipment behaving less sensitive during the electrical disturbance. At the same time, another major approach is adding filters either in series or in shunt connection. Electrical equipment malfunctioning is mainly due to any deviation that occurs in frequency, current, or voltage, which may cause harmful effects. The non-linearity in power switches causes issues in power quality (Gao et al., 2016). In all aspects of society, power electronics devices are integrated into day-to-day life, including residential applications such as personal computers (PCs), UPS, and television and industrial applications such as rectifiers, inverters, CNC tools, and adjustable speed drives (ASDs). PQ problems might be identified by the use of specific symptoms such as where the power electronics components are used and what are the causes due to it. The three major aspects of power electronics (PE) in power distribution are shown in Figure 1.
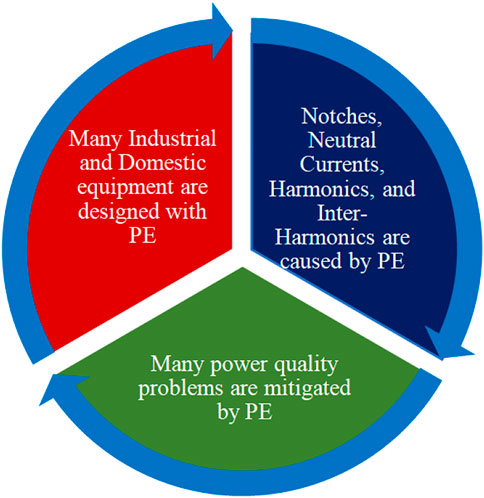
FIGURE 1. Three major aspects of power electronics in power distribution.
Power electronic converter-related equipment like switched-mode power supplies, varying frequency devices, computers, battery chargers, and electronic ballasts create dominant harmonics. In due course, it causes significant monetary losses. Due to this, there has been a great concern among power suppliers and consumers regarding compensation techniques and power quality problems. The inception of harmonics is a buzzword from the late 20th century, which has continuously threatened the power systems’ regular working. The harmonics will distort the voltage and current waveforms, which in turn creates overheating and nuisance tripping of the equipment. These are the reasons for the increasing interest in power quality (PQ) issues. The various PQ problems in industrial- and residential-based loads are discussed in the study by Bajaj and AmitSingh (2020). A series of PQ problems are emerging, where the system has high precision and fast-acting equipment.
Figure 2 shows the different non-linear loads discussed by Sanatkar-Chayjani (2018). These various non-linear loads are the source for producing current harmonics. The harmonics in current may result in voltage and current waveform distortions. The different loading conditions result in the injection of distorted current through PCC to supply. The major power quality problems discussed are the reduction in power factor, voltage swell or sag, and harmonic distortion in current. As IEEE standard 519 describes the tolerance limits for the harmonic contents are mentioned in Fuchs and Masoum (2008). The various PQ issues such as voltage sag/swell, harmonic distortions, flickers, unbalanced voltage, variations in voltage magnitude, voltage distortion, and interruption in voltage are categorized as voltage-related power quality problems (Singh et al., 1999).
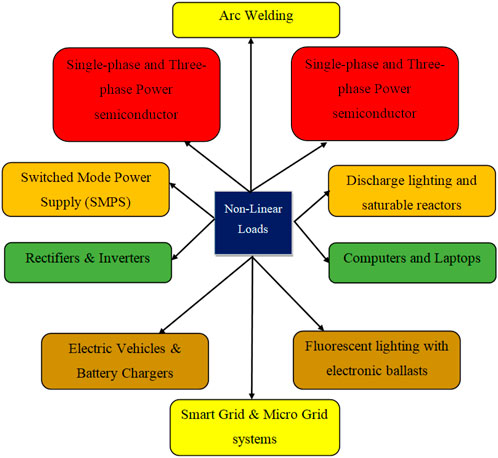
FIGURE 2. Various non-linear loads.
In order to reduce the harmonics, filters are introduced. The commonly used filters are the active filter, passive filter, and hybrid filter. Due to circuit complexity, high-cost active filters are not preferred. At the same time, the low-cost passive power filters come under the combination of R, L, and C (Bajaj and AmitSingh, 2021a). A passive filter blocks low signal frequency and allows large frequency signals. By using R, only the time, a constant value of the capacitor, and inductor can be determined. The number of elements used in the filter decides the order of the filter (Bajaj and AmitSingh, 2021b).
In the power system, finding filter parameters in complex networks is quite complicated since the frequency continuously varies, so load demand will also change drastically. However, the PPF design is necessary and difficult in non-linear systems because the critical aspect of designing PPF is considering THD, initial cost, and power compensation. In recent years, many methods have been introduced to solve this problem. In most cases, trial and error conventional methods are preferred. However, this traditional method needs a complex design equation to determine the filter parameter. Another sequential unconstrained approach has advantages due to its versatile and straightforward nature; however, it has limitations and instability. Alternatively, the fuzzy logic control technique has difficulty in the conversion of the fuzzy value to crisp value and vice versa (Bajaj and AmitSingh, 2022a). Furthermore, the genetic algorithm (Bajaj and AmitSingh, 2021c) has more applications, but it faces convergence problems and drawbacks in computation. The hybrid evolution algorithm can be adapted for the PPF design; in addition, it faces mutation, complexity, and crossover. By comparing all methods, the CTO algorithm makes benefits that can be carried out in the net to every iteration or student performance (Acharya and Das, 2021). Similarly, here, an optimal filter value can be identified by considering this algorithm with available sampling data. This proposed method is used to give optimal passive elements during harmonics.
In the proposed method, single-tuned and multi-tuned passive filters are considered to analyze the non-linear system. The proposed filter values are optimized using the classroom topper algorithm. The global best quality factor to select the suitable inductive resistance value for the filter is optimized by using this proposed algorithm. The proposed passive filter tuned with the classroom topper algorithm is experimented with an induction motor drive load system. The different passive filters implemented for power quality enhancement is discussed in Section 2. Designing and modeling of the passive filter is explained in Section 3. Section 4 explains the proposed optimization method used to tune the filter. The simulation results obtained for various load conditions are discussed in Section 5. Hardware experimental results are discussed in Section 6. Finally, the various results obtained from the simulation and experimental setup are concluded in Section 7.w
PPF for power quality improvement
The shunt PPF is commonly used for suppressing the harmonic content in the power system. The shunt PPF is constructed using RLC elements, tuning of which can control the harmonics. Common types of PPF and their configurations are illustrated in Figure 3. A shunt PPF has been designed to mitigate the harmonics in voltage and current by considering different loads, such as a diode bridge rectifier, compact fluorescent lamp, and other loads connected to the distribution system. It suppresses the harmonic contents present in the current and voltage produced due to series resonance (Gonzalez and McCall, 1987; Li et al., 2006).
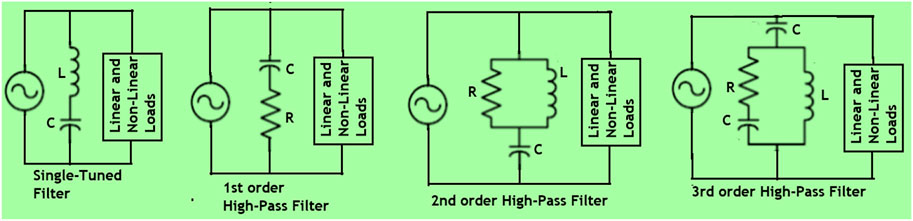
FIGURE 3. Classifications and topologies of PPF.
The system resonance frequencies are found using harmonic penetration analysis in the aluminum smelting plant and high-speed railway system to suppress harmonics and also to decrease the total harmonic distortion (THD) by designing a suitable passive filter (El-Saadany et al., 2000). The design of the PPF for decreasing the harmonics improvises the power factor in 12-pulse AC to DC converters with a load-commutated inverter-fed synchronous motor drive system (Badrzadeh et al., 2011). To select the suitable value for the passive filter, a particle swarm optimization technique is used, and band pass and damped filters are considered (Hu et al., 2015). These filters are described as design and system limitations. With the help of modern harmonic analysis tools and measurements, the authors discussed the system analysis by implementing a suitable filter design. They designed the high-pass tuned passive filters for the reduction of THD. This filter is designed for shunt compensation (Singh and Singh, 2014; Bajaj and AmitSingh, 2022b).
The authors particularly focused on to find a suitable location for placement of the filter and suitable size of the filter among existent capacitor buses in a power distribution system to control the voltage distortion in each network bus (Ahmed Memon et al., 2012). The proposed 3-phase hybrid PPF is considered for reactive power compensation and harmonic reduction under different loaded conditions. To design the HPF, the authors considered the series PPF and thyristor-controlled, reactor-based variable impedance shunt PPF (Chang et al., 2004).
The authors follow the six-step procedure to design the filter to meet the IEEE 519 specified value for THD. Figure 4 illustrates the six-step procedure to design a passive filter discussed by the author (Hamadi et al., 2010). The designed PPF is implemented for a one-phase uncontrolled rectifier. The system is analyzed under steady-state conditions. The system is designed to maintain the low THD in supply current and high power factor by placing the capacitor bank parallel among the bridge rectifier and resonant tank (Ji and Wang, 1998; Cho and Cha, 2011). The various types of filters and their topologies are described and also explained the different harmonic sources, various power quality issues, and solutions to mitigate the issues. The operating principle, control methods, and comparison of all topologies are discussed (Bajaj et al., 2021a).
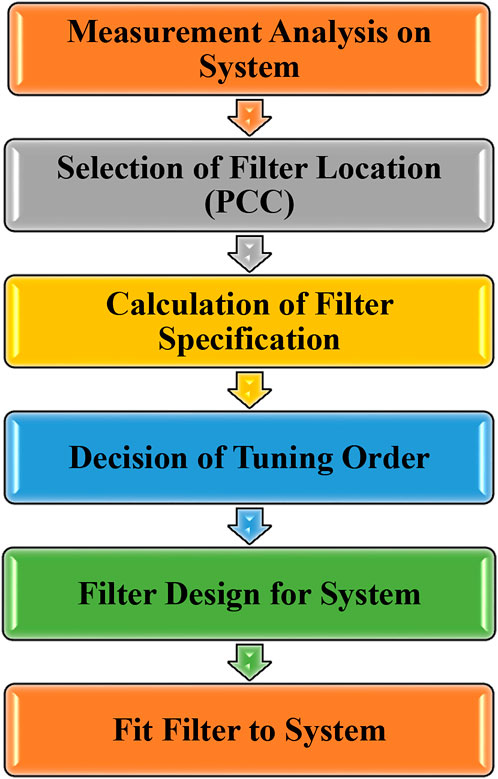
FIGURE 4. Design procedure of PPF.
Design and modeling of a passive power filter
The three elements, R, L, and C, in the passive filter have their own purpose in overcoming system complexity. The passive power filters are classified as single-tuned, double-tuned, and high-pass filters. In different types of filters, single-tuned filters are used to reduce the fifth and seventh harmonics, while high-pass filters are used to filter out higher harmonics like 11th, 13th, 23rd, and 25th order (Crepaldi et al., 2018; Kouchaki and Nymand, 2018).
The following values should be known to design the single-tuned passive filter: tuning frequency (harmonic order h), reactive power (QC), quality factor (QF), supply frequency (f), and supply voltage (V).
The capacitor value of the filter can be obtained as
The reactance of the capacitor or inductor at the tuned frequency is
The inductor value of the filter is calculated from the following equation:
The quality factor can be found as follows:
(The value of QF = 10–100 for low frequencies and QF = 1–5 for high frequencies, but the typical value of QF ranges between 30 and 60)
The resistance value of the filter impedance is obtained from the equation
Optimization technique to tune the resistance value
To optimize the performance parameters of the hybrid active power filter, an improved teaching–learning-based optimization algorithm is used (Zhiling et al., 2020). In the distributed energy-integrated grid system, non-conventional higher-order passive power filters are optimized using the particle swarm optimization algorithm (Azab, 2020). Due to the load side non-linearity in the system, the source currents are polluted. To minimize the harmonics, the optimal value of passive filter parameters is obtained with the implementation of the multi-objective Pareto-based firefly algorithm (Bajaj et al., 2021b). A new class topper optimization (CTO) algorithm is proposed based on the students’ learning ability in the classroom to obtain the best solution. With that, the best global results can be obtained(Das et al., 2020). This method is illustrated based on student observation in their every examination. By analyzing, the algorithm topper will be selected, and other students will follow a particular topper for their improvement in the examination. The same thing is expected in the filtration process also. According to that process, one best performer is identified through examination as a class topper (Das et al., 2018). For every examination, students’ learning behavior will be changed, which can be used through the CTO algorithm, which gives optimum solutions for even non-linear complex problems. Many iterations are generated in this technique, and in that, the first algorithm is used to find filter parameters (Badugu et al., 2021). The different steps involved in the optimization algorithm are shown in Figure 5.
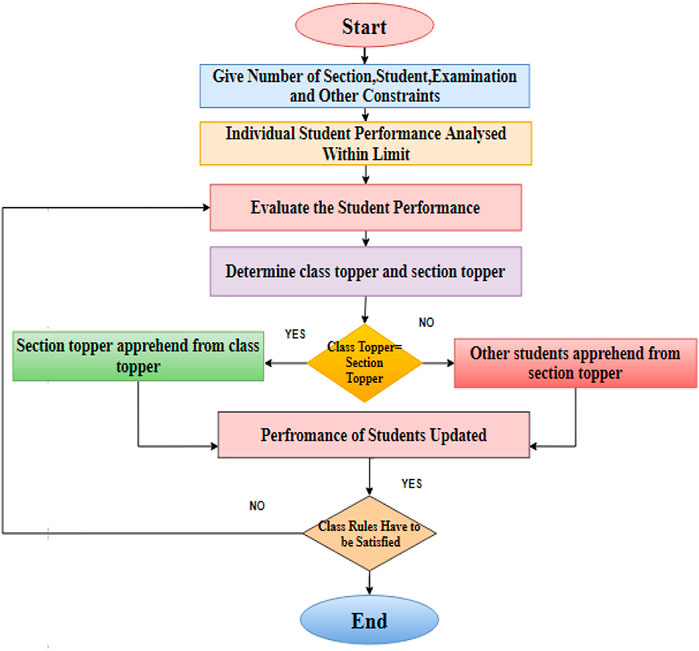
FIGURE 5. Optimization technique flowchart.
Let us assume the number of students: N;
number of subjects: E;
examination conducted: Z;
performance: PE.
Applying CTO, the student’s performance is given as follows:
1) The performance of section topper learning from the class topper.
where
2) The performance of students who learned from the section topper.
where
CTO technique steps are as follows:
Step 1: Start the optimization by providing data-like sections, total students (Nmax), and total examination (Emax).Step 2: Start the main examination.Step 3: The class topper is selected based on the student’s performance from the examination result. Each class section topper is also selected among the best performance.Step 4: From Eqs 6, 7, section topper performance is calculated similarly from Eqs 8, 9 learners in section performance determined by other students.Step 5: The class topper denotes the best students globally; similarly, the section topper denotes the best student locally in school; to identify this, we repeat steps 3 and 4.Step 6: However, the best global students are identified by the CTO algorithm, and in the same way, best resistance will be tuned.Simulation result and discussion
The PPF parameters, such as resistor and quality factor, are optimized to get a better THD reduction. The class topper algorithm is used for tuning, and it is compared with the different conventional algorithms. The conventional method and proposed method tuned values of resistance and quality factors are given in Tables 1–Tables 5. With the proposed algorithm, the optimized value of total harmonic distortion for the individual harmonic order is obtained. The quality factor, cost, and resistor values for the fifth and seventh harmonic frequency global value of % THD are given in Table 1. It shows that in the proposed method, the fifth-order harmonic percentage can be reduced up to 0.1883% and seventh-order harmonics can be reduced up to 0.0682%.
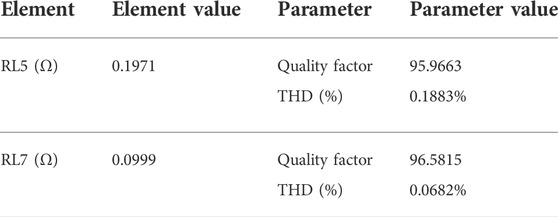
TABLE 1. Performance analysis of the proposed algorithm.
Tables 2, 3 show the parameter values for the priority algorithm. The better parameter values obtained using the algorithm are tabulated in Table 4. Table 5 gives % THD for the combination of fifth- and seventh-order tuned resistance values. The aforementioned results are for the individual harmonic order. Table 4 shows the THD percentage for the combination of fifth- and seventh-order resistor values.

TABLE 2. Before applying the priority method.

TABLE 3. After applying the priority method.

TABLE 4. Fifth- and seventh-order filter resistor values for different combinations.
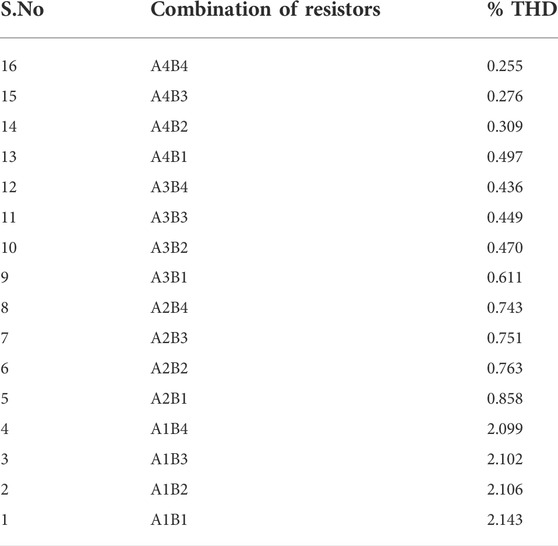
TABLE 5. Dynamic method of optimization.
A PPF is designed and connected to the system, as shown in Figure 6, to mitigate the PQ issues caused by the three-phase three-wire uncontrolled full-bridge converter provided with RL load. The 315 V is given as an input to the system for the load of 60 Ω and 30 mH.
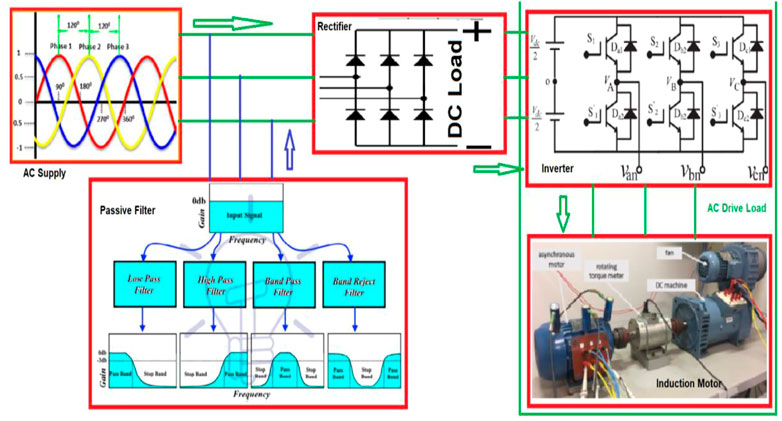
FIGURE 6. Block diagram of a non-linear system with a passive filter.
The system is simulated without considering the passive filter first. Figure 7 shows the source voltage applied to the system. It is noted that without considering the passive filter, the shape of the source current is non-sinusoidal, as shown in Figure 7B. As shown in Figures 7H,I, the power factor is decreased, and the reactive power is increased to meet the load demand. The load side current and voltage are also shown in Figure 6D and Figure 7C, in addition to the rectified output voltage and output current shown in Figures 7E,F.
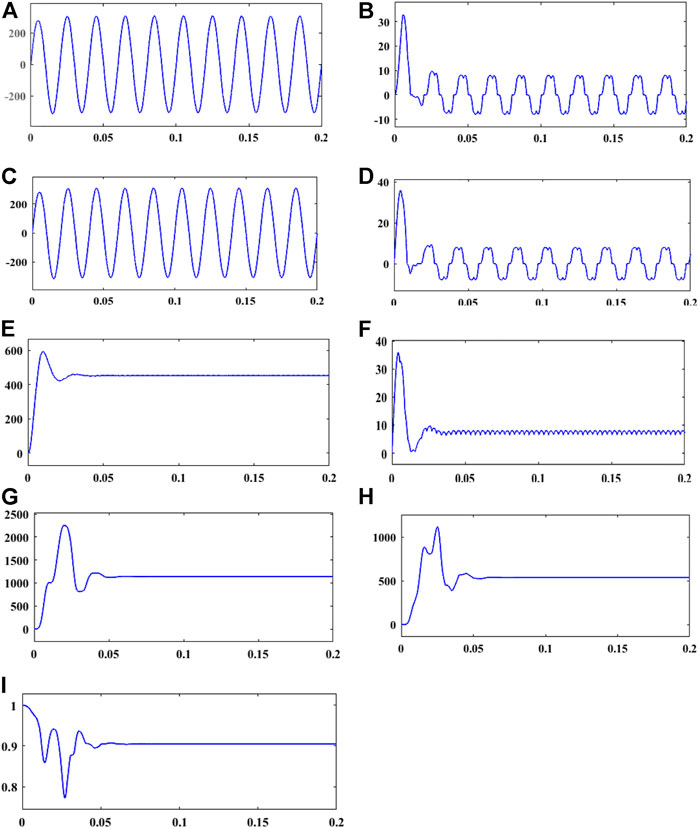
FIGURE 7. Voltage, current, and power waveform without passive filters. (A) Input voltage. (B) Input current. (C) Voltage at PCC. (D) Load current. (E) Voltage after rectifier. (F) Current after rectifier. (G) Real power. (H) Reactive power. (I) Power factor.
The PPF is designed for the elimination of various harmonic orders. The PPF is designed for a particular frequency as a single-tuned filter and also as a multiple-tuned filter for different frequencies. The PPF is first implemented for the fifth-order harmonic frequency to reduce the harmonic content present in the source side current. The shape of the source side current waveform is improved, and % THD for the fifth-order harmonic is reduced. Furthermore, almost unity PF is achieved. Figures 8A–I show the waveform of voltage, current, power, and power factor for the fifth harmonic order passive filter.
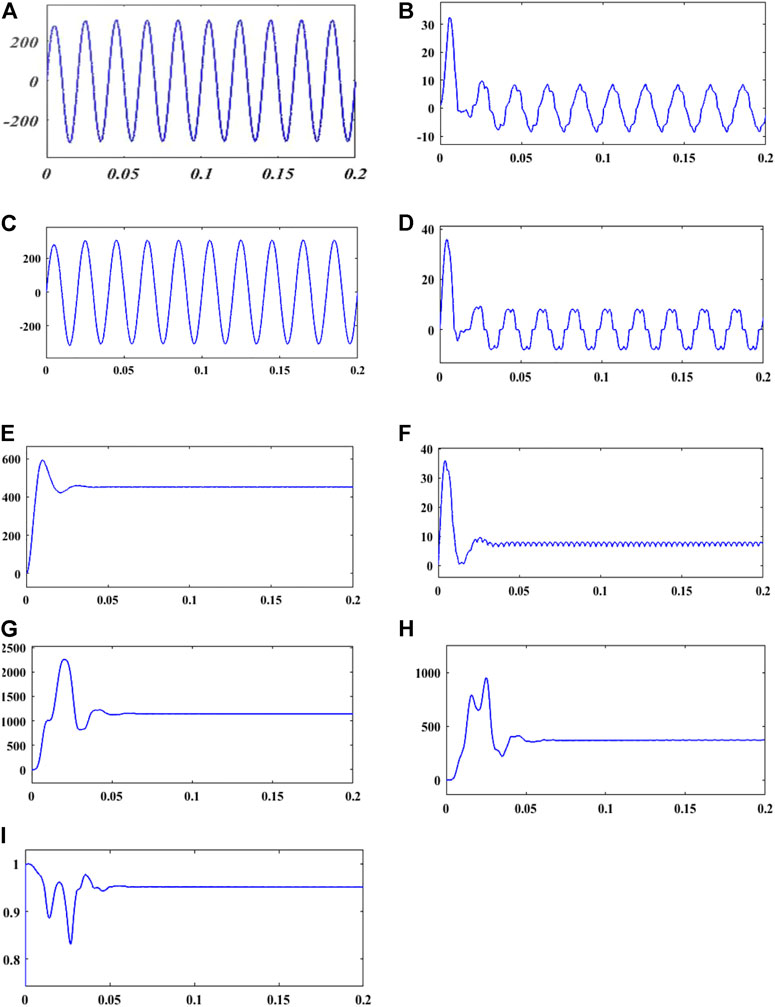
FIGURE 8. Voltage, current, and power waveform for with a fifth-order harmonic filter. (A) Input voltage. (B) Input current. (C) Voltage at PCC. (D) Load current. (E) Voltage after rectifier. (F) Current after rectifier. (G) Real power. (H) Reactive power. (I) Power factor.
Then, the PPF is implemented for the seventh-order harmonic frequency to reduce the harmonic content present in the source side current. The shape of the source side current waveform is poorer than that to the fifth-order filter results, and also % THD for the seventh-order harmonic is not reduced to the recommended level. Furthermore, improvement in PF is achieved. Figures 9A–I show the waveform of voltage, current, power, and power factor for the fifth harmonic order passive filter.
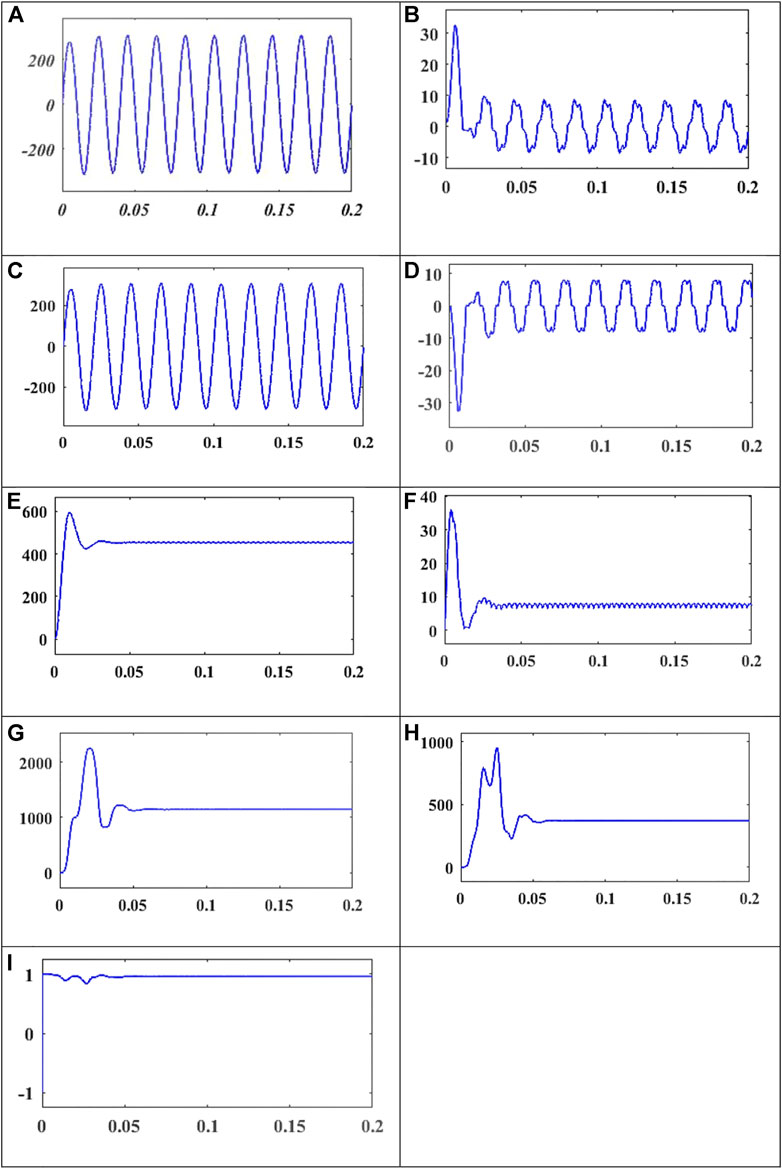
FIGURE 9. Voltage, current, and power waveform for with a seventh-order harmonic filter. (A) Input voltage. (B) Input current. (C) Voltage at PCC. (D) Load current. (E) Voltage after rectifier. (F) Current after rectifier. (G) Real power. (H) Reactive power. (I) Power factor.
When the seventh-order harmonic filter is implemented, % THD for the seventh-order system alone is reduced. The filter is then designed with fifth- and seventh-order frequencies. The source current waveform is further improved, and the reactive power is also compensated. Then, the filter is designed for multiple harmonic orders to reduce the % THD and shapes the source current as a pure sinusoidal.
The PPF is now implemented for the fifth- and seventh-order harmonic frequency to reduce the harmonic content present in the source side current. The shape of the source side current waveform is better than that of the fifth-order filter results, and also % THD for the fifth- and seventh-order harmonic is reduced. Furthermore, nearly unity PF is achieved. Figures 10A–I give the waveform of voltage, current, power, and power factor for the fifth harmonic order passive filter.
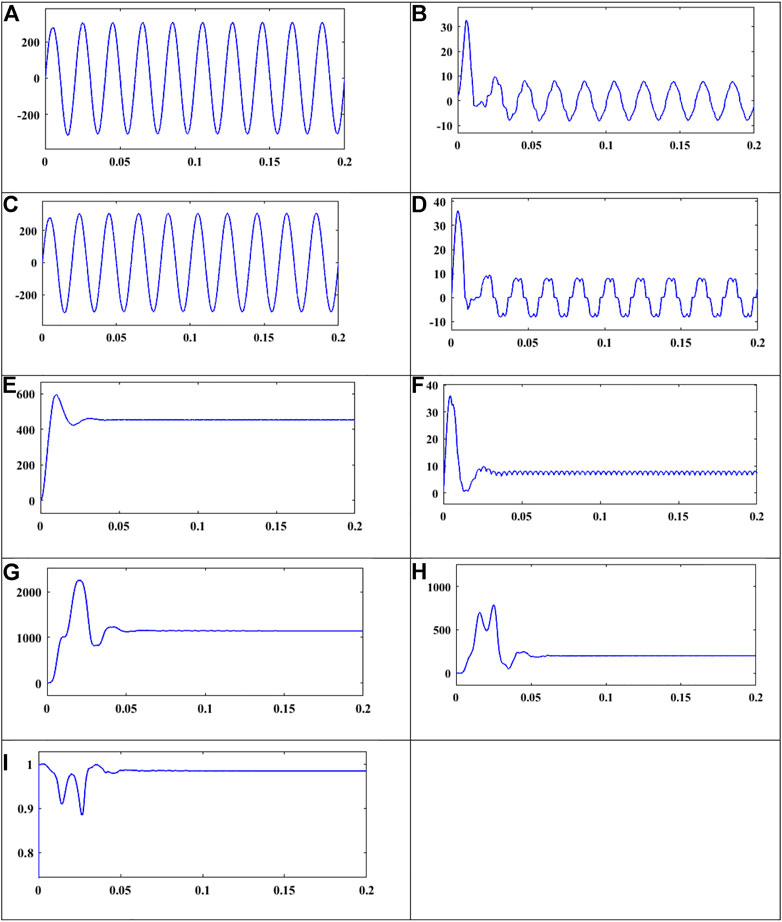
FIGURE 10. Voltage, current, and power waveform for with fifth- and seventh-order harmonic filters. (A) Input voltage. (B) Input current. (C) Voltage at PCC. (D) Load current. (E) Voltage after rectifier. (F) Current after rectifier. (G) Real power. (H) Reactive power. (I) Power factor.
The PPF is now implemented for the 5th-, 7th-, 11th-, 13th-, and higher-order harmonic frequencies to decrease the harmonic content present in the source side current. The shape of the source side current waveform is nearer to sinusoidal, and also % THD for the 5th-, 7th-, 11th-, 13th-, and higher-order harmonic is decreased. Furthermore, nearly unity PF is achieved. Figures 11A–I show the waveform of voltage, current, power, and power factor for the fifth harmonic order passive filter.
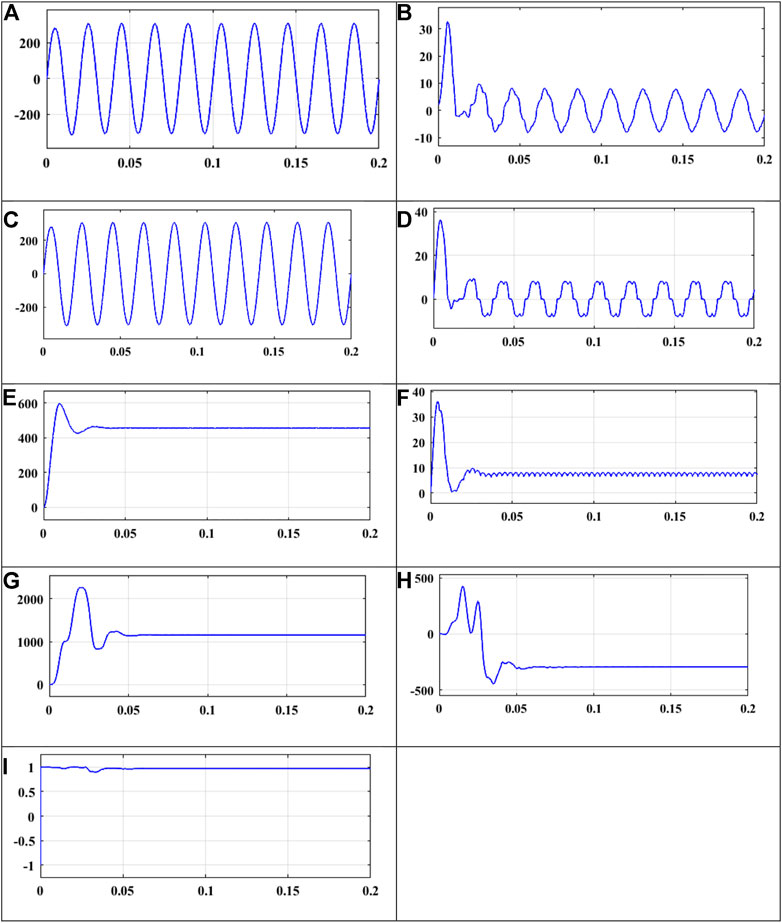
FIGURE 11. Voltage, current, and power waveform for a multiple-order harmonic filter. (A) Input voltage. (B) Input current. (C) Voltage at PCC. (D) Load current. (E) Voltage after rectifier. (F) Current after rectifier. (G) Real power. (H) Reactive power. (I) Power factor.
Figure 12 shows the % THD as 17.58% without the filter. However, the recommended value of IEEE 519 1992 standards is that the % THD should be below 5%. When the fifth-order filter alone is implemented, the % THD is reduced to 9.68%. When the seventh-order filter alone is implemented, the % THD is reduced to 17.72%. When the fifth and seventh-order filters are implemented, the % THD is reduced to 6.94%. When the 5th-, 7th-, 11th-, 13th-, and higher-order filters are implemented, the % THD is reduced to 5.84%.
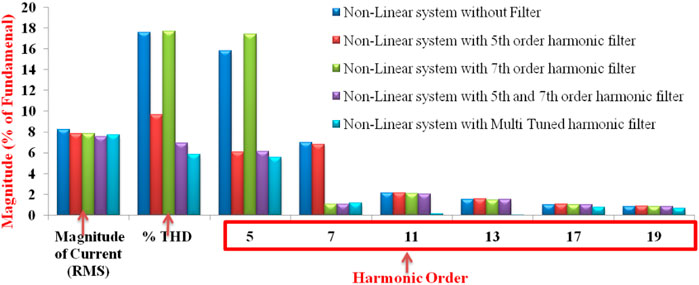
FIGURE 12. % THD for different passive filters and FFT results.
The following observations are obtained from Table 6. Only with the fifth-order filter, the fifth-order % THD is reduced from 15.83% to 6.1%, but the overall % THD is 9.68%. Only with the seventh-order filter, % THD is reduced from 6.98% to 1.05%, but the overall % THD is 17.72%.
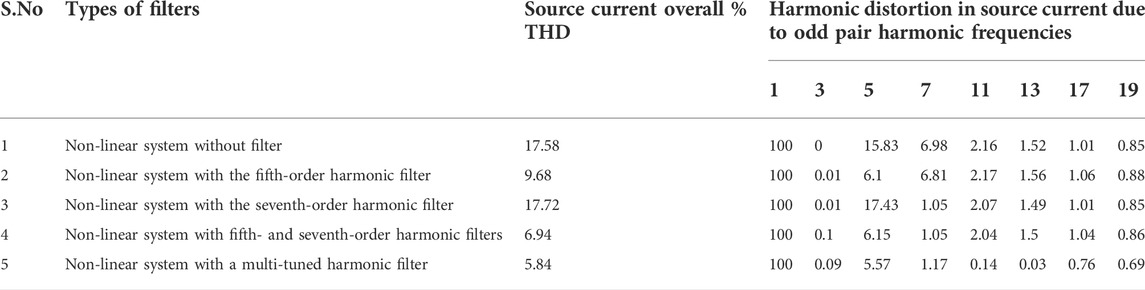
TABLE 6. % THD for various types of passive filters.
By combining fifth- and seventh-order filters, the overall % of THD is reduced to 6.94%. By combining 5th-, 7th-, 11th-, 13th-, and higher-order filters, the overall % THD is reduced to 5.84%. From the values tabulated in Table 7, it is clear that the % THD of the system changes when the load varies above and below the designed value of 60Ω.
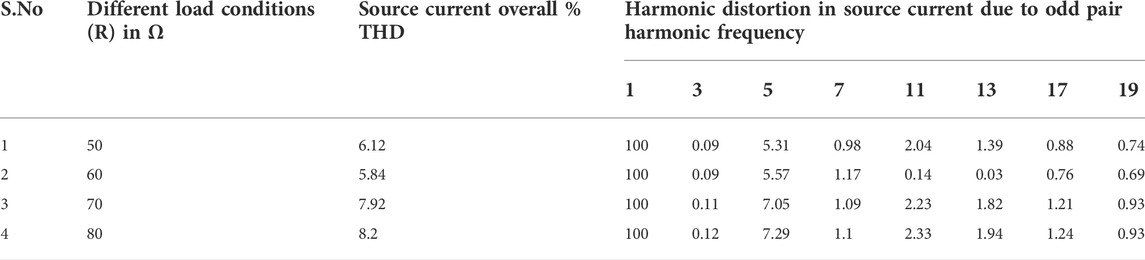
TABLE 7. % THD for varying load conditions.
Figure 13 is the source current waveform for the variable load system. Initially, the three-phase induction motor is considered up to 0.2 s. Then at 0.2 s, a three-phase diode bridge rectifier load is added to the system. Then at 0.6 s, an RL linear load is added. In all the cases, the multi-tuned passive filter is connected. With the filter, the source current is changed into sinusoidal in shape. In the first case, the current obtained its harmonic free output at 0.08 s. When the rectifier load is connected at 0.2 s, it settles its steady-state value at 0.28 s. Then for the linear load case after 0.6 s, it reaches its steady value and remains constant at 0.62 s.
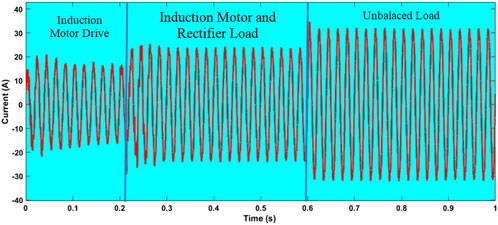
FIGURE 13. Source current for varying load.
The source voltage of the system in all types of load is shown in Figure 14. The figure shows that it maintains a constant value in all the loads. Figure 15 shows the output waveforms for the induction motor drive. The rotor current, speed in radiance per second, and electromagnetic torque are shown for reference. The % THD of source current is given in Figure 16.
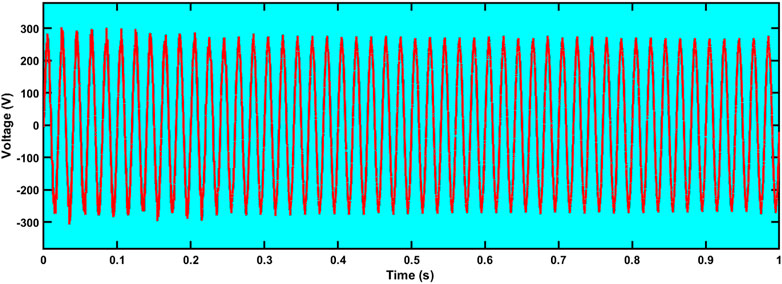
FIGURE 14. Source voltage for varying load.
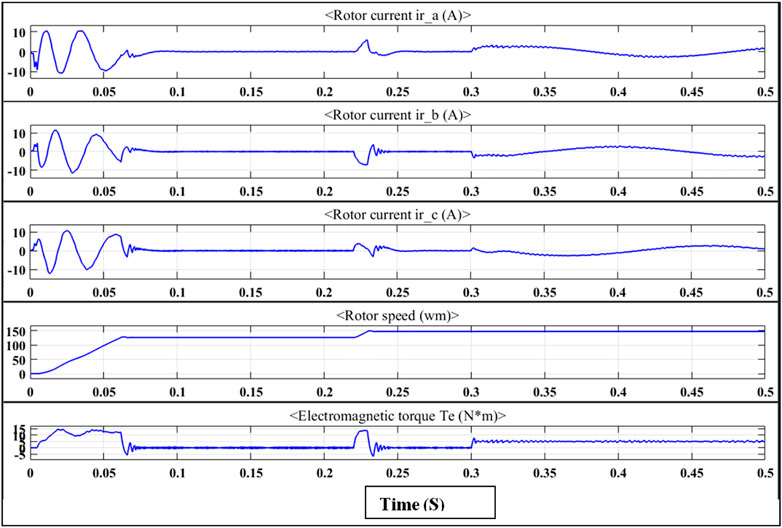
FIGURE 15. Current, speed, and torque of induction motor drive.
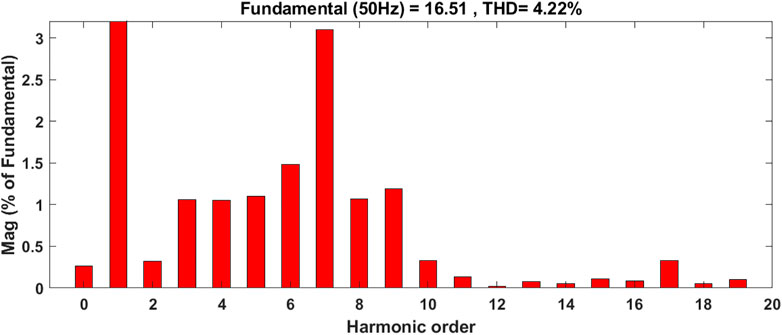
FIGURE 16. % THD of source current for varying load.
Hardware results and discussion
The hardware setup is established for single- and three-phase systems to monitor the various power quality issues. A single- and three-phase induction motor is considered. The hardware model given in Figure 17 is a three-phase induction motor drive system with a single-tuned PPF.
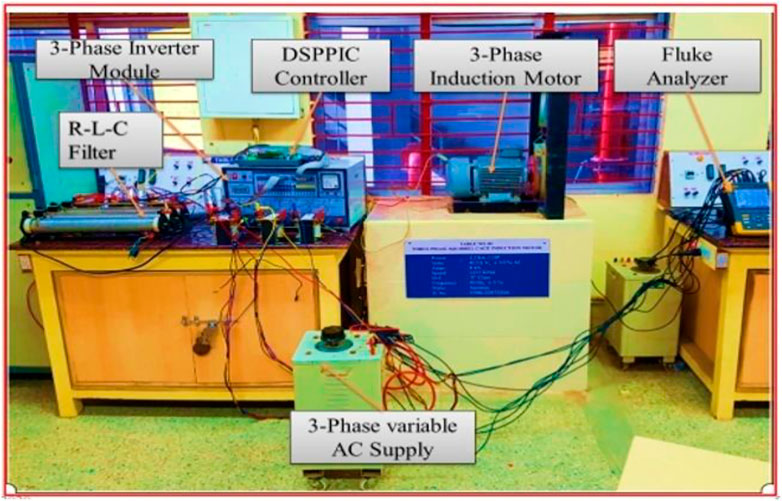
FIGURE 17. Experimental setup of a passive filter.
The rating of the motors and the parameter value for a single-tuned filter are given in Table 8. Both the systems have experimented with 120 V AC, and the RMS value of voltage and current has been recorded using a fluke analyzer, and the same are tabulated in Table 9. Active power, power factor, and the % THD for voltage and current at the supply side are shown in Table 9.

TABLE 8. Rating of different loads and parameter values of the filter.
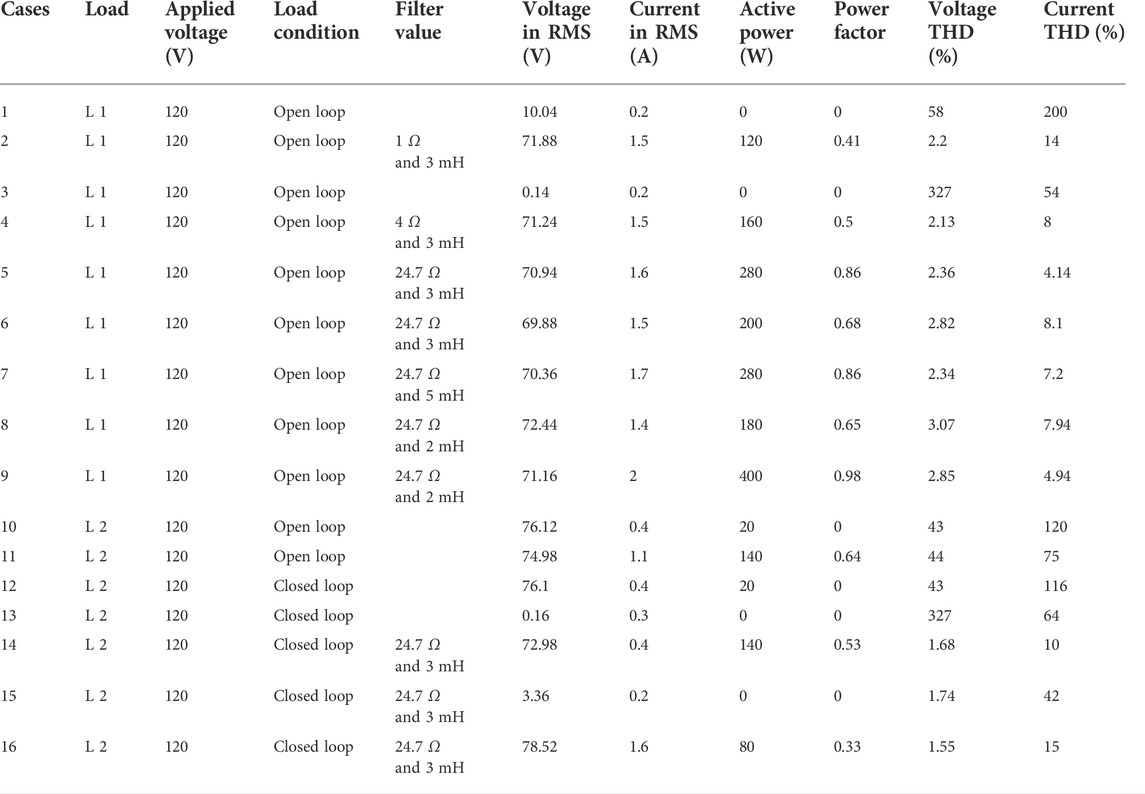
TABLE 9. Voltage and current % THD for different loads.
In a hardware implementation, two different loads are considered to mitigate the source’s current harmonics. It is noticed that when a load is changing, the filter gives two different % THD. As shown in Table 9, for single-phase induction motor load, % THD is reduced to 4.14%. For three-phase AC induction motor drive, % THD is reduced to 10% with the same value of the filter. The harmonics present in the source current and voltage for case 5 and case 14 are shown in Figures 18, 19 from the hardware setup. For other cases, harmonics in source voltage are also recorded, and the same is mentioned in Figure 20 graphically.
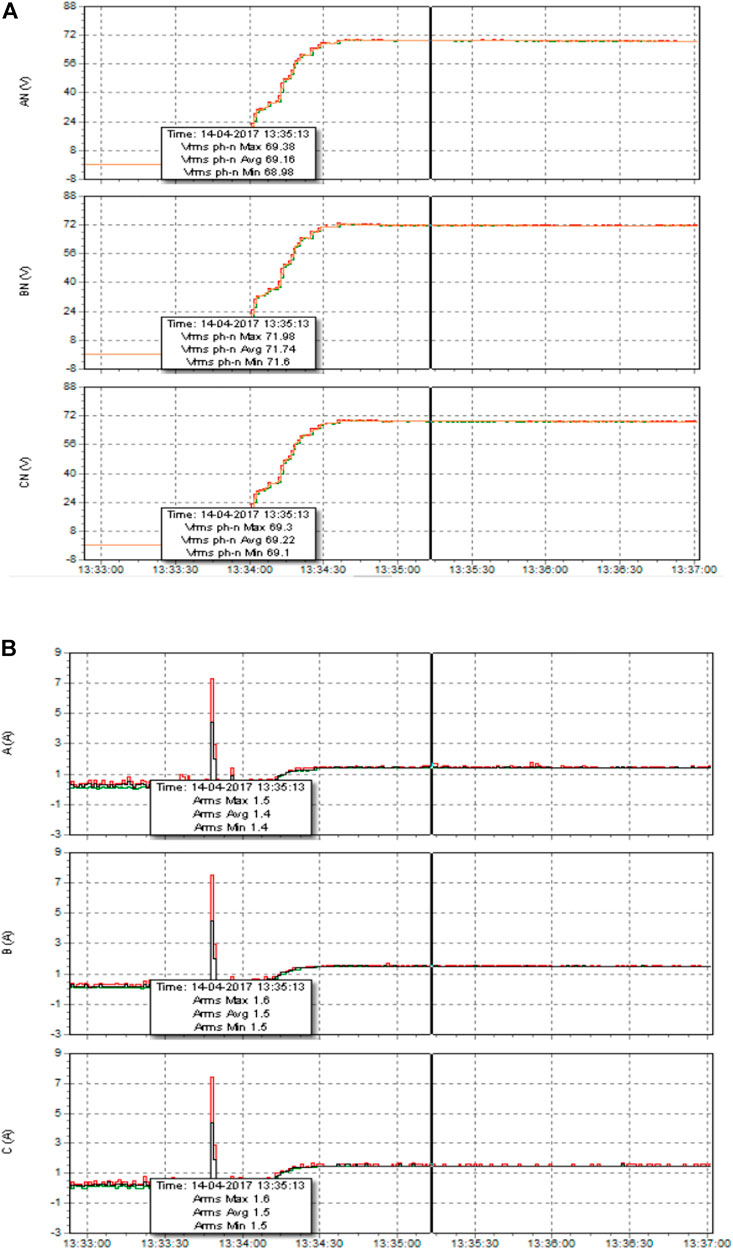
FIGURE 18. 1HP, load 1 kg condition 120V with filter 24.7 Ω, 3 mH (A) voltage and (B) current.
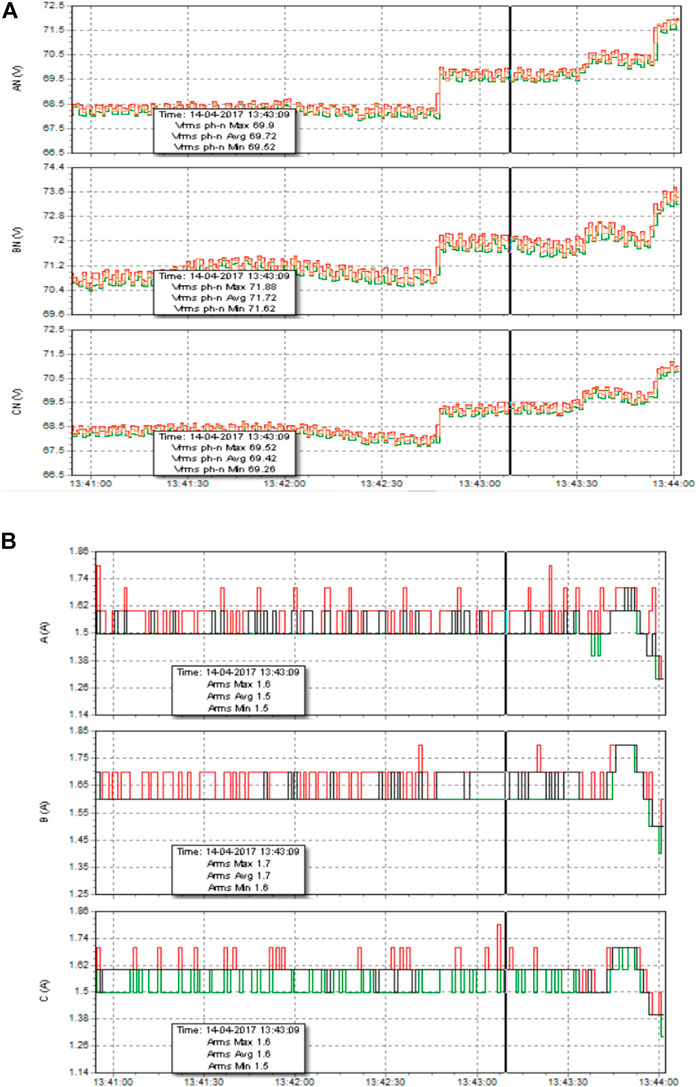
FIGURE 19. 3HP, closed-loop unloaded condition 120 V with filter kp = 0.1, ki = 0.01 24.7 Ω, 3 mH. (A) Voltage. (B) Current.
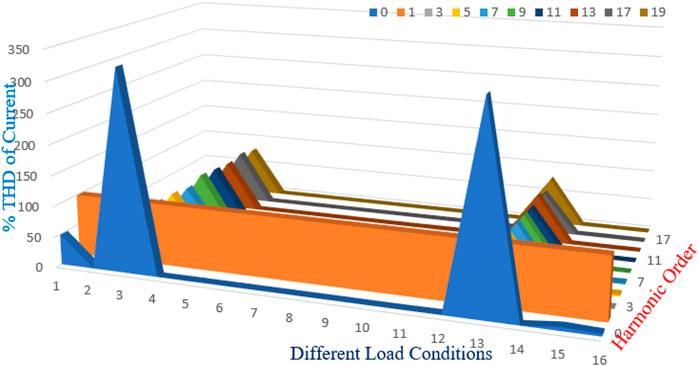
FIGURE 20. % THD of source current for different loads.
Conclusion
In order to reduce distortion in voltage and current from power modules, the non-linear behavior of the semiconductor switches is analyzed. To limit THD within range and also to minimize distortion in the inductor and input supply proper quality factor, we choose to obtain the resistance range. The excellent operation of PPF results in %THD reduced with improved power factor. The multi-tuned passive filter has reduced the source current harmonics as in simulation. The proper selection of filters is identified through the class topper optimization technique. The CTO technique filter satisfies the harmonics range within permissible limits, and its approach for the passive filter is effective. The result is validated for hardware and multi-tuned passive filter with induction motor drive, which is achieved with an FPGA controller successfully. The simulation results show that THD is reduced from 17.28% to 9.68% only using the fifth-order filter, 17.72% only using the seventh-order filter, 6.94% by combining the fifth- and seventh-order filters, 5.84% by combining 5th-, 7th-, 11th-, 13th-, and higher-order filters, and 4.22% for varying loads. In hardware, two different loads are considered to mitigate the source current harmonics; it is noticed that when the load is changing, the filter gives two different % THDs. For single-phase AC induction motor load, % THD is reduced to 4%, and for three-phase AC induction motor drive, % THD is reduced to 10% with the same value of the filter.
From the simulation results, % THD is reduced from 17.28% to
✓ 9.68% only using the fifth-order filter
✓ 17.72% only using the seventh-order filter
✓ 6.94% by combining the fifth- and seventh-order filters
✓ 5.84% by combining the 5th-, 7th-, 11th-, 13th-, and higher-order filters
✓ 4.22% for varying loads.
In hardware, two different loads are considered to mitigate the source current harmonics; it is noticed that when the load changes, the filter gives two different % THDs.
✓ For single-phase AC induction motor load, THD % is reduced to 4%
✓ For three-phase AC induction motor drive, THD % is reduced to 10% with the same value of filter
Data availability statement
The original contributions presented in the study are included in the article/Supplementary Material; further inquiries can be directed to the corresponding author.
Author contributions
All authors listed have made a substantial, direct, and intellectual contribution to the work and approved it for publication.
Conflict of interest
The authors declare that the research was conducted in the absence of any commercial or financial relationships that could be construed as a potential conflict of interest.
Publisher’s note
All claims expressed in this article are solely those of the authors and do not necessarily represent those of their affiliated organizations, or those of the publisher, the editors, and the reviewers. Any product that may be evaluated in this article, or claim that may be made by its manufacturer, is not guaranteed or endorsed by the publisher.
References
Acharya, D., and Das, D. K. (2021). Swarm optimization approach to design pid controller for artificially ventilated human respiratory system. Comput. Methods Programs Biomed. 198, 105776. doi:10.1016/j.cmpb.2020.105776
Ahmed Memon, Z, Uquaili, M A, and Ali Unar, Mukhtiar (2012). Harmonics mitigation of industrial power system using passive filters. Mehran Univ. Res. J. Eng. Technol. 31 (2), 355–360.
Azab, M (2020). Multi-objective design approach of passive filters for single-phase distributed energy grid integration systems using particle swarm optimization. Energy Rep. 6, 157–172. doi:10.1016/j.egyr.2019.12.015
Badrzadeh, B, Smith, K S., and Wilson, R C. (2011). Designing passive harmonic filters for an aluminum smelting plant. IEEE Trans. Ind. Appl. 47 (2), 973–983. doi:10.1109/tia.2010.2103544
Badugu, R, Acharya, D, and Kumar Das, DM. (2021). Prakash “class topper optimization algorithm based optimum passive power filter design for power system” IEEE ICCMC.
Bajaj, M., Aymen, F., Alowaidi, M., Sharma, N. K., Mishra, S., and Sharma, S. K. (2021). A lyapunov-function based controller for 3-phase shunt active power filter and performance assessment considering different system scenarios. IEEE Access 9, 66079–66102. doi:10.1109/ACCESS.2021.3075274
Bajaj, M, and AmitSingh, K (2021). Design and analysis of optimal passive filters for increasing the harmonic-constrained hosting capacity of inverter-based DG systems in non-sinusoidal grids. Electr. Eng. 104, 1883–1907. doi:10.1007/s00202-021-01415-1
Bajaj, M, and AmitSingh, K (2020). Grid integrated renewable dg systems: A review of power quality challenges and state‐of‐the‐art mitigation techniques. Int. J. Energy Res. 44, 26–69. doi:10.1002/er.4847
Bajaj, M, and AmitSingh, K (2021). Hosting capacity enhancement of renewable-based distributed generation in harmonically polluted distribution systems using passive harmonic filtering. Sustain. Energy Technol. Assessments 44 (101030). ISSN 2213-1388. doi:10.1016/j.seta.2021.101030
Bajaj, M, and AmitSingh, K (2022). Increasing renewable energy penetration in harmonically polluted distribution grids using passive filtering: A comparative assessment of common filter types. Electr. Eng. doi:10.1007/s00202-022-01521-8
Bajaj, M, and AmitSingh, Kr (2022). Optimal design of passive power filter for enhancing the harmonic-constrained hosting capacity of renewable DG systems. Comput. Electr. Eng. 97 (2022). doi:10.1016/j.compeleceng.2021.1076460045-7906
Bajaj, M, and AmitSingh, K (2021). Performance assessment of hybrid active filtering technique to enhance the hosting capacity of distorted grids for renewable energy systems. Int. J. Energy Res. 1-27, 2783–2809. doi:10.1002/er.7345
Bajaj, M., Sharma, N. K., Pushkarna, M., Malik, H., Alotaibi, M. A., and Almutairi, A. (2021). Optimal design of passive power filter using multi-objective pareto-based firefly algorithm and analysis under background and load-side’s nonlinearity. IEEE Access 9, 22724–22744. doi:10.1109/ACCESS.2021.3055774
Chang, G W., Wang, H-L, and Chu, S-Y (2004). Strategic placement and sizing of passive filters in a power system for controlling voltage distortion. IEEE Trans. Power Deliv. 19 (3), 1204–1211. doi:10.1109/tpwrd.2003.822954
Cho, Y-S, and Cha, H (2011). A single-tuned passive harmonic filter design using transfer function approach for industrial process application. Int. J. Mechatronics Automation 1 (2), 90–96. doi:10.1504/ijma.2011.040039
Crepaldi, J., Amoroso, M. M., and Ando Junior, O. H. (2018). Analysis of the topologies of power filters applied in distributed generation units - review. IEEE Lat. Am. Trans. 16 (7), 1892–1897. doi:10.1109/tla.2018.8447354
Das, P., Das, D. K., and Dey, S. (2018). A new class topper optimization algorithm with an application to data clustering. IEEE Trans. Emerg. Top. Comput. 8 (4), 1–959. doi:10.1109/tetc.2018.2812927
Das, P, Das, D K, and Dey, S (2020). A new class topper optimization algorithm with an application to data clustering. IEEE Trans. Emerg. Top. Comput. 8 (4), 948–959.
El-Saadany, E. F., A Salama, M. M., and Chikhani, A. Y. (2000). Passive filter design for harmonic and reactive power compensation in single phase circuits supplying non-linear loads. IEEE Proc. - Generation, Transm. Distribution 147 (6), 373–380.), PP.
Fuchs, E F., and Masoum, M. A. S. (2008). Power quality in power systems and electrical machines. Elsevier, 1359–35375.
Gao, Z,, Zhang, K, Zhou, X, and Ma, Youjie (2016). The discussion on power quality technology. Proceedings of IEEE International Conference on Mechatronics and Automation August 7 - 10. China: Harbin.
Gonzalez, D. A., and McCall, J. C. (1987). Design of filters to reduce harmonic distortion in industrial power systems. IEEE Trans. Ind. Appl. 23, 504–511. doi:10.1109/tia.1987.4504938
Hamadi, A, Rahmani, S, and Al-Haddad, K (2010). A hybrid passive filter conguration for VAR control and harmonic compensation. IEEE Trans. Industrial Electron. 57 (7), 2802–2810.
Hu, H, He, Z, and Gao, S (2015). Passive filter design for China high-speed railway with considering harmonic resonance and characteristic harmonics. IEEE Trans. Power Deliv. 30 (1), 505–514. doi:10.1109/tpwrd.2014.2359010
Ji, Y, and Wang, F (1998). Single phase diode rectifier with novel passive filter. IEE Proc. Circuits Devices Syst.IEE Proc. - Circuits, Devices Syst. 145 (4), 254–259. doi:10.1049/ip-cds:19982034
Kouchaki, A, and Nymand, M. (2018). Morten Nymand “analytical design of passive LCL filter forThree-phase two-level power. IEEE Trans. Power Electron. 33 (4), 3012–3022. doi:10.1109/tpel.2017.2705288
Li, Y, Mao, C, Zhang, B, and Zeng, J (2006). Voltage sag study for a practical industrial distribution network,” international conference on power system technology. Chongqing, China, 1–4.
Mohammed, S. (2019). Almutairi, SillasHadjiloucas “Harmonics Mitigation Based on the Minimization of Non-Linearity Current in a Power System” MDPI article, 3, 29.
Sanatkar-Chayjani, M (2018). High-order filter design for high-power voltage-source converters. IEEE Trans. Ind. Electron. 65, 49–58. doi:10.1109/tie.2017.2714136
Singh, B, Chandra, A, and Al-Haddad, K (1999). A review of active filters for power quality improvement. IEEE Trans. Ind. Electron. 46 (5), 960–971. doi:10.1109/41.793345
Singh, S, and Singh, B (2014). Optimized passive filter design using modified particle swarm optimization algorithm for a 12-pulse converter-fed LCI–Synchronous motor drive. IEEE Trans. Ind. Appl. 50 (4), 2681–2689. doi:10.1109/tia.2013.2292991
Keywords: total harmonics distortion, passive power filter, power factor, point of common coupling, class topper optimization (CTO)
Citation: Thentral TMT, Usha S, Palanisamy R, Geetha A, Alkhudaydi AM, Sharma NK, Bajaj M, Ghoneim SSM, Shouran M and Kamel S (2022) An energy efficient modified passive power filter for power quality enhancement in electric drives. Front. Energy Res. 10:989857. doi: 10.3389/fenrg.2022.989857
Received: 08 July 2022; Accepted: 06 October 2022;
Published: 21 October 2022.
Edited by:
Flavia Grassi, Politecnico di Milano, ItalyReviewed by:
Xiaokang Liu, Politecnico di Milano, ItalyMohamed Salem, Universiti Sains Malaysia (USM), Malaysia
Copyright © 2022 Thentral, Usha, Palanisamy, Geetha, Alkhudaydi, Sharma, Bajaj, Ghoneim, Shouran and Kamel. This is an open-access article distributed under the terms of the Creative Commons Attribution License (CC BY). The use, distribution or reproduction in other forums is permitted, provided the original author(s) and the copyright owner(s) are credited and that the original publication in this journal is cited, in accordance with accepted academic practice. No use, distribution or reproduction is permitted which does not comply with these terms.
*Correspondence: Mokhtar Shouran, c2hvdXJhbm1hQGNhcmRpZmYuYWMudWs=