 Anna H. Schleifer
 Dylan Harrison-Atlas
 Wesley J. Cole
 Caitlin A. Murphy
- National Renewable Energy Laboratory, Golden, CO, United States
As shares of variable renewable energy (VRE) on the electric grid increase, sources of grid flexibility will become increasingly important for maintaining the reliability and affordability of electricity supply. Lithium-ion battery energy storage has been identified as an important and cost-effective source of flexibility, both by itself and when coupled with VRE technologies like solar photovoltaics (PV) and wind. In this study, we explored the current and future value of utility-scale hybrid energy systems comprising PV, wind, and lithium-ion battery technologies (PV-wind-battery systems). Using a price-taker model with simulated hourly energy and capacity prices, we simulated the revenue-maximizing dispatch of a range of PV-wind-battery configurations across Texas, from the present through 2050. Holding PV capacity and point-of-interconnection capacity constant, we modeled configurations with varying wind-to-PV capacity ratios and battery-to-PV capacity ratios. We found that coupling PV, wind, and battery technologies allows for more effective utilization of interconnection capacity by increasing capacity factors to 60%–80%+ and capacity credits to close to 100%, depending on battery capacity. We also compared the energy and capacity values of PV-wind and PV-wind-battery systems to the corresponding stability coefficient metric, which describes the location-and configuration-specific complementarity of PV and wind resources. Our results show that the stability coefficient effectively predicts the configuration-location combinations in which a smaller battery component can provide comparable economic performance in a PV-wind-battery system (compared to a PV-battery system). These PV-wind-battery hybrids can help integrate more VRE by providing smoother, more predictable generation and greater flexibility.
Highlights
• Coupling PV, wind, and battery technologies allows for more effective utilization of interconnection capacity
• PV-wind-battery hybrids achieve capacity factors of 60%–80%+ and capacity credits close to 100%
• Smaller batteries can provide comparable economic performance as larger batteries when coupled with complementary PV-wind systems
• Stability coefficient is a reliable indicator of capacity factor but is not as reliable for capacity credit
Introduction
The first half of 2022 saw a record level of new investment in renewable energy globally, with over half of the investment going toward wind and solar energy (Sehgal, 2022). In the United States, investments in wind, solar, and other clean-energy-enabling technologies like energy storage and transmission are expected to increase in the next decade (Gagnon et al., 2022; U.S. Energy Information Administration, 2022), especially with the extension and modification of federal tax incentives (Inflation Reduction, 2022; The Inflation Reduction Act Drives, 2022). More broadly, renewable energy investment could accelerate due to ongoing geopolitical conflicts driving interest in lowering energy costs and increasing energy security (IEA. World, 2022). Increasing deployment of variable renewable energy (VRE) resources poses challenges to bulk power systems because of their variable and uncertain nature.
The integration of growing shares of VRE generation can be facilitated through a variety of strategies, such as enhanced flexibility of supply (Mallapragada et al., 2020) and demand (Paterakis et al., 2017; Mai et al., 2018), coordination and sharing of resources across larger geographic areas (Denholm et al., 2021a; Bloom et al., 2022), and improved generation forecasting for weather-based resources (Sobri et al., 2018). Modeling suggests that energy storage will play an important role in future grids (Weitemeyer et al., 2015; Denholm et al., 2020; Blair et al., 2022; Marocco et al., 2023) as it can provide multiple values to multiple locations in the grid, namely, at the transmission and distribution levels and the demand side (Pearre and Swan, 2015; Balducci et al., 2018). These values can be categorized as bulk energy services (peak load reduction and energy arbitrage), ancillary services, transmission services (e.g., congestion management), distribution services (e.g., upgrade deferral), and customer services (e.g., bill management, load shifting) (Akhil et al., 2016). The focus of this paper is values at the transmission level.
Storage can alleviate stress on the transmission network by, for example, storing energy at a location with forecast demand that will exceed transfer limits before those limits are met (Wang et al., 2019; Arteaga et al., 2021). Storage can also alleviate stress on the thermal generation fleet by providing quick ramping in response to changes in load conditions, reducing fuel costs and operations and maintenance (O&M) costs (O’Dwyer and Flynn, 2015; Shahmohammadi et al., 2018; Goteti et al., 2021). A well-known use case for storage is to ramp up in the evening as solar output declines in areas with high PV shares, as the rate at which system-wide net load (load minus VRE generation) increases often requires additional ramping of—and wear and tear on—the thermal generation fleet (Wang and Hodge, 2017; Verástegui et al., 2021). By reducing peak net loads, storage can defer investment in or replace other peaking resources like natural gas generators, thus providing capacity value to the grid (Denholm et al., 2020; West et al., 2022). Storage can further facilitate the integration of higher VRE shares by providing services to support grid stability on a sub-second timescale (Johnson et al., 2020), balancing supply on sub-hourly and hourly timescales (O’Dwyer and Flynn, 2015; Kargarian et al., 2016; Hemmati et al., 2021), and capturing energy that would otherwise be curtailed (de Sisternes et al., 2016; Jorgenson et al., 2018; Johnson et al., 2021; Yang et al., 2021).
The focus of this study is on an emerging and increasingly popular approach to enabling VRE integration through the hybridization of VRE and energy storage technologies (Seel et al., 2022). Commonly discussed hybrid renewable energy system designs in the United States leverage the complementary nature of VRE generation sources (Slusarewicz and Cohan, 2018; Clark et al., 2022; Harrison-Atlas et al., 2022), synergies between generation and storage technologies (Göransson and Johnsson, 2018; Frazier et al., 2020), regulatory and policy incentives (Murphy et al., 2021; Stenclik et al., 2022), and reduced balance-of-system (BOS) costs via the sharing of site preparation equipment and labor, substation equipment, and interconnection costs (Barker et al., 2021). A report by the Energy Systems Integration Group (ESIG) ranks avoided transmission and distribution upgrades as the second most important key driver of resource hybridization, behind only tax incentives (whose importance will likely diminish with the investment tax credit [ITC] for standalone storage that was introduced by the Inflation Reduction Act) (Stenclik et al., 2022).
The most popular hybrids in interconnection queues today, in terms of both number of plants and total capacity, combine solar photovoltaics (PV) and lithium-ion battery storage technologies, referred to as PV-battery systems (Bolinger et al., 2022). The synergies of PV and storage technologies are well documented in the literature, much of which applies for both independent and hybrid systems (Frazier et al., 2020; Denholm et al., 2021b), but additional synergies and efficiencies can be achieved through hybridization (Denholm et al., 2017; DiOrio et al., 2020; Schleifer et al., 2021). Wind-based systems are the second-most popular proposed hybrids, though their combined capacity is less than a 10th that of all proposed PV-battery hybrids as of the end of 2021 (Bolinger et al., 2022).
In this work, we investigate how the values of PV-wind and PV-wind-battery hybrid systems change under different grid conditions and how these evolving values compare to those of PV and PV-battery systems. We analyze the results in the context of the complementarity of solar and wind resources at select locations in the conterminous United States, although our results and methodology are relevant globally. The focus of this work is on AC-coupled systems in which each component has its own inverter(s). Furthermore, we allow these systems to be oversized relative to their point-of-interconnection (POI) capacity, which is held constant, in order to isolate the effects of combining resource profiles (as opposed to, for example, increased capacity value due to higher injection limits).
Studies on the value of combined PV, wind, and storage systems are relatively common in the context of standalone applications for microgrids and remote communities (Nandi and Ghosh, 2009; Mahesh and Sandhu, 2015; Sawle et al., 2016; Al-falahi et al., 2017; Khan et al., 2018). Analyses like these implicitly account for resource complementarity through the optimization of component sizing to meet demand. Analysis of PV-wind-battery hybrid systems is less common in the context of utility-scale plants providing energy and capacity value to the bulk power system. Studies have shown that the addition of wind capacity to solar capacity (either PV or concentrating solar power [CSP]) can reduce the amount of storage capacity needed to provide more uniform generation (Hoicka and Rowlands, 2011; Coker et al., 2013; Santos-Alamillos et al., 2015; Prasad et al., 2017; Zhang et al., 2018) or to meet a certain utility load profile (Solomon et al., 2010; Vick and Moss, 2013). Jurasz et al. analyzed very small PV-wind-battery hybrids at 86 locations in Poland, but their focus was on how resource complementarity contributes to reliably meeting a constant load (Jurasz et al., 2018). Ren et al. proposed a novel metric to analyze complementarity for PV-wind hybrids (without storage) across China but did not extend their analysis to implications for the power system (Ren et al., 2023). Li et al. performed a technoeconomic analysis of the addition of an electrolyzer to a single PV-wind-battery configuration for selling both electricity and hydrogen, but the value of electricity was based on a static feed-in tariff, and the analysis was performed for one low-complementarity location (Li et al., 2023). Others have analyzed PV-battery, wind-battery, and PV-wind-battery systems using a price-taker approach, but they used historic prices to estimate the potential revenue of hybrids operating in different markets (Montañés et al., 2022a; Gorman et al., 2022; G et al., 2023; Cox et al., 2023; Prasad et al., 2021).
This analysis expands on the existing literature by providing insight into the system value of PV-wind-battery hybrid systems. We evaluate the energy and capacity values of various PV-wind hybrid system configurations—in the present day and over the coming decades, as well as with and without a storage component. This analysis allows us to determine which hybrid configurations provide the highest value, in terms of their ability to reduce the investment and production costs of the grid, considering both the current grid mix and potential future grid mixes.
Another novel contribution of this work is our evaluation of the site-specific and configuration-dependent complementarity of the underlying PV and wind resources via the stability coefficient, which reflects the degree to which combining resources reduces variation in total output. This approach contrasts with the bulk of the complementarity literature in two main ways. First, much of the literature includes a spatial element and focuses on increasing uniformity of system-wide VRE supply (Widen, 2011; Santos-Alamillos et al., 2012). Studies have shown that the spatiotemporal complementarity of wind and solar (i.e., the extent to which siting wind and solar resources at multiple different locations increases temporal complementarity) can increase the total share of VRE generation on the bulk power system (Nikolakakis and Fthenakis, 2011; Jerez et al., 2013; Huber et al., 2014; Thomaidis et al., 2016) while reducing the required backup capacity of conventional generators (Solomon et al., 2016). Similar results are found in analyses of wind-hydro and solar-hydro complementarity (Kougias et al., 2016; Jurasz and Ciapała, 2017). The benefits of spatiotemporal complementarity are enabled largely by transmission infrastructure (Knezović et al., 2021). Since the components of our hybrid systems are all co-located, our analysis focuses on the temporal complementarity of the wind and solar resource at each location.
Second, most complementarity analyses have tended to focus on correlation metrics, with the Pearson coefficient being the most common (Jurasz et al., 2020). Kendall’s Tau and the Spearman rank coefficient have also been used, but substantial overlap exists in the insights provided by these metrics and the Pearson coefficient for wind-solar complementarity throughout the conterminous United States (Harrison-A et al., 2022). Cantor et al. assert that correlation is required but not sufficient for complementarity and that the scale of resources must be considered (Cantor et al., 2022a; Cantor et al., 2022b), which we do through the use of the stability coefficient. Jurasz et al. provide a comprehensive review of studies that have used—and proposed—a wide range of complementarity metrics, and they note the need for future studies to extend the insights provided by complementarity assessments to practical applications (Jurasz et al., 2020).
When combined with the previously described valuation analysis, our complementarity analysis allows us to evaluate whether the stability coefficient is a good predictor of the value of a hybrid renewable energy system across multiple locations and configurations. Targeted analysis allows us to explore the extent to which complementarity can be used to inform hybrid design choices, including the relative sizing of PV, wind, and battery components; whether wind or battery capacity would be more effective for smoothing PV generation at a given site; whether wind capacity can provide incremental value to a PV-battery project; and the highest-value location.
Methods
The methodology used for this analysis combines several existing electricity sector modeling tools to examine the value-maximizing operation of PV-wind-battery hybrid systems under a range of conditions, based on the methodology presented in (Schleifer et al., 2021; Schleifer et al., 2022), which is summarized in the left column of the flowchart shown in Figure 1. The middle and right columns provide an overview of the additional contribution of the current work, which is the analysis of wind and solar resource complementarity to provide context for hybrid system value.
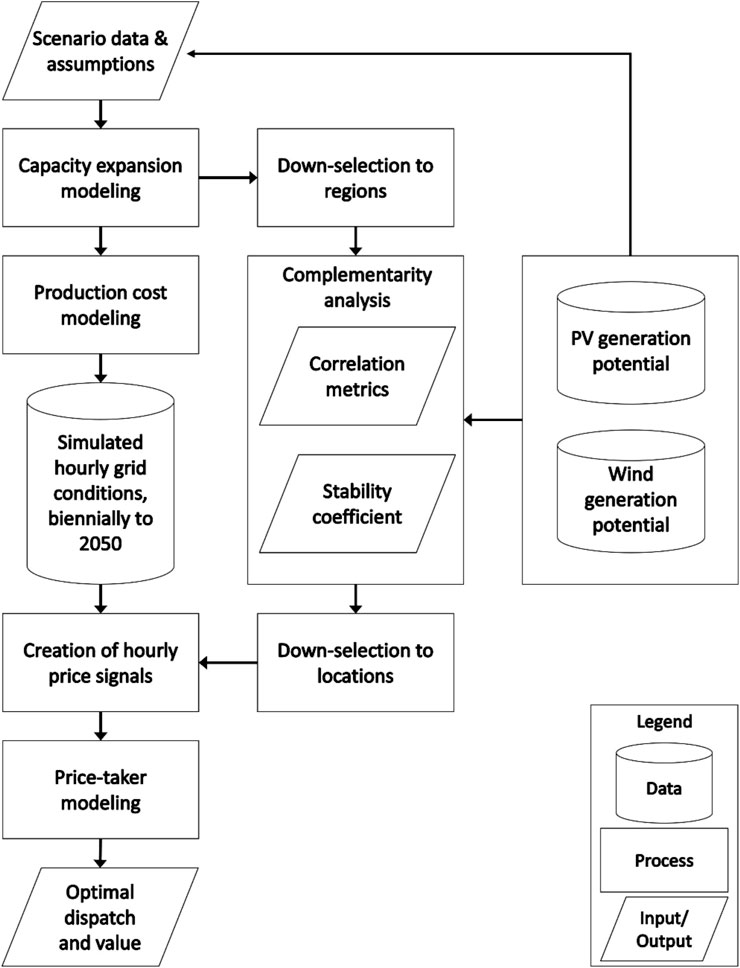
FIGURE 1. Flowchart describing the modeling process in this analysis.
Electricity sector modeling tools and approach
The evolution of the grid mix from present day to 2050 is determined by the Regional Energy Deployment System (ReEDS) capacity expansion model, which optimizes for the least-cost build-out of generation, storage, and transmission capacity for the conterminous United States (Ho et al., 2021). For this analysis, we used the Low Renewable Energy (RE) Cost case from the 2020 Standard Scenarios (Cole et al., 2020), which assumes advanced-innovation trajectories for the performance and costs of utility-scale and distributed PV, land-based and offshore wind, concentrating solar power with thermal energy storage (CSP-TES), and geothermal generation technologies. We used the Low RE Cost case to investigate the value of PV-wind hybrids under a wide range of conditions, from relatively low PV and wind shares in the near term to higher PV and wind shares in the future. The large increase in PV and wind shares in the Low RE Cost case allows us to analyze the value of PV, wind, and storage technologies as the increasing deployment of one technology reduces its own value and the value of other technologies (López Prol et al., 2020). More details of the Low RE Cost case can be found in the 2020 Standard Scenarios (Cole et al., 2020).
The ReEDS model provides the grid build-out of generation, transmission, and storage assets for every even year from 2020 to 2050. In turn, the hourly operational data for each even year are provided by Energy Exemplar’s PLEXOS production cost model based on the ReEDS results. These hourly data can be found in NREL’s Cambium dataset (Gagnon et al., 2023) and reflect performance of the generation fleet as well as constraints within the transmission network. These hourly data provided the marginal energy costs and net loads used to create price signals.
Hourly capacity prices were created by distributing the annualized cost of natural gas combustion turbine (NGCT) capacity over the 3% of hours in each year with the highest net loads. Based on NREL’s 2020 Annual Technology Baseline (ATB) Mid cost trajectory (Annual Technology Baseline, 2020), a 20-year amortization period, and a discount rate of 6.2% (consistent with ReEDS modeling), annualized NGCT capacity costs are $95.39/kW in 2022, $89.62/kW in 2030, $86.79/kW in 2040, and $84.09/kW in 2050.
The distribution of capacity prices is described by Equation 1, in which
These net loads account for existing variable renewable generation and discharge of pumped hydro storage and battery storage, meaning that the total values of the hybrid systems studied are marginal to all existing PV, wind, and storage technologies. While the energy prices are specific to each model balancing area (BA), the net loads that inform the capacity prices cover the entire model regional transmission operator (RTO), discussed further in the Study Locations section and in the Supplementary Material. As shown in (Schleifer et al., 2021), the capacity value of the hybrid systems is sensitive to the presence of capacity prices in the price signals but not to the number of hours over which they are distributed, and the presence of capacity prices has a negligible effect on energy value.
The combined energy and capacity prices are used as inputs to a price-taker optimization, the Revenue, Operation, and Device Optimization (RODeO) tool, to find the revenue-maximizing dispatch of a range of PV-battery and PV-wind-battery configurations. In this framework, maximizing the revenue of a hybrid plant is equivalent to maximizing its value to the grid, or its ability to prevent costs associated with fuel consumption, operations and maintenance (O&M), and deployment of peaking capacity. In this analysis, the price-taker optimization was run with an 8,760-h optimization window and with perfect foresight of price signals and PV and wind generation.
The effects of battery self-discharge were excluded, and cycle and calendar degradation were incorporated using a static variable O&M (VOM) cost of $5/MWh for both charging and discharging (Montañés et al., 2022a), which discourages cycling the battery for very small arbitrage opportunities. This VOM value is not included in net energy value calculations. These assumptions potentially result in optimistic estimates of hybrid system value but maintain the fast solve times required for the number of configurations, locations, and years studied.
The energy prices used throughout this work are not market prices. They are the modeled marginal cost of providing electricity to meet a given demand, assuming perfect knowledge and perfect competition among all generation and storage technologies operating in the system. Therefore, in this work, the value of PV-wind and PV-wind-battery systems reflects avoided energy and capacity costs and not market revenue.
Configurations
All the configurations explored in this analysis have a POI capacity of 100 MWAC, a PV capacity of 100 MWAC, and a storage duration of 4 h. We vary the wind and battery capacities—while holding the PV capacity constant—to study a) how wind and battery systems increase the value of PV and b) to what extent these systems have competitive or synergistic effects. This approach means that, as the wind capacity increases, the oversizing of the total VRE capacity relative to the POI capacity increases; such a strategy is effective for smoothing total output (Perez et al., 2019), and, as VRE deployment increases, new additions of VRE generators are likely to be located in more remote locations with potentially higher interconnection costs (Stenclik et al., 2022). Limiting the POI capacity can help avoid expensive network upgrades (Vander Vorst and Stern, 2022). See Table 1 for a list of configurations used in this study.

TABLE 1. Configuration parameters explored in this analysis.
We chose to vary the wind capacity while holding the PV capacity constant—and not vice versa—to limit the scope of the analysis and to allow for comparison with previous analyses of PV-battery hybrids since they are presently the most common utility-scale hybrids.
Our configurations are somewhat similar to the Wheatridge Renewable Energy Facility, the first utility-scale project in North America with co-located wind and solar generation and battery storage, in that the wind capacity is generally greater than the PV and battery capacity. The plant includes 300 MW of wind, which began operation in December 2020, and 50 MW of PV and 30 MW of 4-h battery storage, which began operation in the spring of 2022 (Flaccus, 2022). However, the PV and battery were added to the existing wind plant, which is the opposite of our approach. The plant’s location in Oregon has wind and PV generation that are generally in the middle tertile of mean capacity factors—and exhibit a similar level of complementarity—relative to other regions throughout the conterminous United States for the period 2007–2013 (Harrison-A et al., 2022). Future work could provide insight into how resource quality and complementarity influence the value proposition of adding wind to existing PV compared to adding PV to existing wind.
PV and wind generation profiles
The raw hourly PV and wind generation profiles used to develop combined PV-wind profiles for this analysis came from ReEDS PV and wind resource profile inputs, which came from NREL’s Renewable Energy Potential (reV) model (Maclaurin et al., 2019; reV, 2022). The reV model uses weather resource data from the National Solar Radiation Database (NSRDB) and the Wind Integration National Dataset (WIND) Toolkit in combination with the System Advisor Model’s (SAM’s) technology performance simulation capabilities to create generation profiles for a range of VRE technology configurations (Maclaurin et al., 2019). The generation profile data are based on 2012 weather data, have a spatial resolution of 11.5 km by 11.5 km, and account for siting exclusions (e.g., protected areas, urban areas, areas with difficult terrain, setbacks, etc.) (Brown et al., 2020). Throughout the paper, we refer to these spatially aggregated data as supply-curve data.
The hourly PV and wind profiles are normalized AC generation profiles, so they include inverter and other losses. The wind generation profiles represent systems with 90-m hub heights and 121-m rotor diameters (Annual Technology Baseline, 2020), and they include derating factors that account for unforced outages for maintenance and forced outages due to icing of turbine blades. The PV profiles represent single-axis tracking systems with an inverter loading ratio (ILR) of 1.3 (i.e., there is 1.3 MWDC of PV capacity for every 1.0 MWAC of inverter capacity). More details about the PV and wind resource profiles can be found in the reV documentation (Maclaurin et al., 2019) and the ReEDS documentation (Brown et al., 2020).
For each location and configuration, the PV and wind profiles were combined to create total VRE profiles, normalized by the total VRE capacity.
Complementarity metrics
The complementarity analysis in this study quantifies temporal synergies of co-located VRE generation, in terms of whether combining PV and wind systems produces generation that is less variable (i.e., smoother) than the generation of PV or wind alone. As previously discussed, correlation coefficients do not account for the absolute magnitude of PV and wind generation; so, for example, a PV-wind system with 100 MWAC of PV and 1 MWAC of wind will have the same correlation coefficient value as a PV-wind system with 100 MWAC of PV and 100 MWAC of wind in the same location—even though these systems will have very different outputs. To overcome this limitation, we focus our complementarity analysis on the stability coefficient, which reflects the degree to which adding wind generation to baseline PV generation reduces the diurnal variation in a plant’s total output (Sterl et al., 2018). A stability coefficient of 0 indicates that the diurnal variation in output of a PV plant is not reduced at all by the added wind generation, while a stability coefficient of 1 indicates that the added wind generation results in a perfectly uniform output.
The stability coefficient can be used to capture effects of system configuration (i.e., sizing) on hybrid synergies (Sterl et al., 2018). The diurnal variation is determined by the coefficient of variation, the ratio of the standard deviation to the mean of the generation profile (Equation 2). The stability coefficient for a given day is then determined by comparing the coefficient of variation of the combined PV-wind generation profile, cv,mix, to the coefficient of variation of the PV-only generation profile, cv,ref (Equation 3). The overall stability coefficient presented in the Results section is the average of the daily stability coefficients over the course of a year or a season.
For this analysis, the stability coefficient was calculated using the combined PV-wind generation profile output to the grid, meaning that the mixed profile was not allowed to exceed the POI limit of 100 MWAC. The effects of this assumption are shown in Figure 2: for a single site in Texas, the black line shows the stability coefficient of a PV-wind plant as the wind capacity is increased from 1 MWAC to 1000 MWAC, holding the PV capacity constant at 100 MWAC. With increasingly higher wind capacities, the stability coefficient plateaus because the wind generation cannot reduce the total output variation to exactly zero. As shown in blue, a smaller POI capacity would cause a more rapid increase in stability coefficient with wind capacity and a higher plateau.
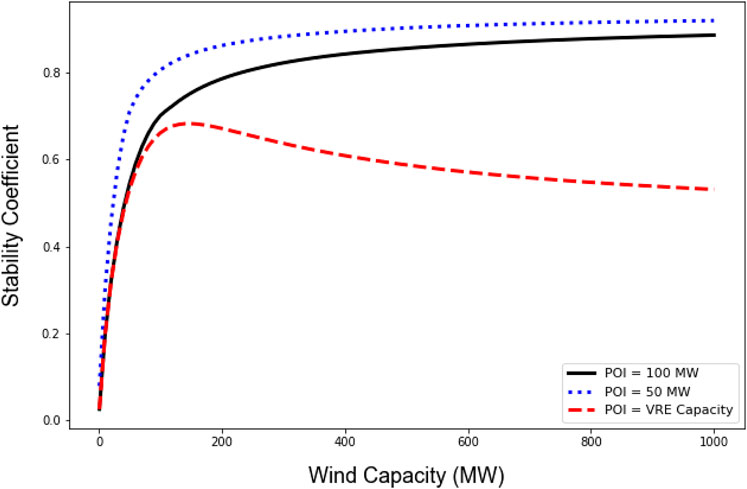
FIGURE 2. Increase in the stability coefficient at a single site as wind capacity from 1 MW to 1,000 MW is added to PV capacity of 100 MW, with the baseline POI capacity of 100 MW in black, a lower POI capacity of 50 MW in blue, and a varying POI capacity that is the sum of the wind and PV capacities in red.
The red line shows the stability coefficient of a PV-wind plant as both the wind capacity and the POI capacity increase such that the POI capacity is the sum of the PV and wind capacities. As the capacity of the wind component grows much larger than that of the PV component, the variability of the combined PV-wind generation profile approaches the variability of the wind-only generation profile (Supplementary Material). So, the stability coefficient of the mixed profile, where the POI capacity equals the total VRE capacity, begins to decrease at very high wind capacities. We chose to use the stability coefficient with consideration of the POI limit because the configurations modeled in this work all have a constant POI capacity of 100 MWAC and because this definition of stability coefficient results in a monotonically increasing relation (i.e., for a given set of possible PV and wind generation profiles, each possible PV-wind configuration results in a unique stability coefficient, even if the difference is vanishingly small at higher wind capacities).
Study Locations
This analysis focuses on select locations of Texas that provide the greatest insights into the current and future value of PV-wind-battery hybrids, as well as the relationship between value and complementarity. Considering expected VRE deployment, current curtailment levels, and complementarity, we focus on three regions of Texas: Southwestern Texas, Northeastern Texas, and Southern Texas (Supplementary Material for more details). These regions reflect a range of grid conditions, as shown by the generation shares of PV, wind, and battery in the top row of Figure 3. While each region has a relatively low (and slowly increasing) share of battery generation (in terms of discharge only), they vary widely in their shares of PV and wind generation in 2022 and how they change over time. The bottom row of Figure 3 shows the subsequent impact on the average energy value of the existing PV, wind, and battery fleet.
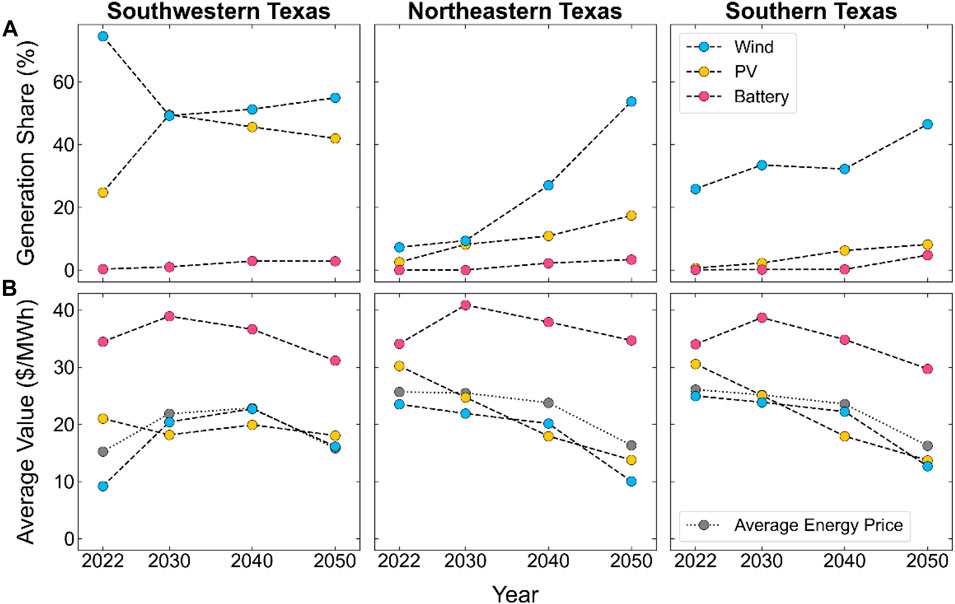
FIGURE 3. Generation share (A) and average energy value (B) of existing wind, PV, and battery systems for years evaluated in this work; battery generation share includes discharge only, and battery average value includes energy revenue only (not grid-charging costs).
Out of the thousands of supply-curve sites in Texas for which PV or wind generation data exist, we filtered the data to include only those sites with both PV and wind generation data. Not every supply-curve site has both PV and wind generation data because of technology-specific constraints for exclusion areas. From these sites, we selected up to 6 sites in each study region that reflect a wide range of complementarity, including the minimum and maximum stability coefficient values based on the PV-wind configuration with 100 MW of PV capacity and 100 MW of wind capacity (Supplementary Material for more details).
Value streams and metrics
The value streams analyzed in this work are energy value and capacity value, where the former represents avoided fuel and operating costs and the latter represents avoided costs of new generator capacity due to the presence of the added hybrid system. The energy value is the energy revenue minus the cost of charging the battery from the grid, as shown in Eq. 4, where
The capacity value is the product of a configuration’s capacity credit (in MW) and the annualized cost of NGCT capacity (in $/MW-year), as shown in Eq. 5. This approach for estimating the avoided cost of new capacity is common in the context of grid planning (Cutter et al., 2014). The capacity credit of a configuration reflects its ability to provide firm capacity, or its contribution to maintaining adequate system-wide supply to meet demand throughout the year. We calculate the capacity credit using the incremental net load duration curve (INLDC) approach, in which the capacity credit of a given plant is the average amount by which it reduces the net load over a set of hours with the highest net loads (Frew et al., 2017). Given the uncertainty around the number of highest-net-load hours that result in the most accurate approximation (Mills and Rodriguez, 2020), we average the INLDC capacity credit approximations using 10–100 h (for a total of 91 individual approximations), as shown in the second part of the right-hand side of Eq. 5, where
The total value of a configuration is the sum of the energy value and capacity value, and it represents the reduction in energy and capacity costs to the bulk power system from the perspective of a central planner and operator. The values reported in this analysis are the system values of the modeled configurations, not market values, and do not include other potential value streams such as renewable energy credits, operating reserves and other essential reliability services, avoided emissions, or resilience. Energy and capacity costs comprise most electric system operating costs (Denholm et al., 2019), and price-taker modeling is not appropriate for value streams with shallow requirements, like operating reserves, as additional operating supply would likely influence prices (i.e., act as a price-maker) (Ikechi Emmanuel and Denholm, 2022). Additionally, transmission representation is exogenous to price-taker modeling, represented only through the hourly price signals, so transmission-related value streams also require a different modeling approach (Martinek et al., 2018; Ikechi Emmanuel and Denholm, 2022).
We compare the value increase associated with the addition of battery capacity to PV and PV-wind systems, in terms of $/kW-year, to the estimated cost of battery capacity from the 2020 ATB. To annualize the battery capacity costs, we assume a 15-year battery lifetime and a discount rate of 6.2% (consistent with ReEDS (Ho et al., 2021)). The 15-year lifetime is taken from the literature review performed by Cole et al. (Cole et al., 2021). A shorter lifetime would increase the cost of adding battery storage to the PV or PV-wind system and could result from, for example, extreme hot or cold ambient temperatures, excessive cycling, greater depth of discharge, and increased charge/discharge rates (Smith et al., 2017). Cycle life could improve dramatically in the coming years as degradation mechanisms become better understood and depending on funding of research and development (Few et al., 2018). We do not adjust the battery costs to account for any potential cost savings associated with co-location of the battery with the PV and wind capacity (Ramasamy et al., 2021).
Results and analysis
In the following sections, we explore the relationship between seasonal complementarity and performance metrics (i.e., capacity factor and capacity credit) for all PV-wind and PV-wind-battery configurations. Then we focus in on select sites and configurations to explore the influence of PV-wind complementarity and grid conditions on the dispatch behavior of PV-wind-battery systems in the near term and in future years.
Complementarity and performance metrics of PV-wind systems by season
Increasing the wind capacity of a PV-wind system increases the stability coefficient, but the magnitude depends on location. Therefore, we present the capacity factors of PV-wind systems in Figure 4 as a function of both wind capacity (Figure 4B) and stability coefficient (Figure 4A). PV systems without any wind capacity are shown as having a stability coefficient of zero.
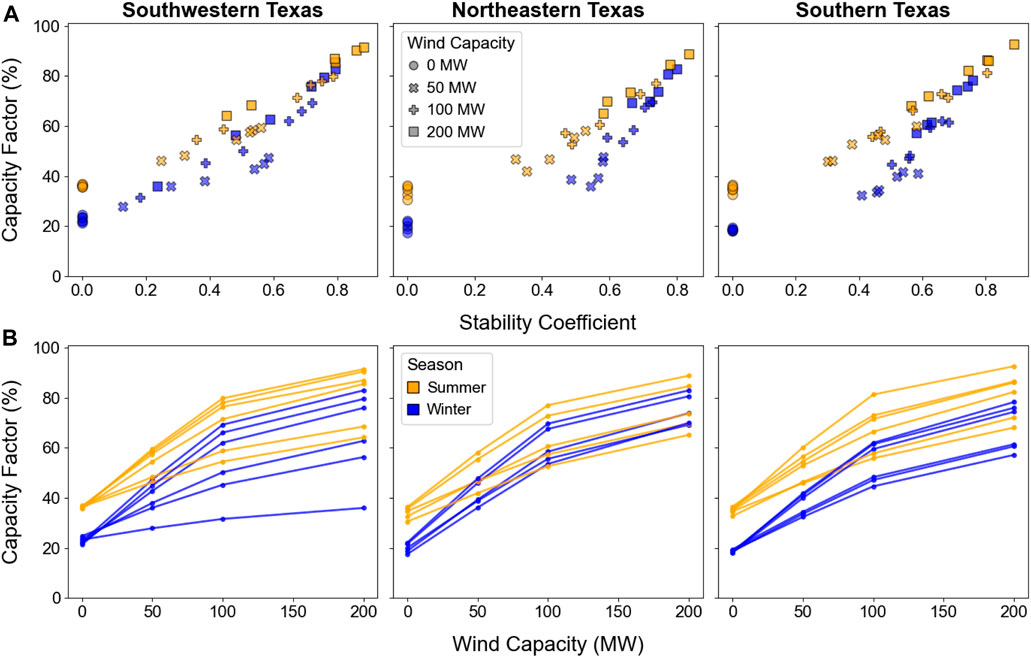
FIGURE 4. Winter and summer maximum capacity factors, with no curtailment, for each PV and PV-wind configuration as a function of stability coefficient (A) and wind capacity (B); in (B), lines connect configurations located at the same site.
Within a given region, there is at least one site where a PV-wind system with 200 MW of wind capacity has a lower capacity factor than a PV-wind system with half the wind capacity at a different site. For example, in southwestern Texas, there is one site where adding 200 MW of wind to 100 MW of PV behind a 100-MW POI increases the capacity factor by less than 10%. At sites like these, the stability coefficient does not increase as quickly with increasing wind capacity as it does at other sites—either because the wind by itself has a low capacity factor or because the wind generation coincides with the PV generation and, therefore, gets clipped because it exceeds the POI capacity.
These results show that the stability coefficient is a more reliable indicator of a PV-wind system’s capacity factor in these regions of Texas, whereas wind sizing can be misleading when it comes to the joint PV-wind capacity factor. This conclusion is also true when considering curtailment: although curtailment reduces the capacity factors of PV-wind configurations in all years in this study (but not standalone PV in 2022 in northeastern and southern Texas), the trends in the top row of Figure 4 remain generally the same (Supplementary Material for capacity factors with curtailment in 2022 and later).
Figure 5 presents the summer and winter capacity credits of the PV-wind configurations in 2022. These results illustrate the seasonal variation in both a) the capacity credit of standalone PV and b) the effect of added wind capacity. The relatively high summer capacity credit of standalone PV (∼80% and higher at all but one site) means that there is less opportunity for added wind capacity to increase the total capacity credit. As a result, the summer capacity credits of PV-wind systems are not well predicted by either wind capacity or stability coefficient. For example, in southwestern Texas, the site and configuration with the highest summer stability coefficient has one of the lowest summer capacity credits, while the sites and configurations with summer stability coefficients as low as 0.2–0.4 have some of the highest summer capacity credits. Similarly, some sites with only 50 MW of wind have higher capacity credits than other sites with 200 MW of wind.
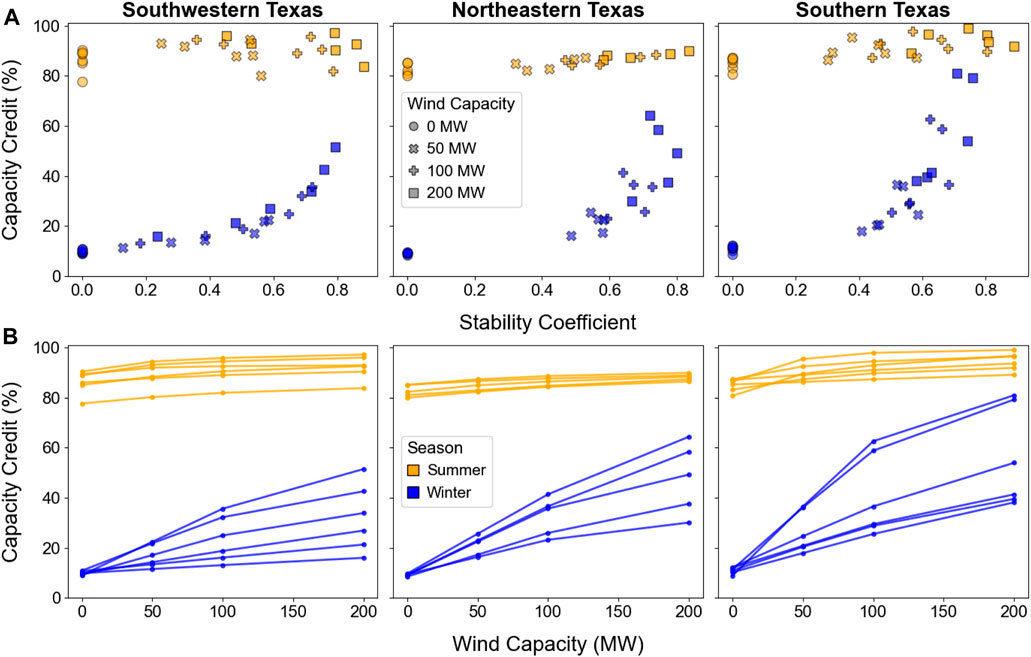
FIGURE 5. Winter and summer capacity credits in 2022 for each PV-wind configuration as a function of stability coefficients (A) and wind capacity (B); in (B), lines connect configurations located at the same site.
In the winter, the effect of adding wind to PV varies strongly based on location. At certain sites, adding wind can increase the capacity credit from less than 15% of the POI capacity to nearly 80%; at other sites, adding 200 MW of wind increases the winter capacity credit by less than 10% of the POI capacity. The winter capacity credits have a clearer relationship to the winter stability coefficients, although the relationship is nonlinear, as opposed to the more linear relationship seen with the capacity factors.
In later years (Supplementary Material), the winter and summer capacity credits of all the configurations at all the sites are lower than in 2022 (because of the growing deployment of PV and wind generation over time), but many of the same trends hold. For example, wind capacity continues to be a poor predictor of the capacity credits of PV-wind systems, and winter capacity credits follow the same patterns (but with an overall shift downward). However, the summer capacity credits have a different pattern with more random variation in later years. The sources of this random variation likely arise from unintuitive nuances in the stability coefficient calculation. First, by the definition of the stability coefficient, a PV-wind system with a seasonal stability coefficient of exactly 1.0 would provide uniform generation over all hours of the season, regardless of the magnitude of that uniform generation. So, a PV-wind generation profile could have a stability coefficient of exactly 1.0 but still not have a capacity credit of 100% if that uniform profile does not equal the full POI capacity.
Second, consider the extreme case in which a PV-wind system’s output profile is uniform at the POI capacity for the highest 100 net load hours in a season, but PV and wind generation are perfectly overlapping in all other hours. In that case, the stability coefficient would be close to zero, but the system would have a 100% capacity credit based on the capacity credit approximation used in this analysis. Conversely, if the added wind generation perfectly complements the PV generation for all hours in a season except for the 100 h with the highest net loads, then the stability coefficient would be close to 1.0, but the capacity credit would equal that of standalone PV. So, there is a mismatch in temporal scope between the stability coefficient (for which >2,000 h in a season are relevant) and the capacity credit (for which only 100 h in a season are relevant in this analysis). This temporal mismatch does not exist for the relationship between stability coefficient and capacity factor, which explains their more linear relationship.
While the stability coefficient predicts capacity factor relatively well, regardless of wind capacity, it does not predict the amount of energy clipped behind the POI very well. This clipped energy is an important factor in the role and value of the battery component of PV-wind-battery hybrid systems.
Complementarity and performance metrics of PV-wind-battery systems by season
The addition of a battery component improves the plant-level capacity factor and capacity credit by capturing generation that would otherwise by clipped or curtailed and allowing more energy to be available during the highest-net-load hours of the year. The increases in summer and winter capacity factors when battery capacity is added to PV-wind systems are shown in Figure 6 as a function of stability coefficient for each configuration and site.
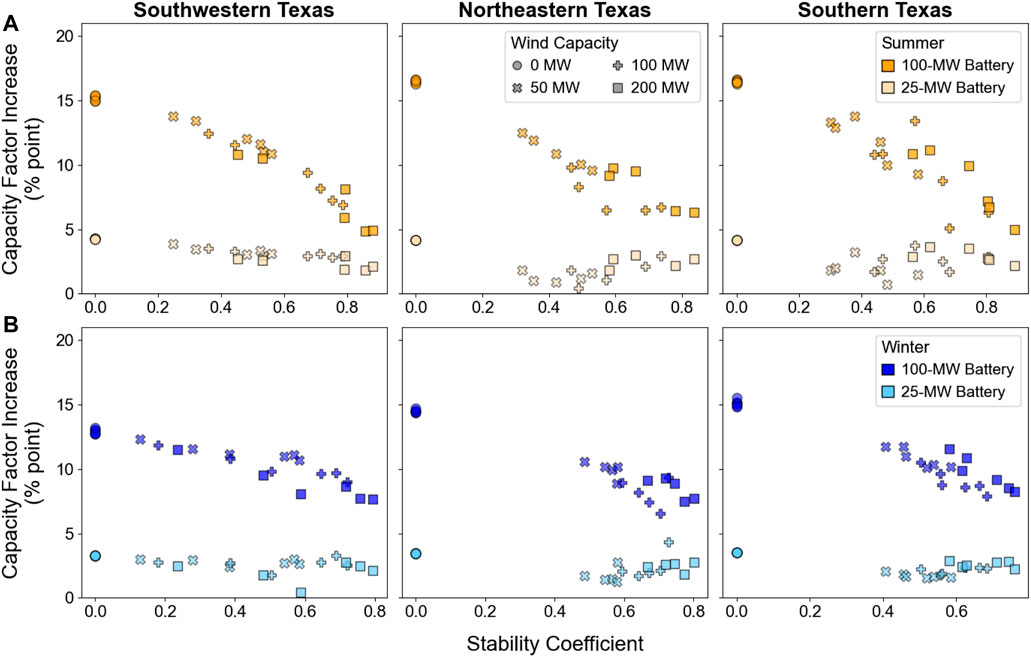
FIGURE 6. The percentage-point increase in capacity factor when 25-MW (lighter markers) and 100-MW (darker markers) batteries are added to PV-wind configurations in the summer (A) and winter (B) in 2022.
Adding a 25-MW battery leads to a <5 percentage point increase in the summer and winter capacity factors of PV and PV-wind systems (with a 100-MW POI), regardless of stability coefficient (or site). The influence of a 100-MW battery on the capacity factors of PV and PV-wind systems scales with stability coefficient. For sites with relatively low stability coefficients, a larger battery results in a greater capacity factor increase (on the order of 10–15 percentage points). For sites with relatively high stability coefficients (approaching 0.8), the effects of adding a 25-MW or 100-MW battery are comparable, especially during the summer months. This result is intuitive because a high stability coefficient indicates that wind production is high during non-solar hours, such that there is limited POI capacity available for the battery to discharge to the grid—the battery cannot shift as much PV generation because the wind generates during the hours to which the generation would be shifted.
The increases in summer and winter capacity credits when battery capacity is added to PV-wind systems are shown in Figure 7 as a function of stability coefficient for each configuration and site. When PV by itself has relatively high capacity credit, the effect of added battery capacity on capacity credit is limited by the POI capacity. In 2022, all the PV-wind-battery systems with 100-MW batteries achieve full summer capacity credit, and all configurations with 25-MW batteries achieve summer capacity credits greater than 90%, but the firm capacities of these systems could be higher with higher POI capacities.
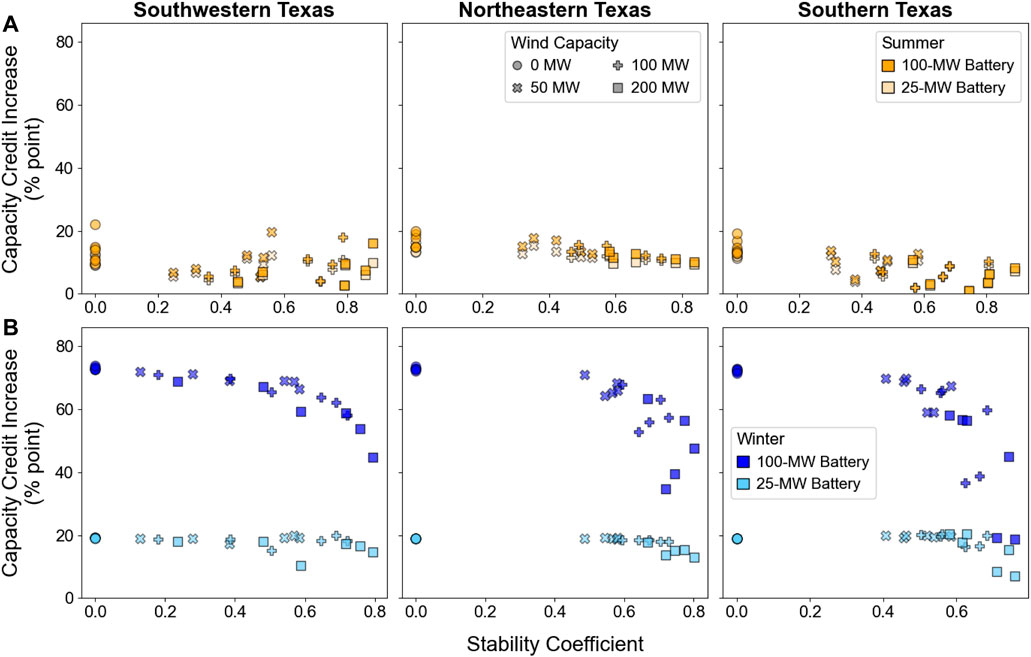
FIGURE 7. The percentage-point increase in capacity credit when 25-MW (lighter markers) and 100-MW (darker markers) batteries are added to PV-wind configurations in the summer (A) and winter (B) in 2022.
As with the capacity factor results, the capacity credit results show that the stability coefficient is a good indicator of both how adding wind to PV increases capacity credit and how it reduces the opportunity for additional battery capacity to increase capacity credit. Similarly, adding battery capacity to standalone PV or to PV-wind systems with lower wind capacities reduces the opportunity for additional wind capacity to increase capacity credit. With PV as the reference profile, wind and battery capacity play the same role in increasing generation (or being available to provide generation) during hours when PV generation is low.
Dispatch of PV-wind-battery systems with highest and lowest stability coefficients
Figure 8 shows the dispatch of a PV-battery configuration (top row) and two PV-wind-battery configurations (middle and bottom rows) during a modeled week with weather from August of 2022 at a site with a high summer stability coefficient (based on a 1:1 wind:PV ratio). The wind generation is shown in 50-MW segments, and the battery capacity is shown in two segments (the first 25 MW of capacity and then the addition of 75 MW for a total of 100 MW). The horizontal grey lines indicate the POI capacity of 100 MWAC. These plots include the energy discharged from the battery but not the energy used to charge the battery.
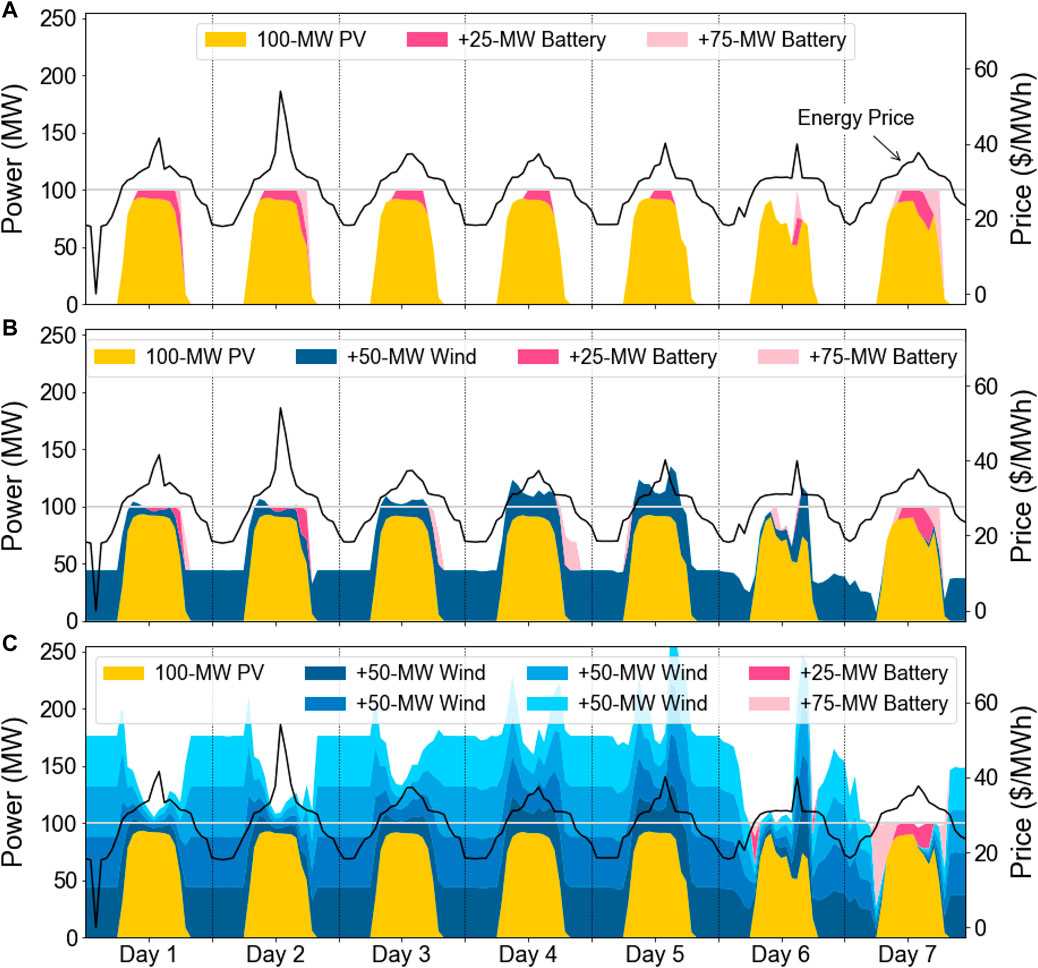
FIGURE 8. Dispatch of PV-battery (A) and PV-wind-battery (B,C) systems over a week period in August.
The top row shows that, in the absence of the wind generation, the battery cycles once per day to supplement the PV generation during the day. During this year, high electricity prices and high net loads coincide with solar insolation, so the PV generation does not need to be shifted by the battery to maximize value. The first increment of battery capacity discharges during the hours with the highest insolation, while subsequent increments of battery capacity discharge during shoulder hours as the sun rises and sets. With a lower battery VOM, the battery would discharge more during some of the lower-priced shoulder hours.
The bottom row shows that a system with 100 MW of PV capacity and 200 MW of wind capacity provides uniform generation at the capacity of the POI, and thus has a daily stability coefficient of 1.0, during the first 5 days of this period. During these days, the battery does not discharge at all, and there is a significant amount of energy clipped at the POI.
To highlight the effects of PV-wind-battery configuration, Figure 9 summarizes 2022 dispatch results for each configuration at the sites with the lowest (teal bars) and highest (magenta bars) annual stability coefficient. Both sites are in the Southwestern Texas BA, so the comparison of configurations is not influenced by different price signals. Figure 9 shows the total generation from the PV and wind components of each PV-wind-battery system and whether the generation is used (i.e., sent to the grid or used to charge the battery) or wasted (i.e., curtailed or clipped). Power-limited clipping occurs when the rate of electricity generation exceeds the combined power capacities of the battery and POI. Power-limited clipping depends on the sizing of the hybrid system components only, so it does not change from year to year as grid conditions change. Energy-limited clipping occurs when the rate of electricity generation exceeds the POI capacity and cannot be sent to the battery because the battery is fully charged. Energy-limited clipping, like curtailment, could be reduced with longer storage duration, whereas power-limited clipping requires both higher battery capacity and longer storage duration to be reduced.
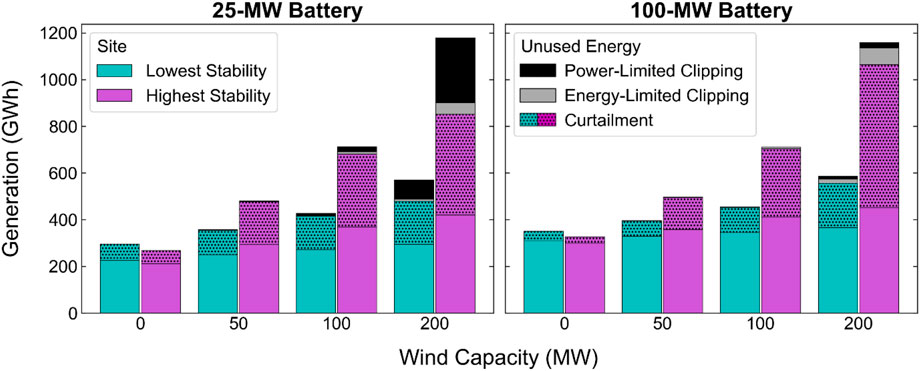
FIGURE 9. Total used and unused energy for PV-battery and PV-wind-battery systems at the sites with the lowest (cyan bars) and highest (purple bars) stability coefficients.
The PV-only system at the high-stability site has lower total generation and fewer hours at full POI output than the PV-only system at the low-stability site, so part of the reason this site has a higher stability coefficient is that the baseline PV generation profile has higher variation (i.e., the denominator in Eq. 3 is greater). At this site, there is greater potential for wind to reduce variation in the total combined output.
As the wind capacity increases, the total energy output increases more at the site with the higher stability coefficient than at the site with the lower stability coefficient, and the same is true for the number of hours at full POI output (Supplementary Material). For both battery sizes, some of this increased generation leads to increased clipped and curtailed energy. Even with wind capacity as high as 200 MW, systems with 100 MW of battery capacity can capture a large portion of the energy that would be clipped (though not energy that is curtailed).
Figure 10 shows the amount of energy the battery component charges and where the energy comes from—the grid or the coupled PV-wind. Comparing PV-battery systems at the low- and high-stability sites (far left bars in each panel), the difference in where the battery gets its energy is minimal. But as wind capacity increases, the portion of the battery’s energy that comes from the coupled PV-wind increases at both sites because the battery charges more from the wind generation that would otherwise be clipped by the POI limit. At the low-stability site, the battery charges about the same amount of energy (total bar height) regardless of wind capacity. At the high-stability site, the battery charges less total energy with higher wind capacity, indicating that the battery component provides less energy overall because it is displaced by the wind generation. In other words, at the high-stability site, greater sizing of the wind components leads to reduced utilization and cycling of the battery component.
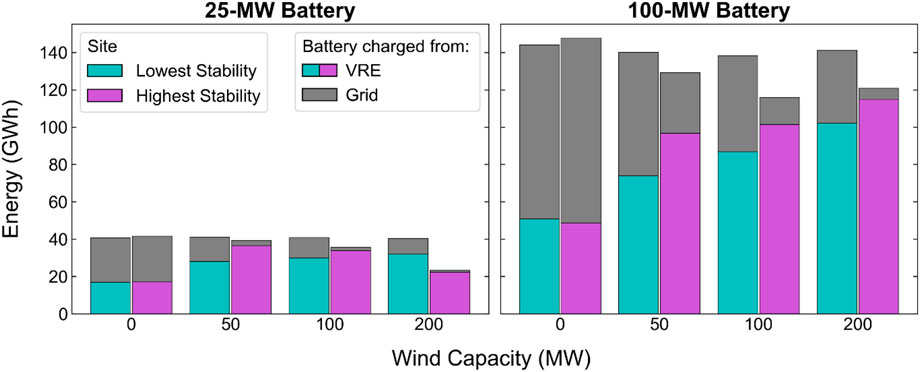
FIGURE 10. Source of energy for battery charging for PV-battery and PV-wind-battery systems at the sites with the lowest (cyan bars) and highest (purple bars) stability coefficients in the year 2022.
The amount of energy used to charge the battery is greater in all modeled years after 2022 for each configuration, but the patterns remain the same (Supplementary Material).
Performance of select PV-wind-battery configurations at high-stability sites
In this section, we focus on the operation of select PV-wind-battery configurations at the highest-stability site in each BA for each year modeled. We first compare systems with different wind capacities (wind:PV ratios of 1:1 and 2:1) but the same battery capacity (battery:PV ratio of 1:1). Then we compare systems with fixed wind capacity (wind:PV ratio of 1:1) and different battery capacities (battery:PV ratios of 1:4 and 1:1) to demonstrate the battery’s role in providing firm capacity to the grid.
Figure 11 shows how the PV and PV-wind generation is used (by being sent directly to the grid or used to charge the battery) and how it is wasted through clipping and curtailment. The dotted portions of the bars in Figure 11 indicate energy from the coupled PV system. Each PV-wind-battery system with 200 MW of wind capacity has very high clipping and curtailment in every year, regardless of battery size. As shown previously in Figure 9, curtailment contributes greatly to wasted energy even when power-limited and energy-limited clipping are relatively low. In areas and years studied here, 4-h storage duration is insufficient to overcome curtailment related to insufficient transmission capacity, which is consistent with previous research (e.g., Jorgenson et al., 2018).
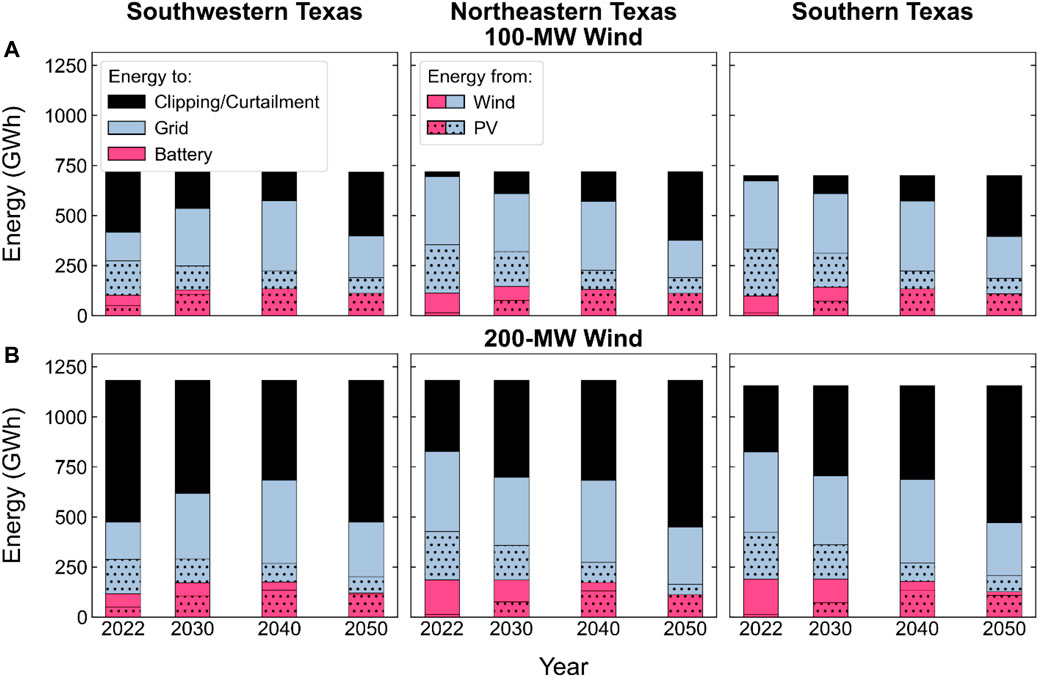
FIGURE 11. Amount of PV-wind generation that goes to the coupled battery, to the grid, and to clipping and curtailment at each BA’s highest-stability site for systems with 1:1 wind:PV (A) and 2:1 wind:PV (B).
Similar to previous results of PV-battery systems, a growing portion of PV generation is used to charge the battery in future years, with less going directly to the grid, as PV shares increase over time and decrease the value of new PV generation. Energy sent to the battery is basically the same over time, with decreases in 2050 across all three areas because of greater storage capacity in that year.
Because of the amount of energy wasted by configurations with 200 MW of wind capacity, we limit our focus on capacity credit results to systems with 100 MW of wind capacity in Figure 12. This figure reiterates that stability coefficient does not have as clear a relationship with capacity credit as it does with capacity factor. The low-stability site in southwestern Texas has higher PV-only capacity credit than (and similar wind-only capacity credit to) the high-stability site, so it also has higher PV-wind capacity credit. The high-stability site in southern Texas has higher wind-only capacity credit than (and similar PV-only capacity credit to) the low-stability site, so it has higher PV-wind capacity credit.
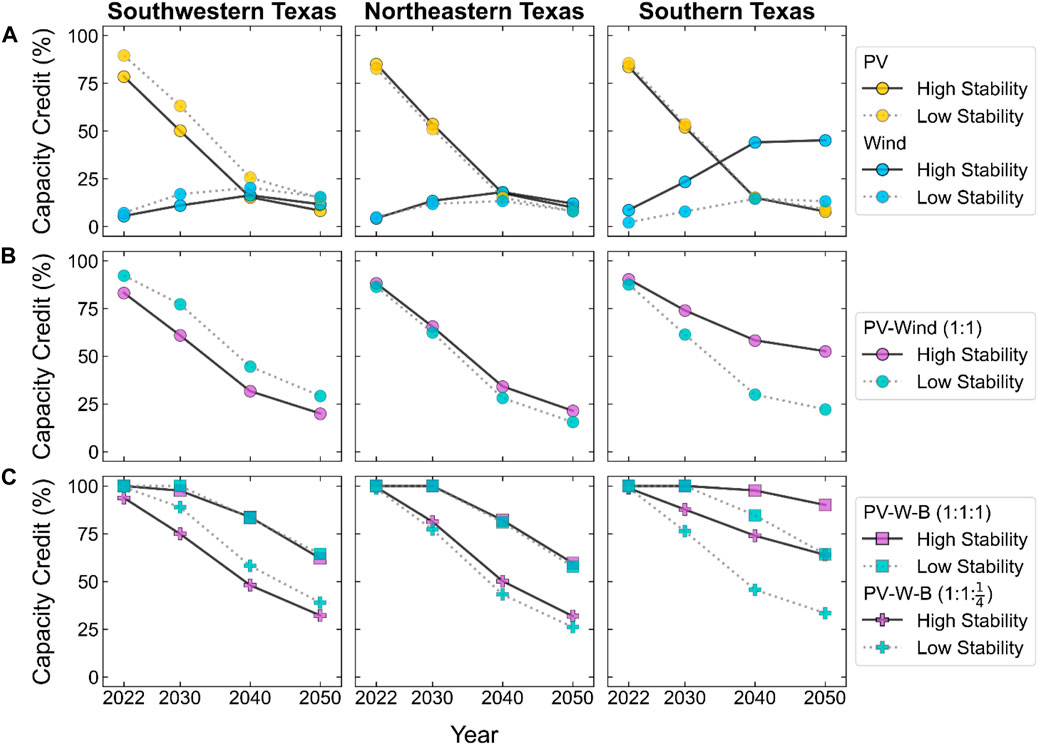
FIGURE 12. Capacity credits of PV-only and wind-only systems (A), PV-wind systems with 1:1 PV:wind capacity (B), and PV-wind-battery systems with 1:1 PV:wind capacities and 100-MW (square markers) and 25-MW (plus markers) batteries (C).
As the capacity credits of standalone PV and wind approach zero, the PV-wind-battery system capacity credit is set by the battery. When we calculate PV-only and wind-only capacity credits with their full generation (i.e., ignoring curtailment), the results do not change, so the capacity credits of these systems are not limited by transmission constraints (i.e., these site-specific wind and PV generation profiles just are not coincident with the highest net loads in the broader RTO region). So, while more transmission capacity would reduce curtailment and improve energy value, it would not necessarily improve capacity value within the broader RTO region (although greater export outside of the studied RTO region could contribute to resource adequacy in other RTO regions). Longer-duration storage is needed for higher capacity credit.
Discussion and limitations
The results of this work are similar to previous results involving PV-battery systems with high inverter loading ratios (ILRs), or ratios of DC PV capacity to AC inverter capacity: greater degrees of oversizing of the VRE generation increase a hybrid system’s capacity factor but not necessarily its capacity credit, especially as PV and wind generation shares increase and reduce their marginal capacity credit. Oversizing the generation capacity results in greater amounts of clipped energy, but a quick analysis (Supplementary Material) reveals that increasing the POI capacity to reduce this clipped energy for configurations with 50 MW and 100 MW of wind capacity would be economic if the cost of doing so would be less than ∼$200 per kW of added POI capacity. Given increasingly higher interconnection costs in the United States in recent years, it is likely that increasing the POI at more remote locations would not be cost effective. However, the Federal Energy Regulatory Commission and U.S. ISOs are working on interconnection reform (St. John, 2022), so the economics of oversizing VRE might change in the long term.
Across potential locations, the stability coefficient can indicate where it might be most valuable to build new PV-wind or PV-wind-battery systems. The stability coefficient provides a clearer trend with capacity factor and capacity credit than the relative sizing of PV and wind components; however, the stability coefficient’s ability to predict performance metrics becomes limited as higher shares of wind and PV on the grid increase curtailment.
At higher PV and wind shares, coupled battery capacity plays a larger role in providing firm capacity. Figure 13 shows the value (energy and capacity value) of battery capacity added to PV and PV-wind configurations in present value terms, assuming a 15-year lifetime, a discount rate of 6.2%, and that the year-one incremental value is the same for each year of the plant’s life. The values in Figure 13 can be interpreted as an approximate upper bound for the upfront incremental battery costs that could be justified by the added value of the battery. We exclude the year 2030 in this figure because 2040 and 2050 sufficiently show the future trends.
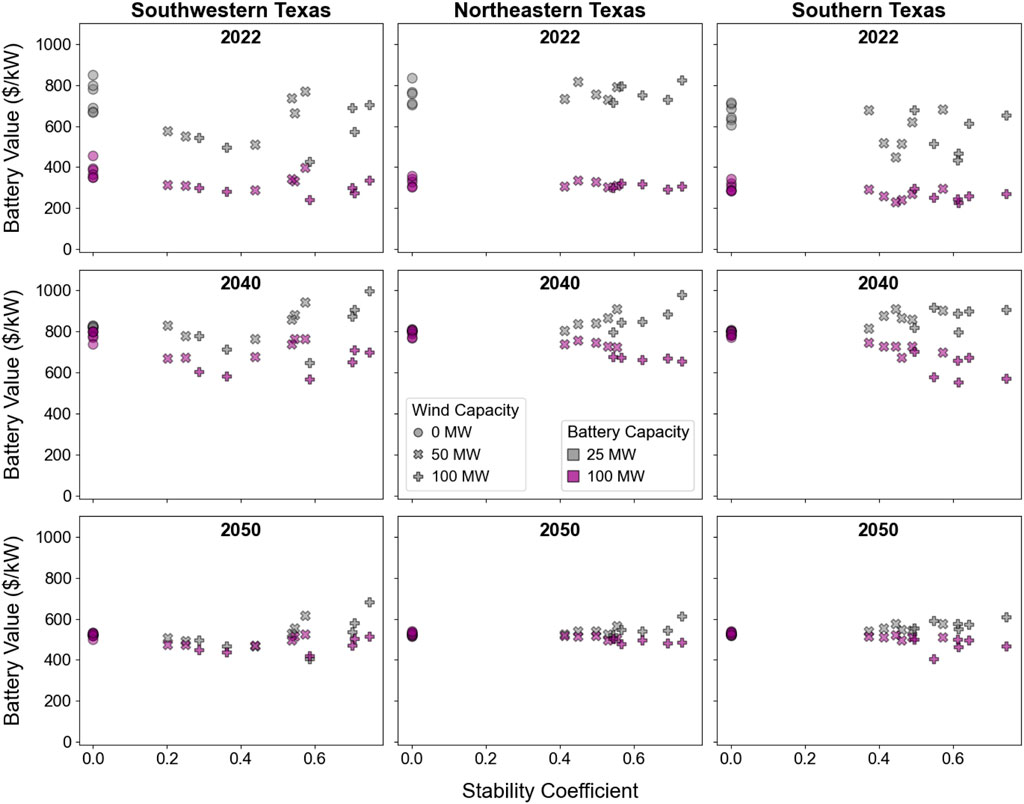
FIGURE 13. The value of battery storage added to PV and PV-wind configurations, in terms of $ per kW of battery capacity, in 2022, 2040, and 2050.
The first 25 MW of battery capacity has higher per-kilowatt value than subsequent battery capacity additions in years with lower PV shares and higher standalone PV value, but the per-kilowatt values of the smaller and larger batteries converge as the larger battery becomes more necessary for providing higher capacity credit and capacity value. So, in the near term, a smaller battery is preferred because it provides similar incremental energy and capacity value as a larger battery but at a lower cost. Over the long term, a larger battery becomes preferred as the battery’s role in providing firm capacity increases. There is no meaningful relationship between the incremental value of the battery capacity and the stability coefficient of the underlying PV-wind resource due to the influence of capacity value.
Adding wind capacity with a relatively high stability coefficient increases energy value more effectively than adding battery capacity. Given that wind capacity and battery capacity both serve to increase total combined output during times when PV generation is low, the additional energy value that wind capacity provides is always lower when considered as an addition to a PV-battery system with a larger battery capacity. So, adding wind capacity to PV reduces the value of adding battery capacity, and adding battery capacity to PV reduces the value of adding wind capacity.
Solar’s low capacity factor means lower utilization of transmission infrastructure and thus higher costs per unit of energy delivered (Solar Futures Study, 2021), and wind can have a similar obstacle to development despite its higher typical capacity factors. Combining solar, wind, and storage at one location and behind one POI increases transmission infrastructure utilization and reduces per-kWh investment costs. Our results show that sites with higher stability coefficients can increase capacity factor and transmission utilization more than sites with lower stability coefficients, for a given wind capacity, but the same is true of the amount of clipped and curtailed energy, which presents competing interests in the current landscape of clean energy policy.
This analysis did not attempt to find the optimal PV-wind or PV-wind-battery configuration, which would be a function of not just the energy and capacity values analyzed in this study but also the configuration-dependent capital and operations and maintenance costs. Furthermore, we used just 1 year of weather data, but multiple years of weather data are needed to more fully understand the effects of the interannual variability of PV and wind generation on the value proposition of PV-wind and PV-wind-battery hybrids. While the interactions of PV-wind-battery systems with the evolving bulk power system were studied, the potential deployment of these systems and their subsequent effects on the bulk power system were not analyzed.
Finally, in this analysis, we focused on how reducing the variability (or increasing the uniformity) of a plant’s total output can increase its value to the bulk power system by lowering energy and capacity costs, but reducing the variability of VRE generation can also reduce other system costs. For example, lower output variability could reduce the required total capacity of reliability services products like frequency regulation and spinning reserves. Hybrid systems with more predictable, uniform output could also provide these reliability services instead of being a reason for their procurement (Seel et al., 2018). However, market participation models need to be studied, developed, and adopted for the full value of hybrid resources to be realized in electricity markets (Goggin et al., 2018; Stenclik et al., 2022). Markets and regulations would need to adapt to enable and incentivize participants to adopt enterprise architectures that position them to be able to respond more nimbly to both evolving trends and disruptive technologies in the electricity sector (Gorski, 2018; Wu et al., 2021). Market reform and its potential impact on hybrid system value is left for future work.
Conclusion
In this analysis, we used a price-taker dispatch optimization tool to determine how the energy and capacity values of PV-wind-battery hybrid systems with a range of wind and battery capacities could evolve over time in locations with varying degrees of complementarity between solar and wind resources. We used the stability coefficient, a measure of resource complementarity, to assess the degree to which complementarity is an indicator of the value of hybridizing solar, wind, and storage resources.
The results for various PV-wind configurations showed that the stability coefficient, which reflects both complementarity of resource profiles and their relative magnitudes, is a reliable indicator of capacity factor and capacity credit. However, while the stability coefficient (as defined in this analysis) reflects the reduced variation in generation at the POI, it does not reflect as well what happens behind the POI (namely, the amount of clipped energy and the associated loss in value), and it does not predict the interactions of the output generation with energy prices or curtailment.
Because the stability coefficient provides an indication of the ability of wind capacity to “fill in” during hours when PV generation is low or zero, it also predicts circumstances, or configuration-location combinations, in which a smaller battery can achieve comparable economic performance in PV-wind-battery system compared to a PV-plus-battery system. Within the context of a PV-only baseline, adding wind or battery capacity fulfills essentially the same role with respect to energy and capacity value: each one provides output to the grid at times when energy prices and/or net loads are high but PV generation is low.
More broadly, the combination of diverse resources behind one point of interconnection can mitigate the risk of a plant’s value declining due to changing grid conditions. This feature of hybrid systems will become increasingly more important as the electricity sector responds to and integrates new technologies, innovative applications of existing technologies (e.g., aggregation of demand-side resources into virtual power plants) (Uslar et al., 2019), and new market participation models. Additionally, the modular nature of VRE and storage technologies could enable incremental additions of component capacity to respond to changing conditions. While this analysis compared many configurations of PV-wind and PV-wind-battery systems, it did not optimize any configurations. Future work should consider how the optimal configuration of a hybrid system might evolve over its lifetime by incremental additions of PV, wind, and battery capacity and storage duration, considering both changing grid conditions and component costs. Future work should also consider how the optimal configuration of a hybrid system might evolve based on different starting configurations (e.g., by starting with predetermined wind capacity instead of with predetermined PV capacity).
Data availability statement
The raw data supporting the conclusion of this article will be made available by the authors, without undue reservation.
Author contributions
AS conceptualized the goals of the analysis, designed the methodology, performed the modeling and analysis, created the visualizations, and wrote the bulk of the manuscript. DH-A conceptualized the complementarity analysis, provided feedback on results, and edited the manuscript. WC helped formulate the goals of the analysis, provided supervision and feedback, wrote parts of the original manuscript, and edited the manuscript. CM helped formulate the goals of the analysis, provided supervision and feedback, wrote parts of the original manuscript, edited the manuscript, and acted as the principal investigator by acquiring funding and administering and managing the project. All authors contributed to the article and approved the submitted version.
Funding
The author(s) declare financial support was received for the research, authorship, and/or publication of this article. This work was authored by the National Renewable Energy Laboratory, operated by Alliance for Sustainable Energy, LLC, for the U.S. Department of Energy (DOE) under Contract No. DE-AC36–08GO28308. Funding provided by the U.S. Department of Energy Office of Energy Efficiency and Renewable Energy, including the Solar Energy Technologies Office, the Wind Energy Technologies Office, and the Strategic Analysis Office. The views expressed in the article do not necessarily represent the views of the DOE or the U.S. Government. The U.S. Government retains and the publisher, by accepting the article for publication, acknowledges that the U.S. Government retains a nonexclusive, paid-up, irrevocable, worldwide license to publish or reproduce the published form of this work, or allow others to do so, for U.S. Government purposes.
Conflict of interest
The authors declare that the research was conducted in the absence of any commercial or financial relationships that could be construed as a potential conflict of interest.
Publisher’s note
All claims expressed in this article are solely those of the authors and do not necessarily represent those of their affiliated organizations, or those of the publisher, the editors and the reviewers. Any product that may be evaluated in this article, or claim that may be made by its manufacturer, is not guaranteed or endorsed by the publisher.
Supplementary material
The Supplementary Material for this article can be found online at: https://www.frontiersin.org/articles/10.3389/fenrg.2023.1036183/full#supplementary-material
References
Annual technology baseline, 2020 Annual technology baseline. Natl Renew Energy Lab. Available at: https://atb.nrel.gov/ (Accessed September 16, 2020).
Akhil, A. A., Huff, G., Currier, A. B., Hernandez, J., Bender, D. A., Kaun, B. C., et al. (2016). DOE/EPRI electricity storage handbook in collaboration with NRECA. Albuquerque, NM: Sandia National Laboratories.
Al-falahi, M. D. A., Jayasinghe, S. D. G., and Enshaei, H. (2017). A review on recent size optimization methodologies for standalone solar and wind hybrid renewable energy system. Energy Convers. Manag. 143, 252–274. doi:10.1016/j.enconman.2017.04.019
Arteaga, J., Zareipour, H., and Amjady, N. (2021). Energy storage as a service: optimal sizing for transmission congestion relief. Appl. Energy 298, 117095. doi:10.1016/j.apenergy.2021.117095
Balducci, P. J., Alam, M. J. E., Hardy, T. D., and Wu, D. (2018). Assigning value to energy storage systems at multiple points in an electrical grid. Energy Environ. Sci. 11, 1926–1944. doi:10.1039/C8EE00569A
Barker, A., Bhaskar, P., Anderson, B., and Eberle, A. (2021). Potential infrastructure cost savings at hybrid wind plus solar PV plants. Golden, CO: National Renewable Energy Laboratory.
Blair, N., Augustine, C., Cole, W., Denholm, P., Frazier, W., Geocaris, M., et al. (2022). Storage futures study: Key learnings for the coming decades. Golden, CO: National Renewable Energy Laboratory.
Bloom, A., Novacheck, J., Brinkman, G., McCalley, J., Figueroa-Acevedo, A., Jahanbani-Ardakani, A., et al. (2022). The value of increased HVDC capacity between eastern and western U.S. Grids: the interconnections seam study. IEEE Trans. Power Syst. 37, 1760–1769. doi:10.1109/TPWRS.2021.3115092
Bolinger, M., Gorman, W., Rand, J., Jeong, S., Wiser, R. H., Seel, J., et al. (2022). Hybrid power plants: Status of operating and proposed plant. Berkeley, CA: Lawrence Berkeley National Laboratory.
Brown, M., Cole, W., Eurek, K., Becker, J., Bielen, D., Chernyakhovskiy, I., et al. (2020). Regional energy deployment system (ReEDS) model documentation: Version 2019. Golden, CO: National Renewable Energy Laboratory.
Cantor, D., Mesa, O., and Ochoa, A. (2022b). Complementarity beyond correlation. Complement. Var, Renew. Energy sources. Elsevier, 121–141. doi:10.1016/B978-0-323-85527-3.00003-0
Cantor, D., Ochoa, A., and Mesa, O. (2022a). Total variation-based metrics for assessing complementarity in energy resources time series. Sustainability 14, 8514. doi:10.3390/su14148514
Clark, C. E., Barker, A., King, J., and Reilly, J. (2022). Wind and solar hybrid power plants for energy resilience. Golden, CO: National Renewable Energy Laboratory.
Coker, P., Barlow, J., Cockerill, T., and Shipworth, D. (2013). Measuring significant variability characteristics: an assessment of three UK renewables. Renew. Energy 53, 111–120. doi:10.1016/j.renene.2012.11.013
Cole, W., Corcoran, S., Gates, N., Mai, T., and Das, P. (2020). Standard Scenarios report: A U.S. Electricity sector outlook. Golden, CO: National Renewable Energy Laboratory.
Cole, W., Frazier, A. W., and Augustine, C. (2021). Cost projections for utility-scale battery storage: 2021 update. Golden, CO: National Renewable Energy Laboratory.
Cox, J. L., Hamilton, W. T., and Newman, A. M. (2023). Parametric analysis on optimized design of hybrid solar power plants. Sol. Energy 252, 195–217. doi:10.1016/j.solener.2023.01.016
Cutter, E., Haley, B., Hargreaves, J., and Williams, J. (2014). Utility scale energy storage and the need for flexible capacity metrics. Appl. Energy 124, 274–282. doi:10.1016/j.apenergy.2014.03.011
de Sisternes, F. J., Jenkins, J. D., and Botterud, A. (2016). The value of energy storage in decarbonizing the electricity sector. Appl. Energy 175, 368–379. doi:10.1016/j.apenergy.2016.05.014
Denholm, P., Arent, D. J., Baldwin, S. F., Bilello, D. E., Brinkman, G. L., Cochran, J. M., et al. (2021a). The challenges of achieving a 100% renewable electricity system in the United States. Joule 5, 1331–1352. doi:10.1016/j.joule.2021.03.028
Denholm, P., Cole, W., Frazier, A., Podkaminer, K., and Blair, N. (2021b). Storage futures study: The four phases of storage deployment: A framework for the expanding role of storage in the U.S. Power system. Golden, CO: National Renewable Energy Laboratory. doi:10.2172/1763974
Denholm, P., Eichman, J., and Margolis, R. (2017). Evaluating the technical and economic performance of PV plus storage power plants. Golden, CO: National Renewable Energy Laboratory.
Denholm, P., Nunemaker, J., Gagnon, P., and Cole, W. (2020). The potential for battery energy storage to provide peaking capacity in the United States. Renew. Energy 151, 1269–1277. doi:10.1016/j.renene.2019.11.117
Denholm, P. L., Sun, Y., and Mai, T. T. (2019). An introduction to grid services: Concepts, technical requirements, and provision from wind. Golden, CO: National Renewable Energy Laboratory. doi:10.2172/1493402
DiOrio, N., Denholm, P., and Hobbs, W. B. (2020). A model for evaluating the configuration and dispatch of PV plus battery power plants. Appl. Energy 262, 114465. doi:10.1016/j.apenergy.2019.114465
Few, S., Schmidt, O., Offer, G. J., Brandon, N., Nelson, J., and Gambhir, A. (2018). Prospective improvements in cost and cycle life of off-grid lithium-ion battery packs: an analysis informed by expert elicitations. Energy Policy 114, 578–590. doi:10.1016/j.enpol.2017.12.033
Flaccus, G. (2022). Tiny Oregon town hosts 1st wind-solar-battery ‘hybrid’ plant. China, Assoc Press. Available at: https://apnews.com/article/oregon-portland-wind-power-north-america-b3a243b5484b9c4ba83d399ac59fe42b.
Frazier, A. W., Cole, W., Denholm, P., Greer, D., and Gagnon, P. (2020). Assessing the potential of battery storage as a peaking capacity resource in the United States. Appl. Energy 275, 115385. doi:10.1016/j.apenergy.2020.115385
Frew, B., Cole, W., Sun, Y., Richards, J., and Mai, T. (2017). 8760-Based method for representing variable generation capacity value in capacity expansion models. College Park, MD: Preprint.
Graça Gomes, J., Jiang, J., Chong, C. T., Telhada, J., Zhang, X., Sammarchi, S., et al. (2023). Hybrid solar PV-wind-battery system bidding optimisation: A case study for the iberian and Italian liberalised electricity markets. Energy 263, 126043. doi:10.1016/j.energy.2022.126043
Gagnon, P., Brown, M., Steinberg, D., Brown, P., Awara, S., Carag, V., et al. (2022). Standard Scenarios report: A U.S. Electricity sector outlook. Golden, CO: National Renewable Energy Laboratory.
Gagnon, P., Cowiestoll, B., and Schwarz, M. (2023). Cambium 2022 scenario descriptions and documentation. Golden, CO: National Renewable Energy Laboratory.
Goggin, M., Gramlich, R., Shparber, S., and Silverstein, A. (2018). Customer focused and clean: Power markets for the future. Washington, D.C.: Grid Strategies, LLC.
Göransson, L., and Johnsson, F. (2018). A comparison of variation management strategies for wind power integration in different electricity system contexts. Wind Energy 21, 837–854. doi:10.1002/we.2198
Gorman, W., Montañés, C. C., Mills, A., Kim, J. H., Millstein, D., and Wiser, R. (2022). Are coupled renewable-battery power plants more valuable than independently sited installations? Energy Econ. 107, 105832. doi:10.1016/j.eneco.2022.105832
Gorski, T. (2018). Towards enterprise architecture for capital Group in energy sector, Ieee 22nd int. Conf. Intell. Eng. Syst. INES, las palmas de Gran canaria. Germany, IEEE, 000239–000244. doi:10.1109/INES.2018.8523941
Goteti, N. S., Hittinger, E., Sergi, B., and Lima Azevedo, I. (2021). How does new energy storage affect the operation and revenue of existing generation? Appl. Energy 285, 116383. doi:10.1016/j.apenergy.2020.116383
Harrison-Atlas, D., Murphy, C., Schleifer, A., and Grue, N. (2022). Temporal complementarity and value of wind-PV hybrid systems across the United States. Renew. Energy 201, 111–123. doi:10.1016/j.renene.2022.10.060
Harrison-Atlas, D., Murphy, C., Schleifer, A., and Grue, N. (2022). Temporal complementarity and value of wind-PV hybrid systems across the United States. Renew. Energy Forthcom. 201, 111–123. doi:10.1016/j.renene.2022.10.060
Hemmati, R., Mehrjerdi, H., Shafie-khah, M., Siano, P., and Catalao, J. P. S. (2021). Managing multitype capacity resources for frequency regulation in unit commitment integrated with large wind ramping. IEEE Trans. Sustain Energy 12, 705–714. doi:10.1109/TSTE.2020.3017231
Ho, J., Becker, J., Brown, M., Brown, P., Chernyakhovskiy, I., Cohen, S., et al. (2021). Regional energy deployment system (ReEDS) model documentation: Version 2020. Golden, CO: National Renewable Energy Laboratory.
Hoicka, C. E., and Rowlands, I. H. (2011). Solar and wind resource complementarity: advancing options for renewable electricity integration in ontario, Canada. Renew. Energy 36, 97–107. doi:10.1016/j.renene.2010.06.004
Huber, M., Dimkova, D., and Hamacher, T. (2014). Integration of wind and solar power in europe: assessment of flexibility requirements. Energy 69, 236–246. doi:10.1016/j.energy.2014.02.109
Ikechi Emmanuel, M., and Denholm, P. (2022). A market feedback framework for improved estimates of the arbitrage value of energy storage using price-taker models. Appl. Energy 310, 118250. doi:10.1016/j.apenergy.2021.118250
The inflation reduction act Drives significant emissions reductions and positions America to reach our climate goals. Washington, DC: U.S. DOE Office of Policy; 2022.
Jerez, S., Trigo, R. M., Sarsa, A., Lorente-Plazas, R., Pozo-Vázquez, D., and Montávez, J. P. (2013). Spatio-temporal complementarity between solar and wind power in the iberian peninsula. Energy Procedia 40, 48–57. doi:10.1016/j.egypro.2013.08.007
St. John, J. (2022). The US has more clean energy projects planned than the grid can handle. USA, Canary Media. Available at: https://www.canarymedia.com/articles/transmission/the-us-has-more-clean-energy-projects-planned-than-the-grid-can-handle.
Johnson, S. C., Papageorgiou, D. J., Harper, M. R., Rhodes, J. D., Hanson, K., and Webber, M. E. (2021). The economic and reliability impacts of grid-scale storage in a high penetration renewable energy system. Adv. Appl. Energy 3, 100052. doi:10.1016/j.adapen.2021.100052
Johnson, S. C., Rhodes, J. D., and Webber, M. E. (2020). Understanding the impact of non-synchronous wind and solar generation on grid stability and identifying mitigation pathways. Appl. Energy 262, 114492. doi:10.1016/j.apenergy.2020.114492
Jorgenson, J., Denholm, P., and Mai, T. (2018). Analyzing storage for wind integration in a transmission-constrained power system. Appl. Energy 228, 122–129. doi:10.1016/j.apenergy.2018.06.046
Jurasz, J., Beluco, A., and Canales, F. A. (2018). The impact of complementarity on power supply reliability of small scale hybrid energy systems. Energy 161, 737–743. doi:10.1016/j.energy.2018.07.182
Jurasz, J., Canales, F. A., Kies, A., Guezgouz, M., and Beluco, A. (2020). A review on the complementarity of renewable energy sources: concept, metrics, application and future research directions. Sol. Energy 195, 703–724. doi:10.1016/j.solener.2019.11.087
Jurasz, J., and Ciapała, B. (2017). Integrating photovoltaics into energy systems by using a run-off-river power plant with pondage to smooth energy exchange with the power gird. Appl. Energy 198, 21–35. doi:10.1016/j.apenergy.2017.04.042
Kargarian, A., Hug, G., and Mohammadi, J. (2016). A multi-time scale Co-optimization method for sizing of energy storage and fast-ramping generation. IEEE Trans. Sustain Energy 7, 1351–1361. doi:10.1109/TSTE.2016.2541685
Khan, F. A., Pal, N., and Saeed, SyedH. (2018). Review of solar photovoltaic and wind hybrid energy systems for sizing strategies optimization techniques and cost analysis methodologies. Renew. Sustain Energy Rev. 92, 937–947. doi:10.1016/j.rser.2018.04.107
Knezović, K., Marinakis, A., Evrenosoglu, C. Y., and Oudalov, A. (2021). Role of grid and bulk storage in the integration of variable renewable energy resources: framework for optimal operation-driven multi-period infrastructure planning. Energy 226, 120378. doi:10.1016/j.energy.2021.120378
Kougias, I., Szabó, S., Monforti-Ferrario, F., Huld, T., and Bódis, K. (2016). A methodology for optimization of the complementarity between small-hydropower plants and solar PV systems. Renew. Energy 87, 1023–1030. doi:10.1016/j.renene.2015.09.073
Li, R., Jin, X., Yang, P., Sun, X., Zhu, G., Zheng, Y., et al. (2023). Techno-economic analysis of a wind-photovoltaic-electrolysis-battery hybrid energy system for power and hydrogen generation. Energy Convers. Manag. 281, 116854. doi:10.1016/j.enconman.2023.116854
López Prol, J., Steininger, K. W., and Zilberman, D. (2020). The cannibalization effect of wind and solar in the California wholesale electricity market. Energy Econ. 85, 104552. doi:10.1016/j.eneco.2019.104552
Maclaurin, G., Grue, N., Lopez, A., Heimiller, D., Rossol, M., Buster, G., et al. (2019). The renewable energy potential (reV) model: A geospatial platform for technical potential and supply curve modeling. Golden, CO: National Renewable Energy Laboratory.
Mahesh, A., and Sandhu, K. S. (2015). Hybrid wind/photovoltaic energy system developments: critical review and findings. Renew. Sustain Energy Rev. 52, 1135–1147. doi:10.1016/j.rser.2015.08.008
Mai, T. T., Jadun, P., Logan, J. S., McMillan, C. A., Muratori, M., Steinberg, D. C., et al. (2018). Electrification futures study: Scenarios of electric technology adoption and power consumption for the United States. Golden, CO: National Renewable Energy Laboratory. doi:10.2172/1459351
Mallapragada, D. S., Sepulveda, N. A., and Jenkins, J. D. (2020). Long-run system value of battery energy storage in future grids with increasing wind and solar generation. Appl. Energy 275, 115390. doi:10.1016/j.apenergy.2020.115390
Marocco, P., Novo, R., Lanzini, A., Mattiazzo, G., and Santarelli, M. (2023). Towards 100% renewable energy systems: the role of hydrogen and batteries. J. Energy Storage 57, 106306. doi:10.1016/j.est.2022.106306
Martinek, J., Jorgenson, J., Mehos, M., and Denholm, P. (2018). A comparison of price-taker and production cost models for determining system value, revenue, and scheduling of concentrating solar power plants. Appl. Energy 231, 854–865. doi:10.1016/j.apenergy.2018.09.136
Mills, A. D., and Rodriguez, P. (2020). A simple and fast algorithm for estimating the capacity credit of solar and storage. Energy 210, 118587. doi:10.1016/j.energy.2020.118587
Montañés, C. C., Gorman, W., Mills, A. D., and Kim, J. H. (2022a). Keep it short: exploring the impacts of configuration choices on the recent economics of solar-plus-battery and wind-plus-battery hybrid energy plants. J. Energy Storage 50, 104649. doi:10.1016/j.est.2022.104649
Murphy, C. A., Schleifer, A., and Eurek, K. (2021). A taxonomy of systems that combine utility-scale renewable energy and energy storage technologies. Renew. Sustain Energy Rev. 139, 110711. doi:10.1016/j.rser.2021.110711
Nandi, S. K., and Ghosh, H. R. (2009). A wind–PV-battery hybrid power system at Sitakunda in Bangladesh. Energy Policy 37, 3659–3664. doi:10.1016/j.enpol.2009.04.039
Nikolakakis, T., and Fthenakis, V. (2011). The optimum mix of electricity from wind- and solar-sources in conventional power systems: evaluating the case for New York state. Energy Policy 39, 6972–6980. doi:10.1016/j.enpol.2011.05.052
O’Dwyer, C., and Flynn, D. (2015). Using energy storage to manage high net load variability at sub-hourly time-scales. IEEE Trans. Power Syst. 30, 2139–2148. doi:10.1109/TPWRS.2014.2356232
Paterakis, N. G., Erdinç, O., and Catalão, J. P. S. (2017). An overview of demand response: key-elements and international experience. Renew. Sustain Energy Rev. 69, 871–891. doi:10.1016/j.rser.2016.11.167
Pearre, N. S., and Swan, L. G. (2015). Technoeconomic feasibility of grid storage: mapping electrical services and energy storage technologies. Appl. Energy 137, 501–510. doi:10.1016/j.apenergy.2014.04.050
Perez, M., Perez, R., Rábago, K. R., and Putnam, M. (2019). Overbuilding & curtailment: the cost-effective enablers of firm PV generation. Sol. Energy 180, 412–422. doi:10.1016/j.solener.2018.12.074
Prasad, A. A., Taylor, R. A., and Kay, M. (2017). Assessment of solar and wind resource synergy in Australia. Appl. Energy 190, 354–367. doi:10.1016/j.apenergy.2016.12.135
Prasad, A. A., Yang, Y., Kay, M., Menictas, C., and Bremner, S. (2021). Synergy of solar photovoltaics-wind-battery systems in Australia. Renew. Sustain Energy Rev. 152, 111693. doi:10.1016/j.rser.2021.111693
Ramasamy, V., Feldman, D., Desai, J., and Margolis, R. U. S. (2021). Solar photovoltaic system and energy storage cost benchmarks: Q1 2021. Golden, CO: National Renewable Energy Laboratory.
Ren, G., Wang, W., Wan, J., Hong, F., and Yang, K. (2023). A novel metric for assessing wind and solar power complementarity based on three different fluctuation states and corresponding fluctuation amplitudes. Energy Convers. Manag. 278, 116721. doi:10.1016/j.enconman.2023.116721
reV (2022). reV: the renewable energy potential model. Available at: https://www.nrel.gov/gis/renewable-energy-potential.html.
Santos-Alamillos, F. J., Pozo-Vázquez, D., Ruiz-Arias, J. A., Lara-Fanego, V., and Tovar-Pescador, J. (2012). Analysis of spatiotemporal balancing between wind and solar energy resources in the southern iberian peninsula. J. Appl. Meteorol. Climatol. 51, 2005–2024. doi:10.1175/JAMC-D-11-0189.1
Santos-Alamillos, F. J., Pozo-Vázquez, D., Ruiz-Arias, J. A., Von Bremen, L., and Tovar-Pescador, J. (2015). Combining wind farms with concentrating solar plants to provide stable renewable power. Renew. Energy 76, 539–550. doi:10.1016/j.renene.2014.11.055
Sawle, Y., Gupta, S. C., and Kumar Bohre, A. (2016). PV-Wind hybrid system: A review with case study. Cogent Eng. 3, 1189305. doi:10.1080/23311916.2016.1189305
Schleifer, A. H., Murphy, C. A., Cole, W. J., and Denholm, P. L. (2021). The evolving energy and capacity values of utility-scale PV-plus-battery hybrid system architectures. Adv. Appl. Energy 2, 100015. doi:10.1016/j.adapen.2021.100015
Schleifer, A. H., Murphy, C. A., Cole, W. J., and Denholm, P. (2022). Exploring the design space of PV-plus-battery system configurations under evolving grid conditions. Appl. Energy 308, 118339. doi:10.1016/j.apenergy.2021.118339
Seel, J., Gorman, W., Barbose, G. L., Bolinger, M., Montañés, C. C., Forrester, S., et al. (2022). Batteries included: Top 10 findings from berkeley lab research on the growth of hybrid power plants in the United States. Berkeley, CA: Lawrence Berkeley National Laboratory.
Seel, J., Mills, A. D., and Wiser, R. H. (2018). Impacts of high variable renewable energy futures on wholesale electricity prices, and on electric-sector decision making. Berkeley, CA: Lawrence Berkeley National Laboratory.
Shahmohammadi, A., Sioshansi, R., Conejo, A. J., and Afsharnia, S. (2018). The role of energy storage in mitigating ramping inefficiencies caused by variable renewable generation. Energy Convers. Manag. 162, 307–320. doi:10.1016/j.enconman.2017.12.054
Slusarewicz, J. H., and Cohan, D. S. (2018). Assessing solar and wind complementarity in Texas. Renew. Wind Water Sol. 5, 7. doi:10.1186/s40807-018-0054-3
Smith, K., Saxon, A., Keyser, M., Lundstrom, B., Cao, Ziwei, and Roc, A. (2017). Life prediction model for grid-connected Li-ion battery energy storage system, 2017. Seattle, WA, USA: Am. Control Conf. ACC, 4062–4068. doi:10.23919/ACC.2017.7963578
Sobri, S., Koohi-Kamali, S., and Nabd, Rahim (2018). Solar photovoltaic generation forecasting methods: A review. Energy Convers. Manag. 156, 459–497. doi:10.1016/j.enconman.2017.11.019
Solar Futures Study (2021).Department of Energy Office of Energy Efficiency and Renewable Energy.Washington, DC: IEEE,
Solomon, A. A., Faiman, D., and Meron, G. (2010). Grid matching of large-scale wind energy conversion systems, alone and in tandem with large-scale photovoltaic systems: an Israeli case study. Energy Policy 38, 7070–7081. doi:10.1016/j.enpol.2010.07.026
Solomon, A. A., Kammen, D. M., and Callaway, D. (2016). Investigating the impact of wind–solar complementarities on energy storage requirement and the corresponding supply reliability criteria. Appl. Energy 168, 130–145. doi:10.1016/j.apenergy.2016.01.070
Stenclik, D., Goggin, M., Ela, E., and Ahlstrom, M. (2022). Unlocking the flexibility of hybrid resources: A report of the energy systems integration group’s hybrid resources task force. Reston, VA: Energy Systems Integration Group.
Sterl, S., Liersch, S., Koch, H., Lipzig, N. P. M. van, and Thiery, W. (2018). A new approach for assessing synergies of solar and wind power: implications for west africa. Environ. Res. Lett. 13, 094009. doi:10.1088/1748-9326/aad8f6
Thomaidis, N. S., Santos-Alamillos, F. J., Pozo-Vázquez, D., and Usaola-García, J. (2016). Optimal management of wind and solar energy resources. Comput. Oper. Res. 66, 284–291. doi:10.1016/j.cor.2015.02.016
U.S. Energy Information Administration (2022). Annual energy outlook 2022 2022. Available at: https://www.eia.gov/outlooks/aeo/.
Uslar, M., Rohjans, S., Neureiter, C., Pröstl Andrén, F., Velasquez, J., Steinbrink, C., et al. (2019). Applying the smart grid architecture model for designing and validating system-of-systems in the power and energy domain: A European perspective. Energies 12, 258. doi:10.3390/en12020258
Vander Vorst, A., and Stern, A. (2022). Plugging in: A roadmap for modernizing & integrating interconnection and transmission planning. China, Enel Green Power.
Verástegui, F., Lorca, Á., Olivares, D., and Negrete-Pincetic, M. (2021). Optimization-based analysis of decarbonization pathways and flexibility requirements in highly renewable power systems. Energy 234, 121242. doi:10.1016/j.energy.2021.121242
Vick, B. D., and Moss, T. A. (2013). Adding concentrated solar power plants to wind farms to achieve a good utility electrical load match. Sol. Energy 92, 298–312. doi:10.1016/j.solener.2013.03.007
Wang, Q., and Hodge, B-M. (2017). Enhancing power system operational flexibility with flexible ramping products: A review. IEEE Trans. Ind. Inf. 13, 1652–1664. doi:10.1109/TII.2016.2637879
Wang, S., Geng, G., and Jiang, Q. (2019). Robust Co-planning of energy storage and transmission line with mixed integer recourse. IEEE Trans. Power Syst. 34, 4728–4738. doi:10.1109/TPWRS.2019.2914276
Weitemeyer, S., Kleinhans, D., Vogt, T., and Agert, C. (2015). Integration of renewable energy sources in future power systems: the role of storage. Renew. Energy 75, 14–20. doi:10.1016/j.renene.2014.09.028
West, A., and Rosewater, D. (2022). Energy storage gas peaker replacement: optimal sizing and environmental benefits. Austin, TX, USA: IEEE, IEEE Electr. Energy Storage Appl. Technol. Conf. EESAT, 1–5. doi:10.1109/EESAT55007.2022.9998045
Widen, J. (2011). Correlations between large-scale solar and wind power in a future scenario for Sweden. IEEE Trans. Sustain Energy 2, 177–184. doi:10.1109/TSTE.2010.2101620
Wu, J., Zhou, M., Xu, M., Zhang, J., Guo, Y., Zhang, Y., et al. (2021). “Research and design of a digital twin-based enterprise architecture digital control platform for provincial electrical power company,” in Int. Conf. Control robot. Cybern. CRC (Shanghai, China: IEEE), 186–191. doi:10.1109/CRC52766.2021.9620120
Yang, X., Chai, G., Liu, X., Xu, M., and Guo, Q. (2021). Storage-transmission joint planning method to deal with insufficient flexibility and transmission congestion. Front. Energy Res. 8, 612909. doi:10.3389/fenrg.2020.612909
Keywords: hybrid renewable energy system, utility-scale electricity generation, solar photovoltaics, wind energy, battery energy storage, bulk power system, price-taker optimization
Citation: Schleifer AH, Harrison-Atlas D, Cole WJ and Murphy CA (2023) Hybrid renewable energy systems: the value of storage as a function of PV-wind variability. Front. Energy Res. 11:1036183. doi: 10.3389/fenrg.2023.1036183
Received: 04 September 2022; Accepted: 05 September 2023;
Published: 19 September 2023.
Edited by:
Ellen B. Stechel, Arizona State University, United StatesReviewed by:
Helena Martín, Universitat Politecnica de Catalunya, SpainTomasz Górski, University of Gdansk, Poland
Copyright © 2023 Schleifer, Harrison-Atlas, Cole and Murphy. This is an open-access article distributed under the terms of the Creative Commons Attribution License (CC BY). The use, distribution or reproduction in other forums is permitted, provided the original author(s) and the copyright owner(s) are credited and that the original publication in this journal is cited, in accordance with accepted academic practice. No use, distribution or reproduction is permitted which does not comply with these terms.
*Correspondence: Anna H. Schleifer, YW5uYS5zY2hsZWlmZXJAbnJlbC5nb3Y=