 Arijit Ganguli
 Viraj Bhatt
- School of Engineering and Applied Science, Ahmedabad University, Ahmedabad, India
The bed dynamics of unary and binary fluidized beds play a key role in understanding the pressure drop and hence provides an opportunity for performance improvement of the beds. In the present work, characteristics of fluidized beds with binary mixtures of Geldart-B particles were investigated using CFD simulations. The phenomena of segregation and mixing using simulations were studied, both qualitatively and quantitatively, at a range of superficial gas velocities (0.3–0.6 m/s) and two different bed heights. The study was divided into two parts. In Part I, the current study, a qualitative analysis of flow patterns for seven different binary mixtures, is presented. The quantitative analysis, including particle and gas velocity profiles, particle volume fraction profiles, and correlations for minimum fluidization velocity and pressure drop, will be presented in Part II of this work. A mathematical model consisting of an Eulerian-Eulerian model with RNG k-ε model and KTGF model to capture the bubble dynamics was used. The standardized values of coefficients and plastic stresses have been used for all simulations. The CFD model was validated using experimental data from the literature. Qualitative predictions of volume fraction profiles of small-sized particles showed that, for mixtures within a range of 40%–60% Geldart-B type large particles, the bubble and solid particle dynamics were different from those of single particles of the superficial gas velocities considered. In contrast to the single particles in the given superficial gas velocity range that were in bubbling regime, the binary particles showed a transition from bubbling to slugging to turbulent regime, as demonstrated by qualitative analysis. A homogeneous regime was observed for lower superficial gas velocities for mixtures consisting of 0%–20% large particles.
1 Introduction
Gas–solid (GS) fluidized beds have been important in various applications, such as drying (Yohana et al., 2020), granulation (Behzadi et al., 2009), blending, combustion, gasification (Roy et al., 2021), and conversion of methanol to olefins (Chang et al., 2019), for more than seven decades. One of the several advantages of fluidized beds over fixed beds is their ability to be operated isothermally, with minimal axial temperature gradients (Menéndez et al., 2019). Analytical models of fluidized beds are complex, involving dynamics and transport phenomena of two or more phases; for example, gas and solids/particles and bed phases such as bubble, cloud, and emulsion. The first pioneering work in analytical modeling of fluidized beds was carried out by Harris et al. (2002) and Yoshida et al. (1969), and involved taking mass balances. However, modeling the dynamics of fluidized beds poses a challenge due to particle size distribution (PSD), influence of geometric parameters, such as column diameter, height of bed to column diameter ratio, properties of gas and particles or mixture of particles, operating parameters such as superficial gas velocity on bed pressure drop, and minimum fluidization velocity. Due to the influence of the aforementioned parameters, the GS flow in a fluidized bed changes and encounters different regimes, namely homogeneous, bubbling, turbulent, fast fluidization, and pneumatic regimes (Bi and Grace, 1995; Lim et al., 1995; Bi, 2011). Geldart (1973) defined four particle size groups for bed expansion, known as Geldart-A, -B, -C, and -D. Based on these particle sizes, it can be determined whether the bed can be fluidized, how much the bed can be fluidized, and the type of fluidization. With the advent of the 21st century, researchers emphasized the need for studies on the hydrodynamics of Geldart-B-type particles and binary mixtures (Zhang et al., 2006). In fluidized beds with binary systems, the primary fraction that forms the top layer of the bed, or the one that floats, is called the flotsam and the one at the bottom layer, or the one that sinks, is called the jetsam. A major challenge in binary systems is that the beds reach equilibrium with either mixing or segregation of particles as two extremes. These dynamics are studied using advanced experimental techniques that include non-intrusive methods like tomography, radioactive particle tracking (RPT) (Roy et al., 2021), and intrusive techniques that include pressure probes for measuring pressure drops and quality of fluidization, and optical probes for measuring particle diameter, particle velocity, etc. Dynamics and transport phenomena in fluidized beds have also been studied both qualitatively and quantitatively using computational fluid dynamics (CFD) (mostly Eulerian–Eulerian approaches)/mathematical modeling (Cooper and Coronella, 2005; Du et al., 2006; Gao et al., 2009; Pei et al., 2010; Zaabout et al., 2010; Chang et al., 2012; Mostafazadeh et al., 2013; Benzarti et al., 2014; Sahoo and Sahoo, 2016; Bakshi et al., 2017; Agrawal et al., 2018; Chang et al., 2019; Daryus et al., 2019; Khezri et al., 2019; Shrestha et al., 2019; Kotoky et al., 2020).
In the current study, the experimental lab scale fluidized bed was operated in transition regime for a binary mixture. Hence, relevant literature works on bubbling, slugging, turbulent, and fast fluidizing regimes are summarized in Table 1. In this part of the work, numerical studies on qualitative analysis of the low patterns were elaborated, showing prominent experimental and numerical works highlighting the operating regimes, operating parameters, major findings, limitations/opportunities, geometrical details of equipment (diameter and height), and particle characteristics (size, shape, etc.).
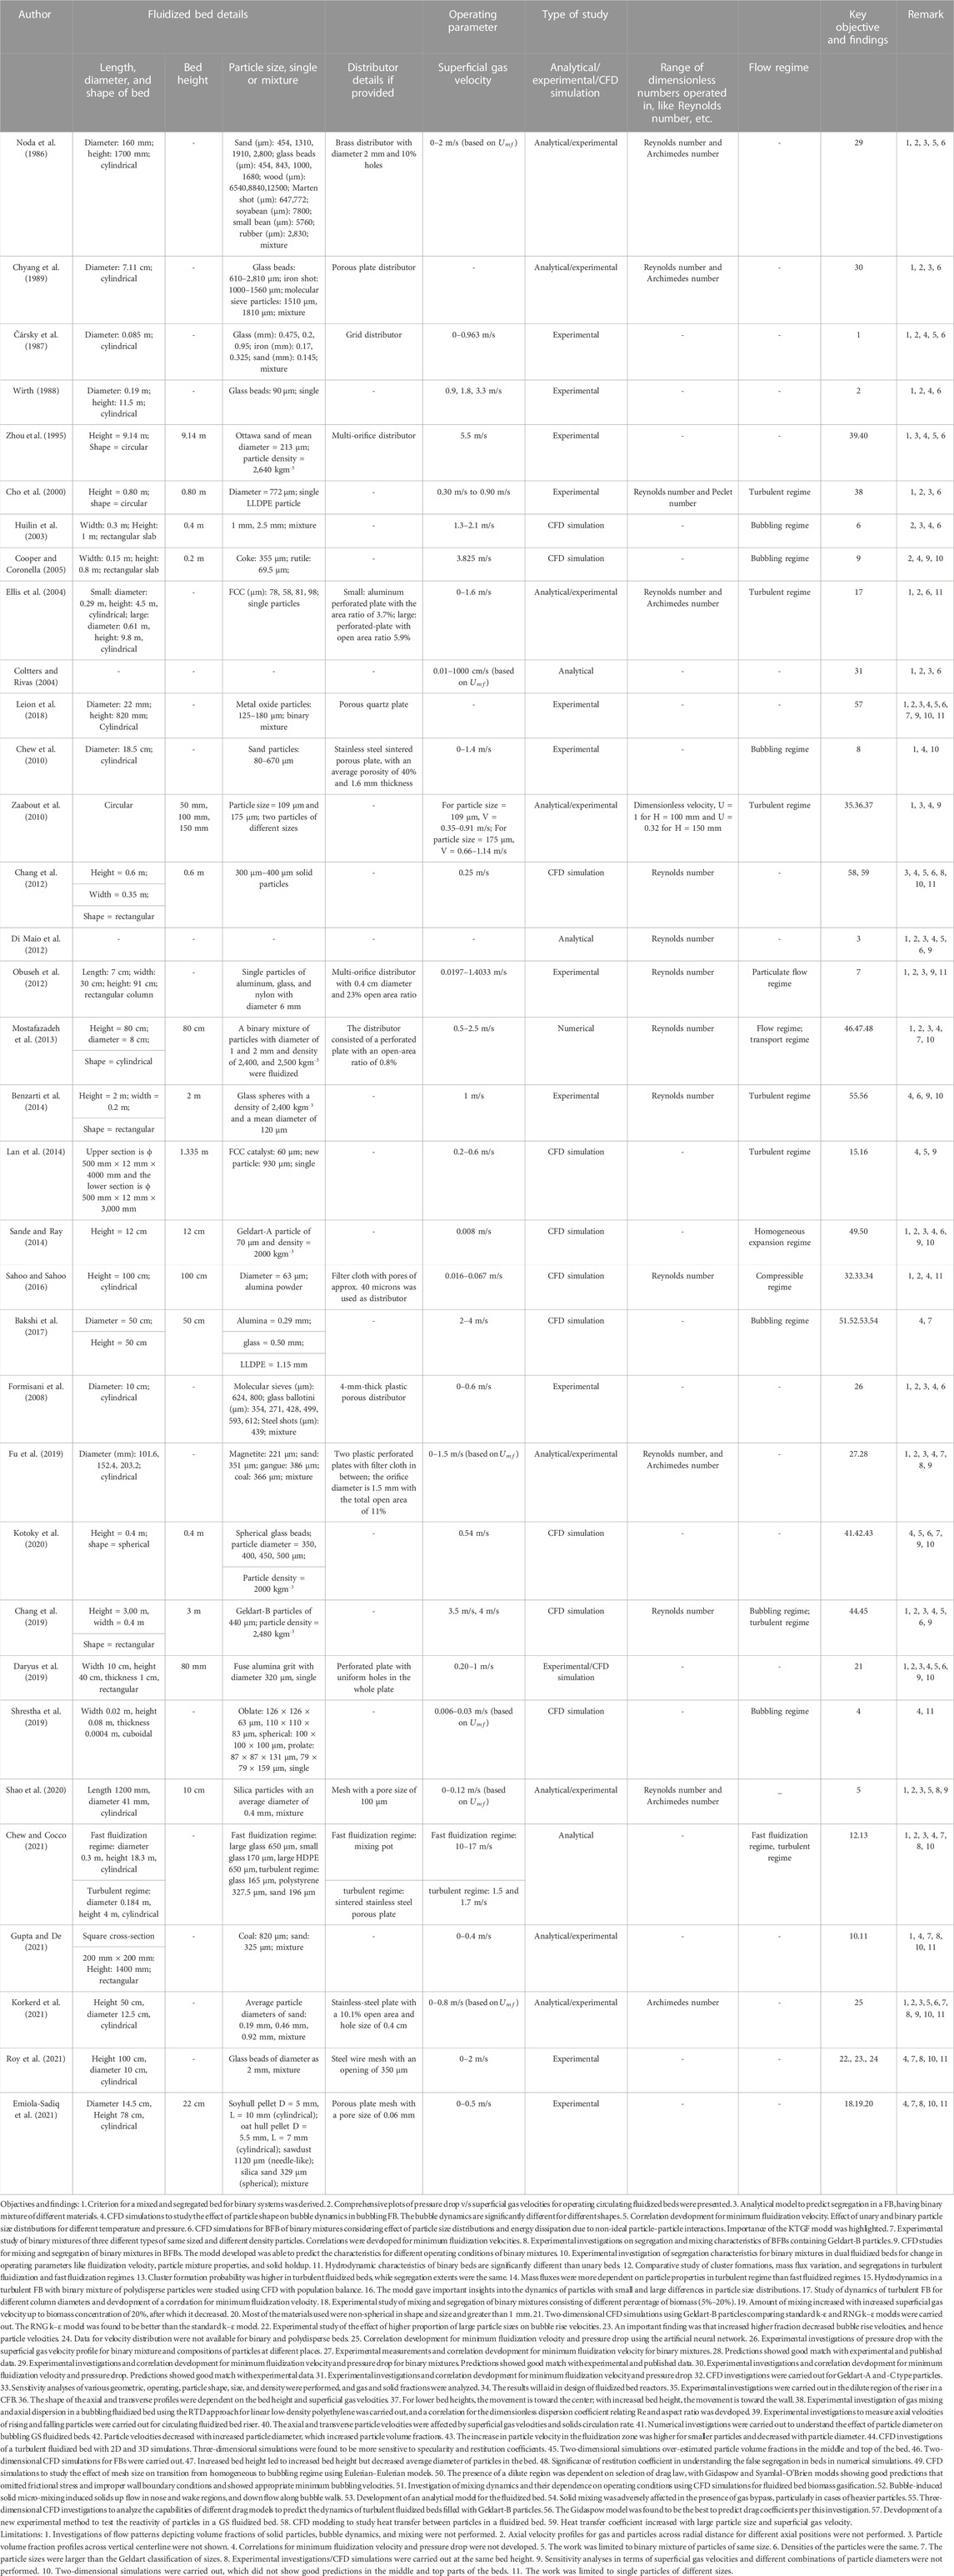
TABLE 1. Literature review.
1.1 Numerical and experimental studies on fluidized beds involving binary systems
The major challenges in CFD modeling of fluidized beds involve the modeling of solid–solid and solid–fluid interactions with the help of the kinetic theory of granular flow (KTGF) for Eulerian–Eulerian models. Furthermore, recent studies suggest that 3D models capture the dynamics better than 2D models. The numerical studies explained in this section focus on bubbling fluidized beds (BFBs) and turbulent fluidized beds (TFBs) operating with binary mixtures, along with a few studies on unary beds. The following is a discussion of numerical studies carried out over the last few decades, along with combined experimental and numerical studies.
Huilin et al. (2003) performed simulations with binary mixtures using a KTGF model and the Euler–Euler approach (a multifluid model). The authors investigated the segregation of GS fluidized beds for binary mixtures for a bed height of 0.4 m and column diameter of 0.3 m. Finer particles tended to go up in the bed, while larger particles settled at the bottom, at lower superficial gas velocities (
Additionally, Philippsen et al. (2015) investigated the effect of various drag models to be used in fluidization and found that the Syamlal–O’Brien model (Syamlal and O’Brien, 1987) was the best drag model through which to assess the dynamics of fluidized beds.
Daryus et al. (2019) compared two turbulence models, namely the standard k–ε and the RNG k–ε models to understand the effects of turbulence on CFD simulations of fluidized beds. The authors concluded that, while neither model could accurately predict the pressure drop for superficial gas velocities of less than minimum fluidization velocity (
Cooper and Coronella, (2005) carried out numerical simulations for a bubbling fluidized bed reactor in the titanium refining industry with rutile (small size and high-density) and coke (large size and low density) particles. Outcomes signifying the importance of numerical simulations and bed characteristics included: 1. prediction of accurate dynamic similarity in flow patterns using mixing and segregation during scaleup; 2. prediction of bubble wake formations directly below the gas bubble and dynamics of the wake below the bubbles as depicted in their solid volume fraction contours; 3. eruption of the bubbles causing deposition of solids at the bed surface; and 4. downward movement of those bubbles that did not travel in the bubble wake; 5. flotsam and jetsam had similar but distinct velocity trajectories; 6. a minor difference in apparent slip velocity of bubbles and its influence on bed dynamics over passage of both time and additional bubbles. The authors have substantiated the aforementioned outcomes for a wide range of particle sizes and superficial gas velocities.
Mazzei et al. (2010) carried out numerical simulations for a binary mixture of particles to understand two cases. Case 1: Investigation of minimum fluidization velocities at which the mixture no longer remains fixed, but starts segregating, and transient fluidization takes place; and Case 2: The mixture becomes steadily fluidized and fully mixed. The authors assessed the following: 1. numerical stability of models in fast segregating beds; 2. mutual effects of plastic viscosity and granular temperature; 3. the role played by plastic solid stress; and 4. selection of an appropriate time-step to ensure invariance of numerical results. The authors emphasized the role of plastic stress in the modeling of collapsing monodisperse fluidized beds. The authors found that, in the case of collapsing monodisperse fluidized beds, plastic stress and plastic solid viscosity are important, whereas plastic solid pressure can be ignored. The authors further used the standardized parameter to find the bed characteristics; for instance, the minimum fluidization velocity (
Jayarathna and Halvorsen, 2011 carried out both experimental and numerical investigations with different binary mixtures of glass particles and studied the pressure drop and volume fraction changes for lab scale fluidized beds. The authors conducted experiments for two different bed heights, each for a range of superficial gas velocities (
Mostafazadeh et al. (2013), with the help of their in-house code, carried out numerical investigations for mixtures of 1 mm and 2 mm particles with densities of 2,400 kgm-3 and 2,500 kgm-3, respectively, for a superficial gas velocity range of
Benzarti et al. (2014) examined the ability of the mathematical/CFD models to predict dynamics of TFBs filled with Geldart-B particles. The authors investigated the significance of drag coefficient models and restitution coefficient values on the prediction of dynamics of fluidized beds in CFD. The authors concluded that the restitution coefficient, which accounts for the inelasticity of the particle-particle collisions, needs to be considered, especially when the superficial gas velocity is less than the minimum fluidization velocity. The authors concluded that, for Geldart-B particles, the Gidaspow model (Huilin et al., 2003) gave the most reasonable results, both in terms of qualitative and quantitative predictions. Furthermore, with a specularity coefficient value of 1 and a restitution coefficient of 0.9, the model gave near accurate predictions. While analyzing the effect of superficial gas velocity (
Sande and Ray (2014) carried out numerical studies of transition from a homogeneous to bubbling regime for Geldart-A particles and concluded that the drag laws played an important role in the identification of the dilute region of fluidization. The authors, in their qualitative analysis using CFD, also found that inappropriate selection of wall boundary conditions and inclusion of frictional stress led to inappropriate predictions of minimum fluidization velocity. Such studies have not been carried out for Geldart-A, -B, -C, and -D particles. Both the Gidaspow (Huilin et al., 2003) and Syamlal–O’Brien models (Syamlal and O’Brien, 1987) gave good results for moderate superficial gas velocities (of approximately
Sahoo and Sahoo (2016) carried out CFD simulations for Geldart-C and -A fine particles (monodisperse particles) in a cylindrical fluidized column. The effect of parameters, such as static bed height, particle density, size of particle, and superficial velocity of fluidizing medium were studied and compared with experimental results. The bed expansion and pressure drop variation with increased superficial velocity of the gas was found to be similar to that of conventional fluidized beds. The authors were able to simulate and confirm that fluidization under normal conditions is a challenge for Geldart particles due to action of strong cohesive forces.
Bakshi et al. (2017) carried out CFD simulations to study the effects of solids mixing on thermal and concentration gradients, and on the performance of fluidized bed reactors. The authors found that the bubble-induced solids were responsible for the micro-mixing during the up flow of the solids. This included the wake region during the up flow of solids. Furthermore, the mixing of solids was affected by gas bypass or through flow, particularly during fluidization of heavier particles. The authors also investigated the dynamics of the motion of gas and solids, and their interaction, under specific operating conditions.
Chang et al. (2019) studied dynamics in fluidized beds with Geldart-B particles (binary systems) with 2D and 3D simulation approaches. An important aspect in Eulerian-Eulerian modeling is the restitution coefficient. Hence, analysis of sensitivity of the restitution coefficient was carried out and it was determined that a value of 0.9–1 for the restitution coefficient predicted realistic results for Geldart-B particles. Furthermore, the authors found that 2D simulations predicted the dynamics of the dense phase (bottom layer) well, whereas they over-estimated aspects of the dynamics of the middle and upper regions. The 2D simulations also over-estimated the bubble sizes and bed expansion, solid concentration, and solid velocities compared to experimental results. Hence, the authors suggested that 3D simulations should be carried out to obtain realistic results in studies of the dynamics of fluidized beds with Geldart-B particles.
Kotoky et al. (2020) carried out CFD simulations using an in-house code for Geldart-B particles to analyze the bed dynamics of unary fluidized bed reactors. The authors concluded that, with increased particle diameter, the particle velocity at any section in a fluidized zone decreased while the particle volume fraction increased, i.e., particle velocities were higher for smaller sized particles, especially in the dilute region of the bed, whereas velocities were lower for larger particle sizes. Hence, maximum value of time-averaged volume fractions was found for larger particles at the bottom of the reactor.
1.2 Discussion
From Section 1.1:
1. Turbulence models like the RNG k–ε model are better than the standard k–ε model for both unary and binary mixtures.
2. KTGF can capture bubble dynamics for bubbling beds, including bubble movement in the bed, bubble wake, and bubble eruption.
3. Roles of plastic solid stress, plastic viscosity, granular temperature, plastic solid pressure in unary/monodispersed beds using commercial software Ansys Fluent have been standardized and found to predict bed characteristics well via comparison with experimental measurements.
4. The standardized values of the restitution coefficient and specularity coefficient should be used in predicting correct bed characteristics using CFD models. The values reported in the literature are in the range of 0.9–1.
5. For predicting the suitable drag coefficient, the Gidaspow (Huilin et al., 2003) and Syamlal–O’Brien (Syamlal and O’Brien, 1987) models were found to be most appropriate when focusing on bed dynamics. However, if thermal and concentration gradients are coupled with bed dynamics, the Wen and Yu drag law provides better results.
1.3 Objective of the present work
In the present work, the flow patterns (both steady and transient) of binary mixture particles with the same densities were investigated using CFD simulations. Geldart-B particles were used at different operating conditions. For this purpose, geometry available in the current literature (Jayarathna and Halvorsen, 2011) was considered. The CFD model considers the standard values for different parameters, such as friction pressure, plastic viscosity, plastic pressure, specularity coefficient, and restitution coefficient, as reported in the literature, and the drag and other laws used in KTGF modeling. In future work, a sensitivity analysis will be carried out for different combinations wherever suitable. The model will then be validated with experimental data from the literature. In the case of good agreement, seven different binary mixtures will be taken, and simulations for three different superficial velocities, each for two different bed heights, will be carried out. The quantitative analysis will be carried out in Part II of the study and reported in a subsequent article.
The originality of this manuscript lies in: 1. the comprehensive combination of the particle size of binary mixtures and the operating parameters considered; 2. the CFD model that considered all the current best practices; and 3. investigation of whether unusual bed characteristics were present in any of the cases considered.
2 Mathematical modeling
2.1 Assumptions
1. No mass transfer between the phases is taking place in the system. 2. Two different solid phases of the same density, but containing particles of different sizes, are simultaneously interacting with each other and with the gas phase. 3. All the solid particles are spherical. 4. The gas fluid phase is a Newtonian fluid. 5. No other force or energy, other than gravity, is affecting the fluidized bed system in any manner.
2.2 Models
Different models were used for modeling the interaction between the solid phase and the gas phase. Table 2 shows the models used for quantities.
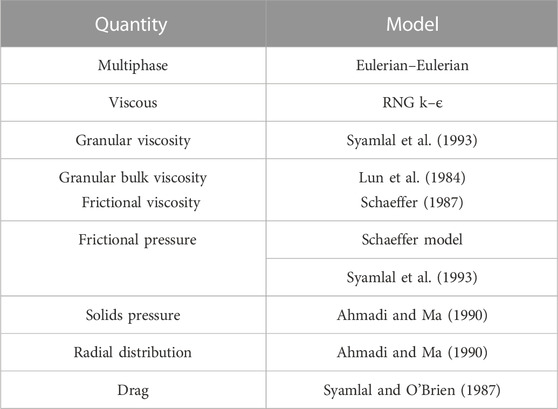
TABLE 2. Models used for different quantities.
2.3 Mathematical modeling with equations
The Eulerian model, or two-fluid model, considers each phase as a continuum, where the phases are interacting and interpenetrating in nature. The solid phase may be assumed to be a pseudo-fluid. For the given study, the Eulerian model is used for the modeling of the fluidized bed system.
2.3.1 Continuity equations
The continuity equation of a phase i is given by:
where
In the system, there are three phases interacting with each other. They are given by: 1. g representing the fluid gas phase; 2. s1 representing solid phase with smaller particle size; and 3. s2 representing solid phase with larger particle size.
2.3.2 Momentum equations
The momentum equation for the gas fluid phase is given as:
where
The stress tensor of the gas phase is given by:
where
The solid phase momentum equation is given by:
where
The total solid phase tensor is given by:
where
The solid phase granular viscosity given by Syamlal and O’Brien (1987) is:
where
The collisional viscosity is given as:
where
The kinetic viscosity is given by:
The total solid phase pressure is given by the Ma-Ahmadi model (Ahmadi and Ma, 1990) as:
The granular bulk phase viscosity is given by the mathematical model of Lun et al. (1984), as shown:
The total coefficient of restitution is given as:
where
The radial distribution function is given by the Ma-Ahmadi model (Ahmadi and Ma, 1990):
where
The granular temperature is calculated using the algebraic model:
where
2.3.3 Turbulence governing equations
The turbulence-based modeling of the system was carried out using the Renormalization Group RNG k–ϵ model for turbulent viscosity, since the previous sensitivity analysis provided good results. The model equations are similar to the standard k–ϵ model, with the constant
where
In calculation of the aforementioned quantities,
The values of the constants are as follows:
2.3.4 Kinetic energy equations
KTGF is used for kinetic based modeling of the fluidized bed system and is the extended version of the kinetic theory of gases. The model assumes unequal granular temperature for different phases and uses collisions as a potential source of energy transfer and a variable affecting the granular temperature. The model equation for granular temperature of a solid phase is as follows:
where
The collisional heat flux is given by:
where
The collisional pressure given by Gidaspow and Huilin (1996) is:
where
The equation constant
The average particle size of two solid phases is given by:
where
The combined mass for two solid phases is defined as:
The single particle mass is calculated as:
The total number of particles is defined as:
The turbulent kinetic energy dissipation by particle collisions is given by the Gidaspow and Huilin model (Gidaspow and Huilin, 1996) as:
2.3.5 Drag equations
The Syamlal–O’Brien model (Syamlal and O’Brien, 1987) was used for the drag modeling of the fluidized bed system. The model equation for the gas-solid particle drag interaction is as follows:
where
where
The Reynolds number for the solid phase is given as:
The equation constant
where
The particle–particle drag interaction coefficient is governed by the Syamlal and O’Brien model (Syamlal and O’Brien, 1987) as:
where
2.3.6 Frictional equations
The frictional pressure is derived from KTGF and is given by Syamlal et al. (1993) as:
The frictional viscosity given by Schaffer is as follows:
where
2.4 Geometry and mesh details
A 3D cylindrical geometry of radius 0.036 m with a height of 1.4 m was created in Ansys Workbench 18.1. The bottom was designated as the air inlet, while the upper circular geometry was used as the outlet. Figure 1A shows the 2D plane from 3D geometry with bed height and axial positions at t = 0 s, and Figure 1B shows the 3D geometry representation at t = 0s. The diameter of the cylinder is given by D1, and H represents the total height of the cylinder. At t = 0 s, h represents the initial bed height of the glass particles. Figure 2 shows different views of the mesh used for simulations, including the axial and radial zoomed views of the 3D geometry.
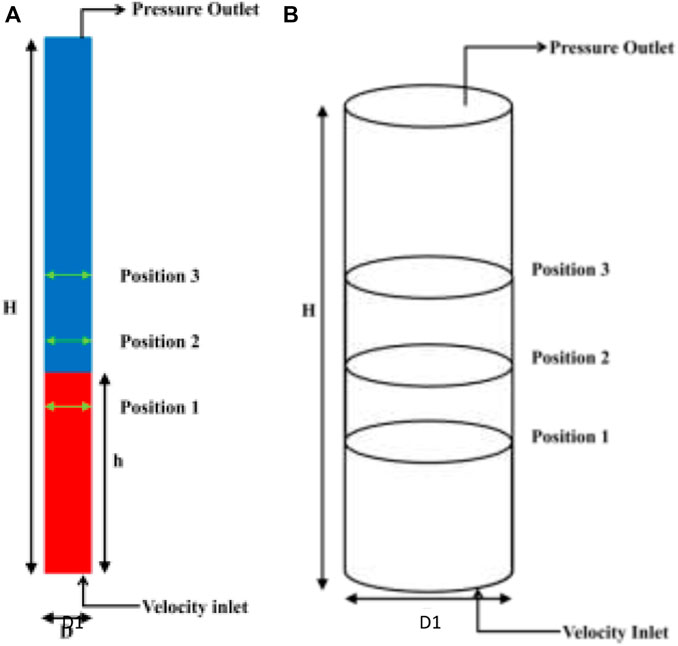
FIGURE 1. Schematic representation of fluidized bed. (A) Schematic of 2D plane (from Ansys Fluent 18.1) showing bed height and axial positions. (B) 3D Schematic with representation (current schematic assumes 0.335 m initial bed height).
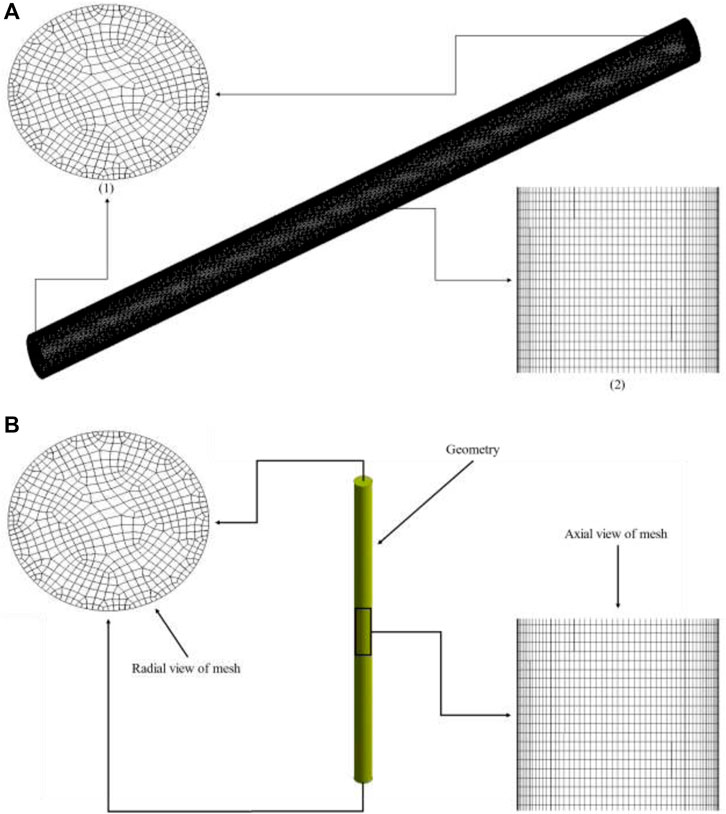
FIGURE 2. Mesh details used for simulations. (A) 3D mesh slanting direction: (1) axial view and (2) radial view. (B) 3D mesh vertical direction showing axial and radial views.
2.5 Boundary conditions
“Velocity-inlet” is used as a boundary for the gas inlet condition. “Pressure-outlet” is used as a boundary condition for outlet. The packing limit for glass particles was taken as 0.63. No-slip condition was applied on the walls. The time-step used in simulation was 0.001 s. The total simulation was run for 7 s.
2.6 Material properties
Glass particles were used as the solid phase and air was used as the fluid phase. Glass particles of two different sizes, 154 μm and 488 μm, were used, and average particle sizes varied between groups. The densities that were used are as follows: 2485 kgm-3 for glass and 1.22 kgm-3 for air. The viscosities used were 0.00082 kgm-1s-1 for glass and 0.000017 kgm-1s-1 for air. The material properties used for simulations were as indicated by Jayarathna and Halvorsen (2011).
2.7 Grid sensitivity
Three different meshes were used for simulations: Mesh 1 with 173,040 elements, Mesh 2 with 267,786 elements, and Mesh 3 with 497,568 elements. The mesh elements are hexahedral and more refined near the wall, with a near-wall yplus of around 30. The initial volume fractions in the 2D plane are shown for both bed heights (hs1 = 0.335 m and hs1 = 0.635 m) in Figure 3. The axial velocity magnitudes in the radial direction for a bed height of 0.335 m were plotted. Figure 4 shows the radial velocity profile at Position 2 of Figure 1 for different meshes. The deviation between Mesh 2 and Mesh 3 was 2%, while maximum deviation for Mesh 1 and Mesh 2 was 10%. Hence, Mesh 2 was used. Figure 4 shows axial and radial views of Mesh 2.
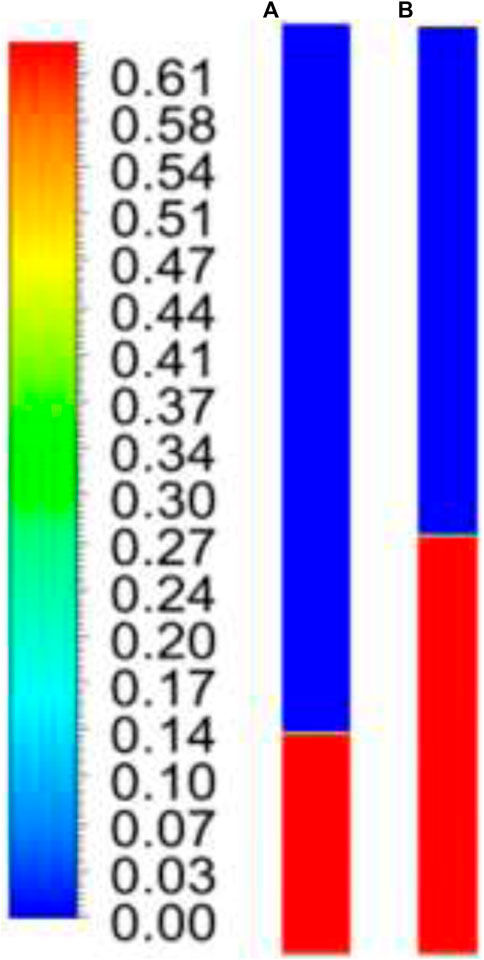
FIGURE 3. Initial volume fraction contours at t = 0 s for (A) 0.335 m initial bed height and (B) 0.635 m initial bed height.
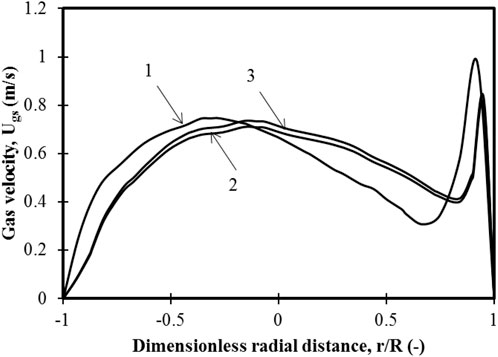
FIGURE 4. Variation of gas velocity for three different grids for position 2 of Figure 1 at steady state for superficial velocity of 0.3 m/s and 100% small particles of the binary mixture: 1.173040 mesh elements; 2.267786 mesh elements; 3.497568 mesh elements.
2.8 Method of solution
The simulations were carried out using commercial fluid software Ansys Fluent 18.1. A first order upwind scheme was used to solve momentum, volume fraction, turbulent kinetic energy, and turbulent dissipation rate equations. A phase-coupled SIMPLE scheme was used to solve pressure–velocity coupling. For transient formulation, a first order implicit scheme was used. Convergence criterion for continuity was 0.001; it was 10−4 for other equations. The parametric data (for initial bed heights, as shown in Figure 3, including superficial velocity, binary mixtures, and both individual and average particle sizes) used for the simulations are shown in Table 3.
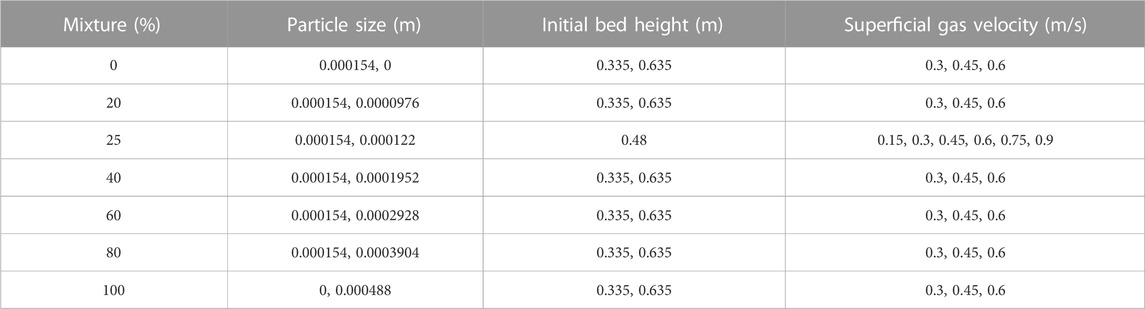
TABLE 3. Parametric data used for simulations.
3 Results and discussion
First, the standard values and models for the parameters, as discussed in Section 1.2, were chosen from those available in the literature. Similarly, the drag and turbulence model was chosen per the literature. The model was validated with experimental data available from published studies that used these standard settings. The transient solid particle dynamics in the bed was then presented in the form of qualitative solid volume fraction contours to understand the segregation and mixing characteristics for different particle size mixtures considered in the study. In this section,
3.1 Regime analysis
Lim et al. (1995) have emphasized the importance of particle size, particle composition, and baffles, which lead to transition from bubbling or slugging regime to turbulent regime. The criteria for the dimensionless velocity that characterizes the regimes are given by Eq. 3. An effort has been made to identify the regime in which the present work was carried out, per analysis demonstrated by Lim et al. (1995). Eqs 46–49 represent the dimensionless numbers and velocities, as well as the average particle diameter for a binary mixture.
Figure 5 shows the plot of the regime analysis (Lim et al., 1995) for the superficial velocities considered in the present work. The analysis shows that the entire zone is in bubbling regime. However, it must be noted that the analysis derived by Lim et al. (1995) was based on experimental data from unary beds.
where
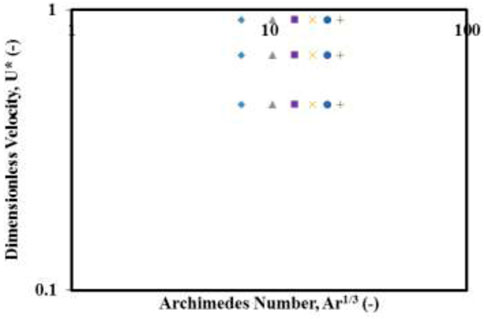
FIGURE 5. Regime analysis, based on the criteria of Bi and Grace (1995), showing the scope of the present analysis of bubbling and slugging regimes. Large particle percentages and corresponding notations: ♦—0% large particles; ▲—20% large particles; ■—40% large particles; ×—60% large particles; ●—80% large particles; and +—100% large particles.
3.2 Model validation
For model validation, two mixtures of 0% and 40% were simulated at 0.235 m of initial bed height and superficial gas velocities varying from
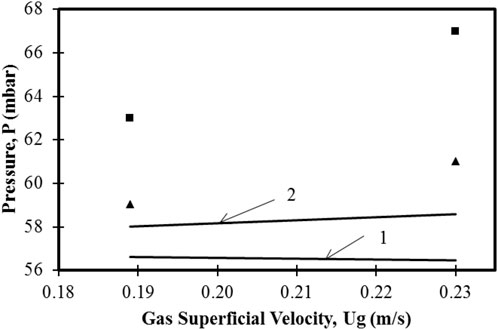
FIGURE 6. Variation of pressure drop as function of gas superficial velocity (
3.3 Flow patterns
Figure 7i shows the steady-state time-averaged solid volume fraction contours for different superficial gas velocities and 0% mixture (100% fine particles) for a bed height of 0.635 m. For superficial gas velocity of
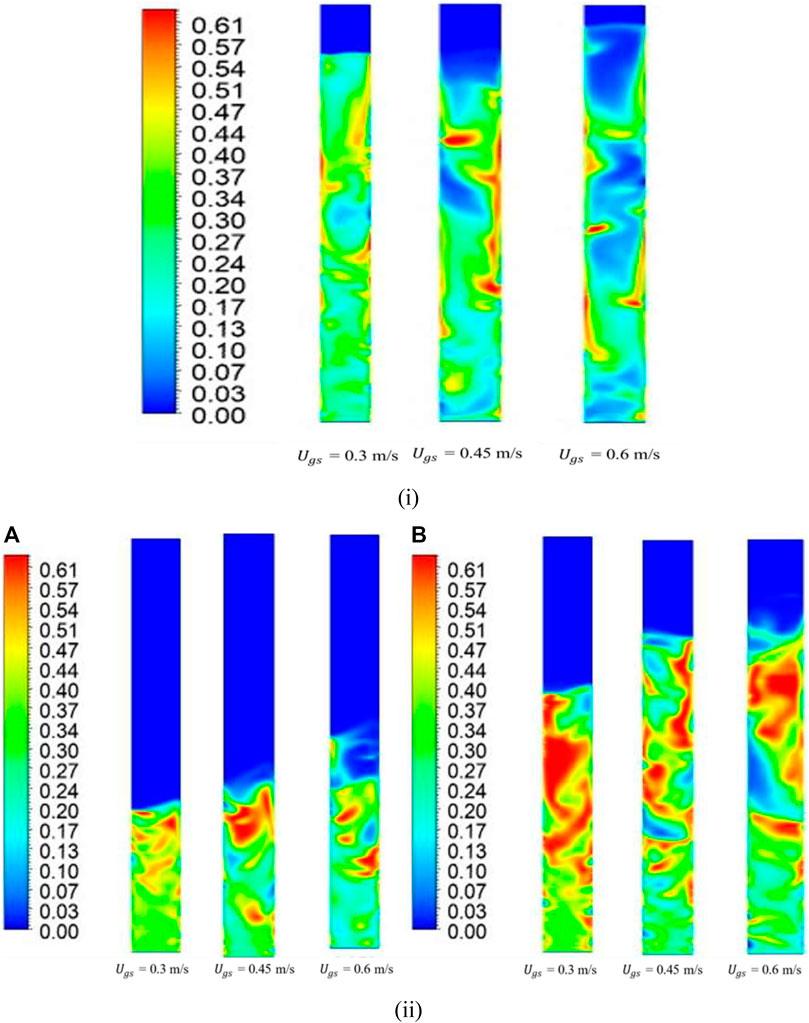
FIGURE 7. Time-averaged steady-state solid-phase volume fraction contours for (i) 0% mixture at 0.635 m bed height and (ii) 20% mixture at (A) 0.335 m bed height and (B) 0.635 m bed height.
Figure 7ii shows steady-state, time-averaged volume fraction contours for two different bed heights of 0.335 m and 0.635 m for the three superficial gas velocities. The binary mixture contained 20% large particles and 80% small particles. Figure 7iiA shows that, for initial bed height of 0.335 m, the fluidized bed steady-state heights were 0.45 m, 0.5 m, and 0.65 m for superficial gas velocities of
Figure 7iiB shows the solid phase volume fractions for a higher initial bed height (z = 0.635 m) for the same set of conditions as in Figure 7iiA. When the superficial gas velocity was lower (
Figure 8 shows the time-averaged steady state solid phase volume fraction contours for a binary mixture of 40% large particles and 60% small particles. Figure 8A shows that, for a lower bed height, there was complete segregation of flotsam and jetsam. However, mixing was observed when the superficial gas velocity was increased (
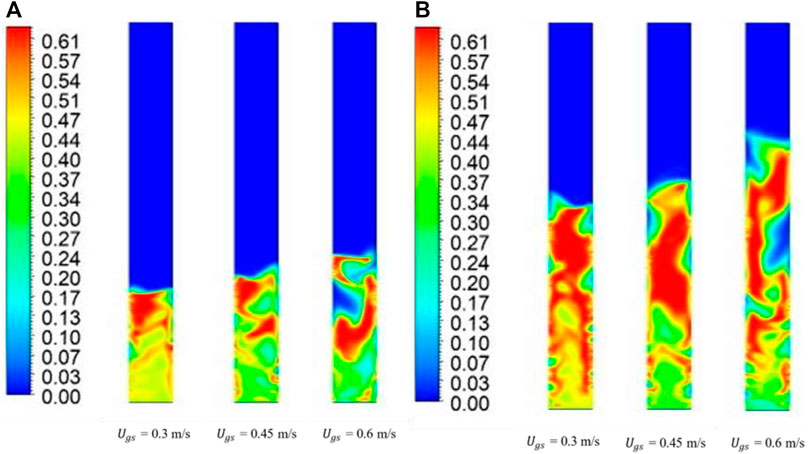
FIGURE 8. Time-averaged steady-state solid-phase volume fraction contours for 40% mixture at (A) 0.335 m bed height and (B) 0.635 m bed height.
Figure 9 shows the time-averaged steady-state solid-phase volume fraction for a binary mixture of 60% large particles and 40% small particles. An interesting observation can be made from Figure 9A for a superficial gas velocity of
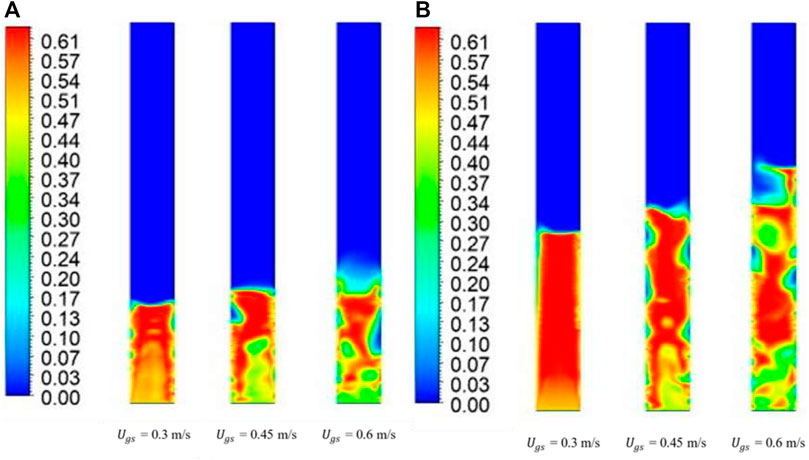
FIGURE 9. Time-averaged steady-state solid-phase volume fraction contours for 60% mixture at (A) 0.335 m bed height and (B) 0.635 m bed height.
Figure 10 shows interesting results for a binary mixture with 80% large solids and 20% fine solids. Figure 10A shows that, for
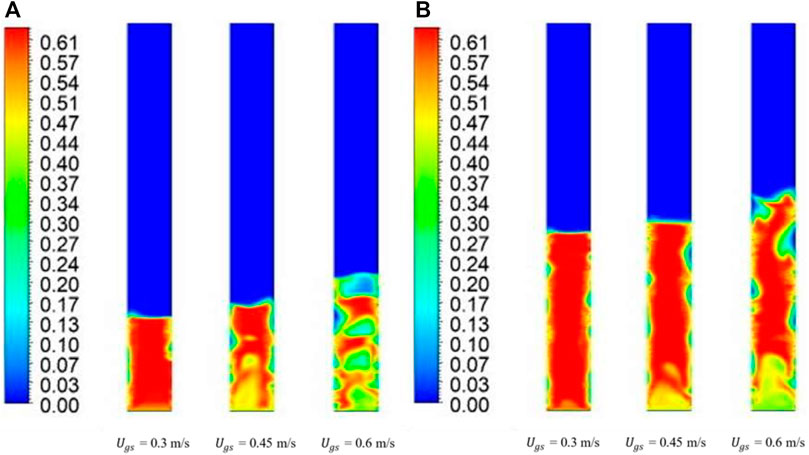
FIGURE 10. Time-averaged steady-state solid-phase volume fraction contours for 80% mixture at (A) 0.335 m bed height and (B) 0.635 m bed height.
Figure 11 shows time-averaged steady-state flow patterns for a binary mixture with 100% large solids and 0% fine solids. It was observed that for both bed heights of 0.335 m and 0.635 m and a low superficial gas velocity of
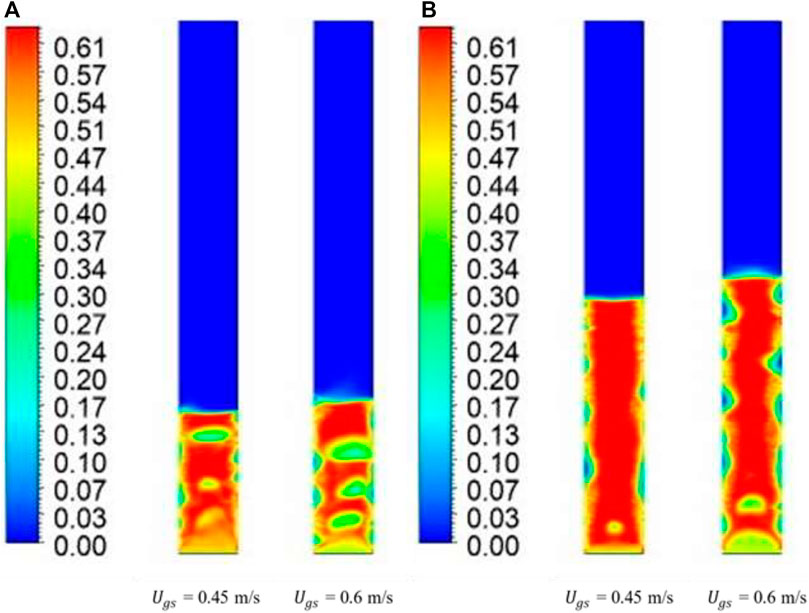
FIGURE 11. Time-averaged steady-state solid-phase volume fraction contours for 100% mixture at (A) 0.335 m bed height and (B) 0.635 m bed height.
Interestingly, until 40% large particle diameter, for most of the superficial gas velocities and bed heights, we observed small structures of bubbles and solid slugs which were representative of the slugging/turbulent regime. However, the flow patterns of a binary mixture with 20%–80% large particles showed more mixing than the cases with 40% and 60% large particles.
Although both cases seemed to represent a turbulent fluidization regime, two distinct questions were posed: 1) Would mixtures of between 20% and 40% large particles be in turbulent range or transition range? and 2) what are the transient dynamics of this process?
Since all the cases from Figures 7–11 were steady-state time-averaged, it was worth observing the transient flow patterns for an intermediate mixture composition and high superficial gas velocity for a different bed height (in between the bed heights already considered). A binary mixture of 25% small particles and 75% large particles was considered for analysis with an initial bed height of 0.48 m. Figure 12 shows the volume fraction contours for the same. Transient volume fraction contours show that, at the end of one second, a large bubble is formed at the top. After each subsequent second, the intermixing throughout the column was evident as turbulent fluidization (although the criterion for fluidization requires confirmation). A similar exercise with increasing superficial gas velocity showed that height of the bed increased as the superficial gas velocity increased, with bubbles forming at
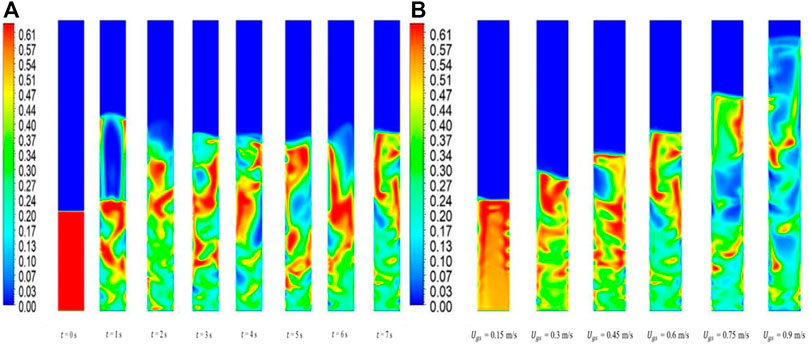
FIGURE 12. Time-averaged solid-phase volume fraction contour for 25% mixture and 0.48 m. (A) Transient flow patterns and (B) steady state flow patterns at different superficial gas velocities.
4 Conclusion
The conclusions drawn from this study are:
1. Qualitative flow patterns and quantitative gas and particle velocity profiles indicate transition from bubbling and slugging regime to turbulent regime for some of the binary mixtures considered. These observations at dimensionless velocity, per the criteria of Lim et al. (1995), are different and may be attributed to the presence of particle size distribution, resulting in breakage of bubbles/slugs during bed expansion.
2. Low volume fractions of 0%–20% of large particles and low superficial gas velocity of
3. For a 40% volume fraction of large particles, the bed remained 70% segregated at both bed heights and superficial velocity of 0.3 m/s. For a higher superficial velocity, the bed was well mixed.
4. For a 60% volume fraction of large particles, the bed was largely segregated for both bed heights and at lower superficial velocity of 0.3 m/s, while for a higher superficial velocity (0.45 m/s), the bed at lower height was well mixed. At the higher bed height, 80% of the bed was well mixed. Furthermore, for a higher superficial velocity of 0.6 m/s, the bed was well mixed at both bed heights.
5. For mixtures with 80% and 100% large particles at lower superficial velocity of 0.3 m/s, the bed did not fluidize, while fluidization of approximately 30%–35% was observed for a superficial velocity of 0.45 m/s at a bed height of 0.635 m. For a lower bed height, the amount of fluidization was around 65%. For the highest velocity considered, the bed was well mixed for lower bed height (0.335 m) and 70% mixed for a higher bed height (0.635 m).
5 Future work
1. In Part II of this two-part series, the present conclusions will be substantiated with comprehensive study of the gas and particle velocity profiles, as well as particle volume fraction profiles, for all the particle mixtures, bed heights, and superficial velocities considered in the present study.
2. Furthermore, the generated data will be used to develop correlations for minimum fluidization velocity and pressure drop for binary mixtures in Part II of the study.
3. Similar comprehensive studies will be taken up, focusing on simulations using the discrete element method (DEM) for lab-scale fluidized beds of Geldart-B and other Geldart group particles, which have practical applications depending on experimental data.
4. Simulation studies focusing on particles larger than 1 mm should be conducted, as has been reported in the experimental literature.
Data availability statement
The simulation data supporting the conclusion of this article will be made available by the authors, without undue reservation.
Author contributions
Conceptualization, AG and VB; methodology, AG; software, AG; validation, VB; formal analysis, VB; investigation, AG and VB; resources, AG; data curation, VB; writing—original draft preparation, AG and VB; writing—review and editing, AG; visualization, AG; supervision, AG; project administration, AG; funding acquisition, AG.
Acknowledgments
The authors thank the School of Engineering and Applied Sciences, Ahmedabad University, for the resources and their continuous support during the project.
Conflict of interest
The authors declare that the research was conducted in the absence of any commercial or financial relationships that could be construed as a potential conflict of interest.
Publisher’s note
All claims expressed in this article are solely those of the authors and do not necessarily represent those of their affiliated organizations, or those of the publisher, the editors, and the reviewers. Any product that may be evaluated in this article, or claim that may be made by its manufacturer, is not guaranteed or endorsed by the publisher.
Abbreviations
2D two-dimensional 3D three-dimensional BFB bubbling fluidized bed CFD computational fluid dynamics GS gas–solid LLDPE linear low-density polyethylene KTGF kinetic theory of granular flow PSD particle size distribution RNG renormalization group RPT radioactive particle tracking SIMPLE semi-implicit method for pressure-linked equations TFB turbulent fluidized bed.
References
Agrawal, V., Shinde, Y., Shah, M. T., Utikar, R. P., Pareek, V. K., and Joshi, J. B. (2018). Effect of drag models on CFD–DEM predictions of bubbling fluidized beds with Geldart D particles. Adv. Powder Technol. 29, 2658–2669. doi:10.1016/j.apt.2018.07.014
Ahmadi, G., and Ma, D. (1990). A thermodynamical formulation for dispersed multiphase turbulent flows—1: Basic theory. Int. J. Multiph. Flow 16, 323–340. doi:10.1016/0301-9322(90)90062-n
Bakshi, A., Ghoniem, A., and Altantzis, C. (2017). Mixing dynamics in bubbling fluidized beds. AIChE J. 63, 4316–4328. doi:10.1002/aic.15801
Behzadi, S. S., Prakasvudhisarn, C., Klocker, J., Wolschann, P., and Viernstein, H. (2009). Comparison between two types of artificial neural networks used for validation of pharmaceutical processes. Powder Technol. 195, 150–157. doi:10.1016/j.powtec.2009.05.025
Benzarti, S., Mhiri, H., Bournot, H., and Occelli, R. (2014). Numerical simulation of turbulent fluidized bed with Geldart B particles. Adv. Powder Technol. 25, 1737–1747. doi:10.1016/j.apt.2014.06.024
Bi, H., and Grace, J. (1995). Flow regime diagrams for gas-solid fluidization and upward transport. Int. J. Multiph. Flow 21, 1229–1236. doi:10.1016/0301-9322(95)00037-x
Čársky, M., Pata, J., Veselý, V., and Hartman, M. (1987). Binary system fluidized bed equilibrium. Powder Technol. 51, 237–242. doi:10.1016/0032-5910(87)80024-4
Chang, J., Wang, G., Gao, J., Zhang, K., Chen, H., and Yang, Y. (2012). CFD modeling of particle–particle heat transfer in dense gas-solid fluidized beds of binary mixture. Powder Technol. 217, 50–60. doi:10.1016/j.powtec.2011.10.008
Chang, J., Wu, Z., Wang, X., and Liu, W. (2019). Two-and three-dimensional hydrodynamic modeling of a pseudo-2D turbulent fluidized bed with Geldart B particle. Powder Technol. 351, 159–168. doi:10.1016/j.powtec.2019.04.028
Chew, J. W., and Cocco, R. A. (2021). Fast versus turbulent fluidization of Geldart Group B particles. AIChE J. 67, e17216. doi:10.1002/aic.17216
Chew, J. W., Wolz, J. R., and Hrenya, C. M. (2010). Axial segregation in bubbling gas-fluidized beds with Gaussian and lognormal distributions of Geldart Group B particles. AIChE J. 56, 3049–3061. doi:10.1002/aic.12219
Cho, H. I., Chung, C.-H., Han, G. Y., Ahn, G. R., and Kong, J. S. (2000). Axial gas dispersion in a fluidized bed of polyethylene particles. Korean J. Chem. Eng. 17, 292–298. doi:10.1007/bf02699043
Chyang, C. S., Kuo, C. C., and Chen, M. Y. (1989). Minimum fluidization velocity of binary mixtures. Can. J. Chem. Eng. 67, 344–347. doi:10.1002/cjce.5450670222
Coltters, R., and Rivas, A. (2004). Minimum fluidation velocity correlations in particulate systems. Powder Technol. 147, 34–48. doi:10.1016/j.powtec.2004.06.013
Cooper, S., and Coronella, C. J. (2005). CFD simulations of particle mixing in a binary fluidized bed. Powder Technol. 151, 27–36. doi:10.1016/j.powtec.2004.11.041
Daryus, A., Siswantara, A. I., BudiarsoGunadi, G. G. R., and Pujowidodo, H. (2019). “CFD simulation of multiphase fluid flow in a two-dimensional gas-solid fluidized bed using two different turbulence models,” in AIP conference proceedings (New York, United States: AIP Publishing LLC), 020016.
Di Maio, F. P., Di Renzo, A., and Vivacqua, V. (2012). A particle segregation model for gas-fluidization of binary mixtures. Powder Technol. 226, 180–188. doi:10.1016/j.powtec.2012.04.040
Du, W., Bao, X., Xu, J., and Wei, W. (2006). Computational fluid dynamics (CFD) modeling of spouted bed: Influence of frictional stress, maximum packing limit and coefficient of restitution of particles. Chem. Eng. Sci. 61, 4558–4570. doi:10.1016/j.ces.2006.02.028
Ellis, N., Bi, H., Lim, C., and Grace, J. (2004). Hydrodynamics of turbulent fluidized beds of different diameters. Powder Technol. 141, 124–136. doi:10.1016/j.powtec.2004.03.001
Emiola-Sadiq, T., Wang, J., Zhang, L., and Dalai, A. (2021). Mixing and segregation of binary mixtures of biomass and silica sand in a fluidized bed. Particuology 58, 58–73. doi:10.1016/j.partic.2021.01.010
Formisani, B., Girimonte, R., and Longo, T. (2008). The fluidization process of binary mixtures of solids: Development of the approach based on the fluidization velocity interval. Powder Technol. 185, 97–108. doi:10.1016/j.powtec.2007.10.003
Fu, Z., Zhu, J., Barghi, S., Zhao, Y., Luo, Z., and Duan, C. (2019). Minimum fluidization velocity growth due to bed inventory increase in an Air Dense Medium Fluidized Bed. Chem. Eng. J. 359, 1372–1378. doi:10.1016/j.cej.2018.11.041
Gao, J., Lan, X., Fan, Y., Chang, J., Wang, G., Lu, C., et al. (2009). Hydrodynamics of gas–solid fluidized bed of disparately sized binary particles. Chem. Eng. Sci. 64, 4302–4316. doi:10.1016/j.ces.2009.07.003
Geldart, D. (1973). Types of gas fluidization. Powder Technol. 7, 285–292. doi:10.1016/0032-5910(73)80037-3
Gidaspow, D., and Huilin, L. (1996). Collisional viscosity of FCC particles in a CFB. AIChE J. 42, 2503–2510. doi:10.1002/aic.690420910
Gupta, S., and De, S. (2021). Investigation of hydrodynamics and segregation characteristics in a dual fluidized bed using the binary mixture of sand and high-ash coal. Adv. Powder Technol. 32 (8), 2690–2702.
Harris, A., Davidson, J., and Thorpe, R. (2002). The prediction of particle cluster properties in the near wall region of a vertical riser (200157). Powder Technol. 127, 128–143. doi:10.1016/s0032-5910(02)00114-6
Huilin, L., Yurong, H., and Gidaspow, D. (2003). Hydrodynamic modelling of binary mixture in a gas bubbling fluidized bed using the kinetic theory of granular flow. Chem. Eng. Sci. 58, 1197–1205. doi:10.1016/s0009-2509(02)00635-8
Jayarathna, C., and Halvorsen, B. (2011). Experimental and computational study of pressure drop and void fraction in a bubbling fluidized bed. WIT Trans. Eng. Sci. 70, 177–188.
Khezri, R., Wan Ab Karim Ghani, W. A., Masoudi Soltani, S., Awang Biak, D. R., Yunus, R., Silas, K., et al. (2019). Computational fluid dynamics simulation of gas–solid hydrodynamics in a bubbling fluidized-bed reactor: Effects of air distributor, viscous and drag models. Processes 7, 524. doi:10.3390/pr7080524
Korkerd, K., Soanuch, C., Gidaspow, D., Piumsomboon, P., and Chalermsinsuwan, B. (2021). Artificial neural network model for predicting minimum fluidization velocity and maximum pressure drop of gas fluidized bed with different particle size distributions. South Afr. J. Chem. Eng. 37, 61–73. doi:10.1016/j.sajce.2021.04.003
Kotoky, S., Dalal, A., and Natarajan, G. (2020). A computational analysis of the role of particle diameter on the fluidization behavior in a bubbling gas–solid fluidized bed. Comput. Part. Mech. 7, 555–565. doi:10.1007/s40571-019-00279-4
Lan, X., Yan, W., Xu, C., Gao, J., and Luo, Z.-H. (2014). Hydrodynamics of gas–solid turbulent fluidized bed of polydisperse binary particles. Powder Technol. 262, 106–123. doi:10.1016/j.powtec.2014.04.056
Leion, H., Frick, V., and Hildor, F. (2018). Experimental method and setup for laboratory fluidized bed reactor testing. Energies 11, 2505. doi:10.3390/en11102505
Lim, K., Zhu, J., and Grace, J. (1995). Hydrodynamics of gas-solid fluidization. Int. J. Multiph. flow 21, 141–193. doi:10.1016/0301-9322(95)00038-y
Lun, C., Savage, S. B., Jeffrey, D., and Chepurniy, N. (1984). Kinetic theories for granular flow: Inelastic particles in Couette flow and slightly inelastic particles in a general flowfield. J. fluid Mech. 140, 223–256. doi:10.1017/s0022112084000586
Mazzei, L., Casillo, A., Lettieri, P., and Salatino, P. (2010). CFD simulations of segregating fluidized bidisperse mixtures of particles differing in size. Chem. Eng. J. 156, 432–445. doi:10.1016/j.cej.2009.11.003
Menéndez, M., Herguido, J., Bérard, A., and Patience, G. S. (2019). Experimental methods in chemical engineering: Reactors—Fluidized beds. Can. J. Chem. Eng. 97, 2383–2394. doi:10.1002/cjce.23517
Mostafazadeh, M., Rahimzadeh, H., and Hamzei, M. (2013). Numerical analysis of the mixing process in a gas–solid fluidized bed reactor. Powder Technol. 239, 422–433. doi:10.1016/j.powtec.2013.02.008
Noda, K., Uchida, S., Makino, T., and Kamo, H. (1986). Minimum fluidization velocity of binary mixture of particles with large size ratio. Powder Technol. 46, 149–154. doi:10.1016/0032-5910(86)80021-3
Obuseh, C. C., Feng, Z.-G., and Paudel, B. D. (2012). An experimental study on fluidization of binary mixture in particulate flows. J. dispersion Sci. Technol. 33, 1379–1384. doi:10.1080/01932691003800163
Pei, P., Wu, G., Zhang, K., Yu, B., Jiang, J., and Wen, D. (2010). CFD simulation of jet behaviors in a binary gas-solid fluidized bed: Comparisons with experiments. Front. Chem. Eng. China 4, 242–249. doi:10.1007/s11705-009-0277-3
Philippsen, C. G., Vilela, A. C. F., and Dalla Zen, L. (2015). Fluidized bed modeling applied to the analysis of processes: Review and state of the art. J. Mater. Res. Technol. 4, 208–216. doi:10.1016/j.jmrt.2014.10.018
Roy, S., Pant, H. J., and Roy, S. (2021). Velocity characterization of solids in binary fluidized beds. Chem. Eng. Sci. 246, 116883. doi:10.1016/j.ces.2021.116883
Sahoo, P., and Sahoo, A. (2016). CFD simulation for hydrodynamic behaviour of fine particles in a fluidized bed. Indian J. Chem. Technol. (IJCT) 23, 253–261.
Sande, P., and Ray, S. (2014). Mesh size effect on CFD simulation of gas-fluidized Geldart A particles. Powder Technol. 264, 43–53. doi:10.1016/j.powtec.2014.05.019
Schaeffer, D. G. (1987). Instability in the evolution equations describing incompressible granular flow. J. Differ. Equations 66, 19–50. doi:10.1016/0022-0396(87)90038-6
Shao, Y., Li, Z., Zhong, W., Bian, Z., and Yu, A. (2020). Minimum fluidization velocity of particles with different size distributions at elevated pressures and temperatures. Chem. Eng. Sci. 216, 115555. doi:10.1016/j.ces.2020.115555
Shrestha, S., Kuang, S., Yu, A., and Zhou, Z. (2019). Bubble dynamics in bubbling fluidized beds of ellipsoidal particles. AIChE J. 65, e16736. doi:10.1002/aic.16736
Syamlal, M., and O’brien, T. (1987). The derivation of a drag coefficient formula from velocity-voidage correlations. NETL, Morgantown, WV: Technical Note, US Department of energy, Office of Fossil Energy.
Syamlal, M., Rogers, W., and Obrien, T. J. (1993). MFIX documentation theory guide. WV (United States)): USDOE Morgantown Energy Technology Center.
Wirth, K. E. (1988). Axial pressure profile in circulating fluidized beds. Chem. Eng. Technol. 11, 11–17. doi:10.1002/ceat.270110103
Yohana, E., MuchammadTauviqirrahman, M., Sayekti, A. A., Choi, K.-H., and Paramita, V. (2020). Effect of particle size and bed height on the characteristic of a fluidized bed dryer. Cogent Eng. 7, 1738185. doi:10.1080/23311916.2020.1738185
Yoshida, K., Kunii, D., and Levenspiel, O. (1969). Axial dispersion of gas in bubbling fluidized beds. Industrial Eng. Chem. Fundam. 8, 402–406. doi:10.1021/i160031a006
Zaabout, A., Bournot, H., Occelli, R., and Kharbouch, B. (2010). Characterization of turbulent regime behavior in the dilute zone of a circulating fluidized bed riser.
Zhang, D., Deen, N., and Kuipers, J. (2006). Numerical simulation of the dynamic flow behavior in a bubble column: A study of closures for turbulence and interface forces. Chem. Eng. Sci. 61, 7593–7608. doi:10.1016/j.ces.2006.08.053
Zhou, J., Grace, J., Lim, C., and Brereton, C. (1995). Particle velocity profiles in a circulating fluidized bed riser of square cross-section. Chem. Eng. Sci. 50, 237–244. doi:10.1016/0009-2509(94)00241-i
Nomenclature
Alphabetical Symbols
Greek Symbols
Subscripts
Superscripts
Keywords: fluidized bed, binary mixtures, pressure drop, minimum fluidization velocity, flow patterns, particle velocity, CFD
Citation: Ganguli A and Bhatt V (2023) CFD simulations to study bed characteristics in gas–Solid fluidized beds with binary mixtures of Geldart-B particles: A qualitative analysis. Front. Energy Res. 11:1059503. doi: 10.3389/fenrg.2023.1059503
Received: 01 October 2022; Accepted: 23 January 2023;
Published: 20 February 2023.
Edited by:
Abdolali K. Sadaghiani, Sabancı University, TürkiyeReviewed by:
Zhongjie Shen, East China University of Science and Technology, ChinaNaresh Hanchate, Institute of Chemical Technology, India
Copyright © 2023 Ganguli and Bhatt. This is an open-access article distributed under the terms of the Creative Commons Attribution License (CC BY). The use, distribution or reproduction in other forums is permitted, provided the original author(s) and the copyright owner(s) are credited and that the original publication in this journal is cited, in accordance with accepted academic practice. No use, distribution or reproduction is permitted which does not comply with these terms.
*Correspondence: Arijit Ganguli, Z2FuZ3VsaWFyaWppdEBnbWFpbC5jb20=