 Michael Alfred Stephenson Biharta
 Sigit Puji Santosa2,3*
- 1Department of Aerospace Engineering, Faculty of Mechanical and Aerospace Engineering, Institut Teknologi Bandung (ITB), Bandung, Indonesia
- 2Lightweight Structures Research Group, Faculty of Mechanical and Aerospace Engineering, Institut Teknologi Bandung (ITB), Bandung, Indonesia
- 3National Center for Sustainable Transportation Technology (NCSTT), Institut Teknologi Bandung (ITB), Bandung, Indonesia
- 4National Defense Research Center, Institut Teknologi Bandung (ITB), Bandung, Indonesia
The lithium-ion battery is becoming a very important energy source for vehicles designated as electric vehicles. This relatively new energy source is much more efficient and cleaner than conventional fossil fuel. However, lithium-ion batteries have a high risk of fire during a crash, where the large deformation on the battery during the crash may cause thermal runaway. This research explores that idea by studying the design and optimization of sandwich-based auxetic honeycomb structures to protect the pouch battery cells for the battery pack system of electric vehicles undergoing axial impact load using machine learning methods. The optimization was done using Artificial Neural Network (ANN), and Non-Dominated Sorting Genetic Algorithm Type II (NSGA-II) combined with Technique for Order of Preference by Similarity to Ideal Solution (TOPSIS). Artificial Neural Network predicted the sandwich structure’s specific energy absorption (SEA) and the maximum battery stress during deformation. NSGA-II combined with TOPSIS optimized the design using both of the predictors. Both creations of the training data and validation were done using the non-linear finite element method. The optimized design has a geometric shape of Double-U, a length of
1 Introduction
Lithium-ion batteries play a crucial part in the modern world, frequently used as power components in consumer electronics, electric vehicles (EV), and battery-based energy storage systems (BESS). It continues to develop rapidly in various aspects, such as energy density, weight, and manufacturing processes. It is also being used in the transportation industry as an effort to reduce its carbon footprint on the environment (Battery University, 2018) (Hertzke, et al., 2018) (Li, et al., 2022).
This new application area presents new safety risks and can lead to accidents due to the variety of loads and conditions to which lithium-ion batteries are exposed during the operation of a vehicle or mobile BESS. Burning is the most common problem for Lithium-Ion batteries in an accident involving car and airplane batteries. For example, Boeing 787-8 from Japan Airlines at Logan International Airport in January 2013, Boeing 787 from All Nippon Airways in January 2013, and Boeing 787 from November 2017 (Sun, et al., 2020) (Drew & Mouawad, 2013) (Drew & Mouawad, 2013).
Post-crash fires make up a large portion of the fires. Thermal runaway in batteries causes post-crash fire (short circuits between various components of the battery) (Battery Power, 2019). A short circuit is created by physical contact between battery components due to battery deformation during an accident (Bisschop, et al., 2019). Lithium-ion battery fires can even pose a safety risk to emergency responders, as they can reignite even after the initial fire has been extinguished (Pietsch, 2021). According to Everyday Safety for Electric Vehicles (EVERSAFE) project, the longitudinal scenario especially rear-end collisions pose the highest risk due to limited regulatory requirements (Wisch, et al., 2014). This case is classified as in-plane impact loads, where layers of components within the pouch battery buckle under the load. (Kermani, et al., 2021). With the growing interest in lithium-ion batteries as energy storage in the transportation industry, there is an urgent need to find optimal battery protection and safety to reduce fire risk after an accident.
An optimum battery protector is characterized by high energy absorption capacity and high strength to reduce the deformation of the battery during impact. Also, the mass should be as light as possible to keep the vehicle light and use less energy. (Shi, et al., 2019). Various structures, such as a sandwich structure, are considered protection devices for lithium-ion batteries. Sandwich structures are used frequently in aerospace and construction because they are lightweight and have a high energy absorption capacity (Yazdani, et al., 2018) (Campbell, 2006).
Meta-structures, a repeated arrangement of unit cell structures, may be used to fill the core of a sandwich structure (Campbell, 2006). It is lighter than equivalent solid structures and has some natural examples, such as human bones and the honeycomb-like formations seen in beehives. Meta-structure can be further divided according to its form and property, such as auxetic, lattice, and chiral. The auxetic structure is a meta-structure in which each cell structure has a negative Poisson’s ratio (NPR). When bent out of plane, the auxetic structure can produce a curved surface primarily distributed by positive Gaussian curvature. It can also increase resistance to shear deformation, improve indentation resistance at concentrated load points, and have high energy absorption and damping while remaining lightweight (Gibson & Ashby, 1997) (Cochrane, et al., n.d.) (Sakai & Ohsaki, 2021).
Auxetic property was first observed in artificial polyurethane foam in 1987 (Lakes, 1987). Since then, different auxetic materials, including crystal polymers, composites, metals, and ceramics, have been produced in various ways. Auxetic structure’s unique properties in many situations have been discovered through research into auxetic material and its properties. The auxetic effect principally results from some typical microscopic traits, including re-entrant, rotation, and chirality characteristics, as shown in the micro-deformation modes of NPR materials. These works have created auxetic cellular structures made up of particular microstructures in recent years. These cellular formations are typically collections of model cells, such as chiral, re-entrant hexagonal, double arrowhead, and star-shaped units (Wang, et al., 2018).
This research studied battery protector from in-plane impact loads with sandwich-based auxetic honeycomb with in-plane impact. Four auxetic shapes were analyzed: double arrow (Gao, et al., 2020) (Ma, et al., 2018), double-U (Guo, et al., 2020), and two types of re-entrant where they differed in two principal directions (Wu, et al., 2020) (Xiao, et al., 2019) (Najafi, et al., 2020) (Wang, et al., 2018). This work uses the non-linear dynamics finite element approach for all numerical simulations (DYNAmore GmbH, 2021).
Machine learning methods are becoming very important in designing and optimizing a new product. Designers working with machine learning methods will have a tool to design faster and cheaper due to the increased speed and efficiency (Philips, 2018). This acceleration is specifically important in the market environment that demands faster product development. Many businesses focus on getting their latest products to consumers as fast as possible to stay competitive. Priority on speed to market can mean the difference in whether the public considers a company to be a leader or a follower (Indeed Editorial Team, 2021).
Previous research has focused on improving the sandwich-based auxetic structure to protect pouch batteries from out-of-plane impacts (Biharta, et al., 2022), where the sandwich core in the battery protection system might use an ideal 3D auxetic structure to reduce battery deformation. Previous research has been done on optimizing the sandwich-based lattice construction for battery protection from out-of-plane impact (Pratama, et al., 2021), where it has been successfully done to create a sandwich-based lattice structure to protect the battery from ground impact load. Previous research has been done on optimizing the tubular auxetic structure for non-module battery packs to reduce impact and heat dissipation (Wang, et al., 2021), where machine learning techniques have been successfully used to develop a tubular auxetic construction to safeguard the battery from impact stress and improve heat dissipation. This study varies by optimizing pouch battery protection based on sandwich-based auxetic honeycomb against in-plane impact loading using the machine learning method. The pouch battery numerical model was based on Kermani et al. (Kermani, et al., 2021). The four 2D auxetic honeycomb shapes are designed to be easier to manufacture with conventional manufacturing methods. This change is hoped to make this study’s data easier to implement for another crashworthiness application.
2 Methodology
The design of experiment was made to be as continuous as possible and distributed by Latin Hypercube Sampling (LHS), where one hundred models were generated. The models created from the experiment design were then analyzed using the non-linear finite element method to produce the training data for optimization. Optimization was done using Artificial Neural Network combined with the NSGA-II method to find a sandwich-based auxetic honeycomb with the highest specific energy absorption (SEA) and results in enough battery deformation or the equivalent to not fail under in-plane impact loading within a limited space. The research follows the flowchart shown in Figure 1.
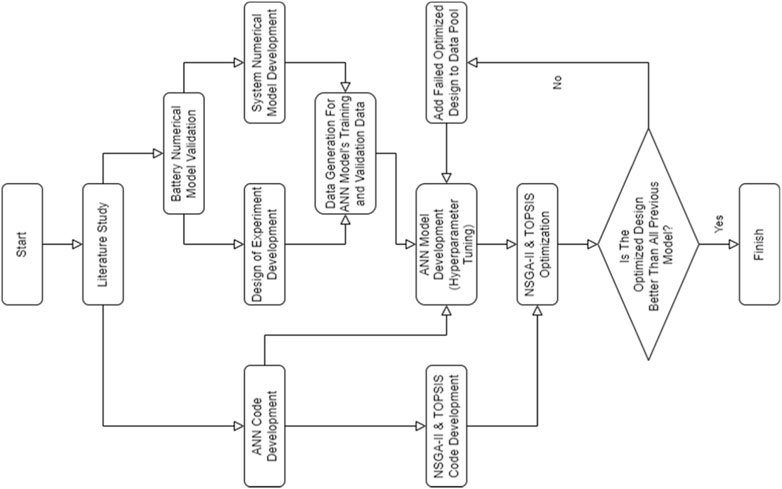
FIGURE 1. Research flowchart.
2.1 Design of experiment
The Design of Experiment (DoE) was created using Latin Hypercube Sampling (LHS) methodology. On each one-dimensional projection, LHS is based on stratification and provides good homogeneity (Hou, et al., 2012).
The geometric parameters will highly influence the DoE’s parameters, so new ones must be developed to accommodate all geometric shapes and simplify the optimization process. Five parameters were chosen: length (L), width (W), bending’s height (H), cross section’s thickness (t), and the number of layers (n). The number of layers explains how many auxetic cells were stacked on top of each other in the “L” direction. An illustration of the new geometric parameters is shown in Figure 2.
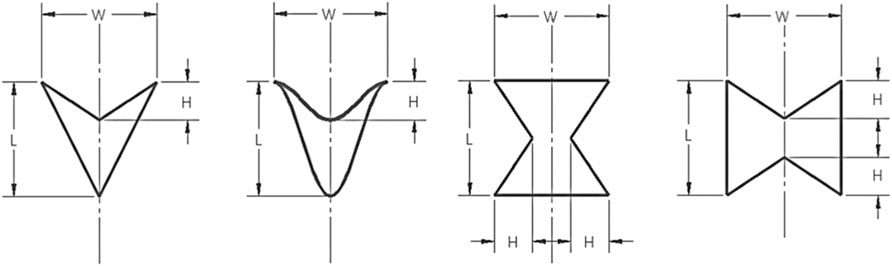
FIGURE 2. New geometric parameters, from left to right: DA, DU, RE-A, RE-B.
Five parameters were then chosen for the DoE’s parameters, consisting of three continuous and two categorical parameters, shown in Table 1.
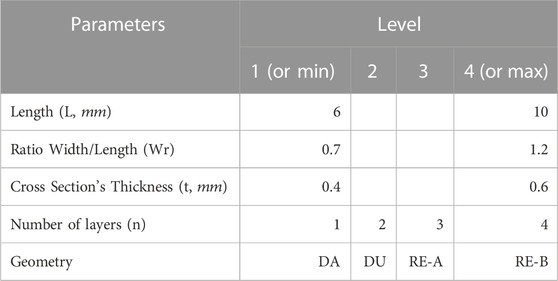
TABLE 1. Parameters and levels of the design of experiment.
The value for each level was selected based on several considerations. The minimum and maximum lengths were chosen to keep the whole system small but still can protect the battery. The minimum and maximum ratio of width/length were chosen to provide enough variety to the shape of individual auxetic honeycomb while not taking too much space. The minimum and maximum cross section’s thickness were chosen to keep within the geometrical constraint while stable enough during the numerical simulation. The number of layers was chosen to observe the significance of the number of layers. The bending’s height (h) was set at a fixed ratio of 0.3 of the length for all geometry. Each parameter was rounded to two decimal places to ease the data input. The 3D plot of the first three parameters (all continuous parameters) is shown in Supplementary Figure S1.
A total of 103 different models were generated, 100 models using the LHS method, and three models (model no. 101, 102, 103) were generated from failed optimization attempts to fill the three failed numerical analyses from the original design of experiment (model no. 9, 24, and 88).
2.2 Battery numerical modeling
Pouch batteries are employed as the test subject. A homogenized macro model by Kermani et al. (Kermani, et al., 2021) serves as the foundation for the numerical model for pouch batteries.
The battery cell was axially squeezed with a flat impactor that moved uniformly downward, much like in the reference (see Figure 3). A rigid wall (brown) was used to restrict the cell in the machine (in-plane) direction. Two rigid walls (turquoise and violet) were utilized to confine the cell in the through-thickness (out-of-plane) direction. The impactor was sized to be twice the length and thickness of the battery to compensate for any deformation during the compression.
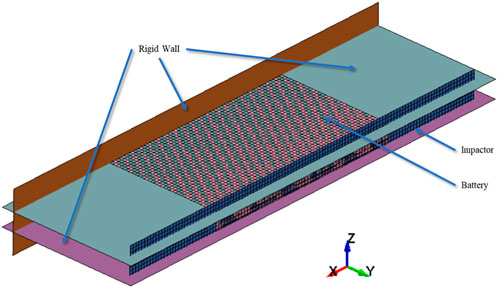
FIGURE 3. General configuration of battery validation model.
The battery’s dimension in this study is
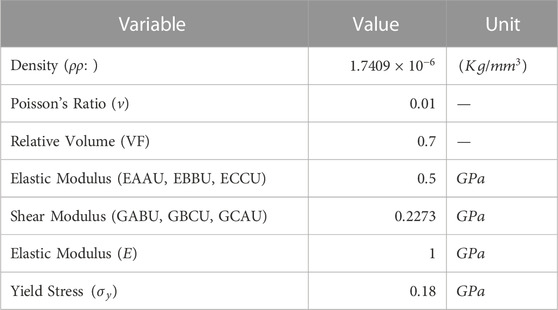
TABLE 2. Material property of battery’s foam (Sahraei, et al., 2012) (Kermani, et al., 2021).
The simulation is carried out in a quasistatic mode, with the impactor’s velocity applied as a prescribed motion velocity, with a final velocity of
There are three types of contact in battery simulation: Automatic Single Surface applied to the battery, One Way Surface to Surface applied between the battery and the impactor, and Interior applied to the battery.
The displacement of the battery was measured by the distance between the node right in the center of the battery. The load was measured by measuring the load between the battery and the rigidwall behind the battery. This was done because, despite the writer’s best efforts, there is still small penetration between the battery and the impactor, so no measurement was taken on the impactor.
It was found that the risk of a short circuit is much higher on this pouch battery when it is compressed at about
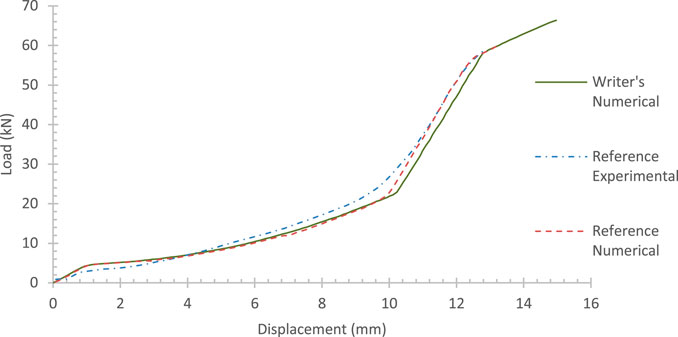
FIGURE 4. Comparison of force curve between reference and writer’s result.
Battery’s von Mises stress was used to measure exactly when the battery in the system model failed. This is done because the load condition in system modeling is dynamic load, where the stress distribution during deformation will not be as uniform as in the validation model. Furthermore, multiple battery configurations were used in the system modeling, complicating the measuring process. The von Mises stress when the battery is compressed at about
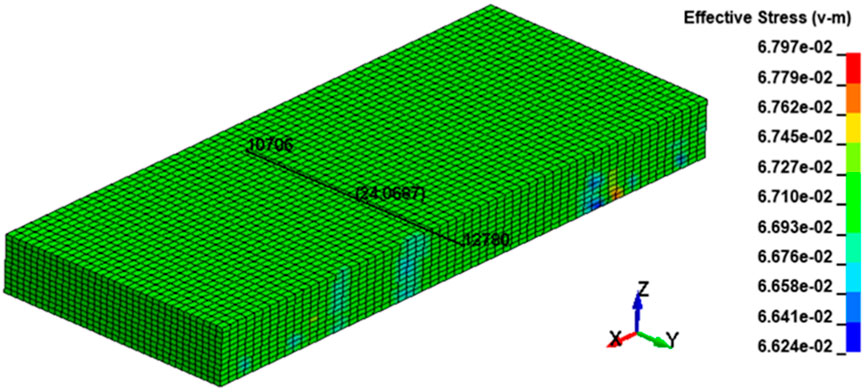
FIGURE 5. Battery’s von Mises stress on 10 mm deformation (all rigidwalls and impactor hidden).
2.3 System numerical modeling
2.3.1 General configuration
The general configuration for the system modeling is based on Audi Q4’s battery system. Crash structures were reinterpreted as thick plate structures that still functions to hold the battery in place and transfer load during a crash, now called support structure. Lower protection and housing cover were reinterpreted as thin plate structures that sandwich the battery packs and crash structures, now called plate structures. In many electric vehicles, including Audi Q4 e-tron, the battery frame consists of extruded tubular cells (Aluminum Extruders Council, n.d.). This part was reinterpreted as a sandwich-based auxetic honeycomb structure designed to protect the battery pack. The result can be seen in Figure 6, with the battery housing system detailed in Figure 7 and the sandwich structure detailed in Figure 8.
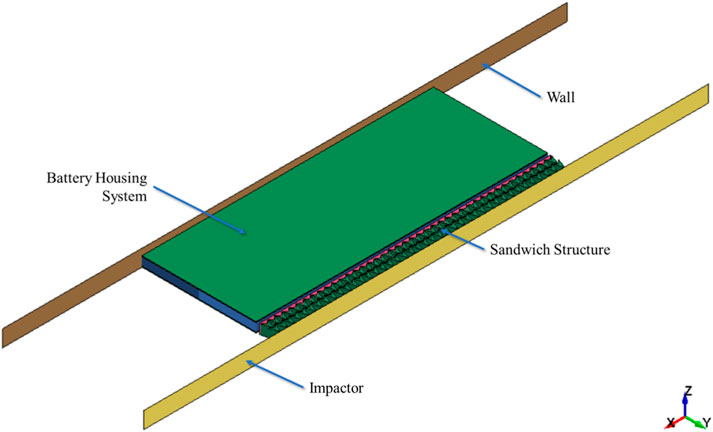
FIGURE 6. General configuration of the system model.

FIGURE 7. Exploded view of the battery housing system, consisting of 6 battery packs (pink), the support structure (blue), and the plate structure (green).
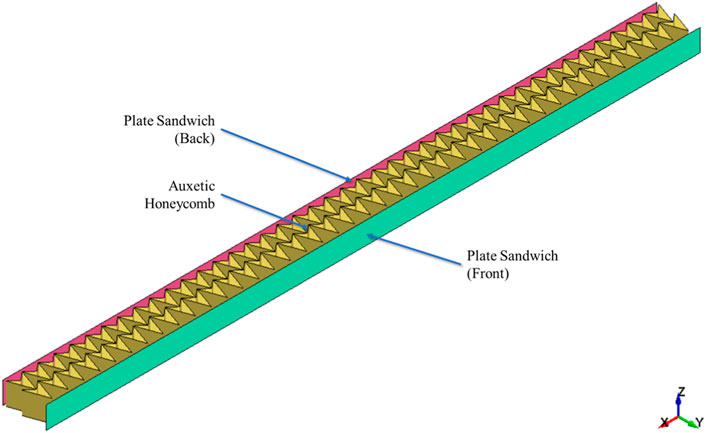
FIGURE 8. Sandwich structure, consisting of plate sandwich (red and green) and auxetic honeycomb (yellow).
2.3.2 Impactor and wall
Impactor was designed from Moving Deformable Barrier (MDB) for side impact according to FMVSS No. 214, Dynamic Side Impact Protection (Smith, 2005). New Car Assessment Program (NCAP) for the 2019 Audi e-tron quattro 5-Door SUV was used to obtain the velocity of the MDB (Fischer, 2019). Both impactor and wall were modeled as a rigid plate with twice the area of the battery,
The total mass of MDB is
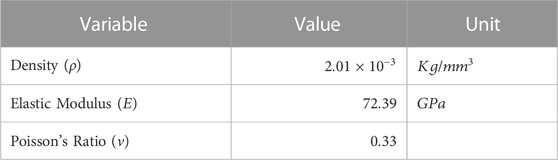
TABLE 3. Material property of wall and impactor (Chen & Ingraffea, 2002).
Instead of the total velocity of the MDB, normal velocity was used as the initial velocity for the impactor. Because the MDB move in a
2.3.3 Battery housing system
The battery housing system consists of six battery packs, support structure, and plate structure (see Figure 9). Battery packs are taken from the validation model (see Chapter 2.2) with the same dimension, mesh, element formulation, material, and hourglass formulation. These battery packs were placed within the available spaces of the support structure (see Figure 7).

FIGURE 9. Support structure (A), Plate structure (B).
The support structure was modeled as
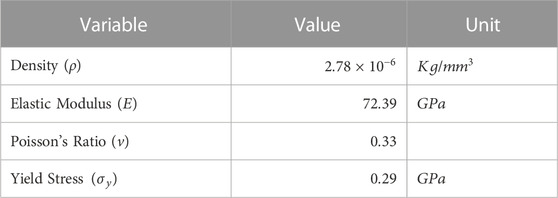
TABLE 4. Material property of Al 2024-T3 (Chen & Ingraffea, 2002).
2.3.4 Sandwich structure
The sandwich structure consists of two plate sandwich and an auxetic honeycomb as the core of the sandwich structure. The plate sandwich was modeled as a
Both plate sandwich and auxetic honeycomb were modeled using fully integrated shell element (ELFORM = 16), Equation 8 hourglass form that is only applicable to the type 16 fully integrated shell element, and piecewise linear plasticity (MAT_24) material model with Al 2024-T3 material property (summarized in Table 4; Supplementary Figure S3). The auxetic honeycomb was placed directly between the two plate sandwiches (see Figure 8).
2.3.5 Contact and control
There are five types of contact in system simulation.
- Automatic General applied to the sandwich structure in this simulation.
- Automatic Single Surface applied to the battery packs, support and plate structure.
- Automatic Surface to Surface applied between battery–support and plate structure, support and plate structure–impactor, support and plate structure–plate sandwich (front), and impactor–both plate sandwiches.
- Tied Shell Edge to Surface Beam Offset applied between support structure–plate structure, wall–support and plate structure, auxetic structure–both plate sandwiches, and plate sandwich (back)—support structure, and Interior applied to all battery packs.
The simulation’s control parameters are contact, energy, shell, termination, and timestep. Termination time of the simulation was calculated by Eq. 1. The simulation result was then rounded up to 2 decimal places. We found that this method is sufficient for most models except model no. 13, for which we have to add another
Where,
2.3.6 Post-processing
Data output from numerical simulation of model no. 1 will be used to demonstrate the post-processing of the simulation result. These steps were done to all numerical models to standardize and ensure the accuracy of the result.
SEA data was obtained by dividing the internal energy of the auxetic honeycomb when the impactor’s kinetic energy is minimum by the mass of the auxetic honeycomb (The comparison between the internal energy of the auxetic honeycomb and the impactor’s kinetic energy of model no. 1 is shown in Figure 10). This data was then inversed to obtain SEAinv data for optimization.
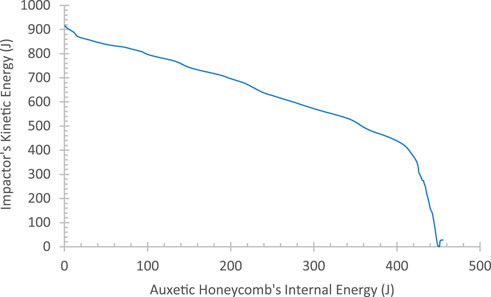
FIGURE 10. Impactor’s kinetic vs. auxetic honeycomb’s internal energy of model no. 1.
From now on, the battery’s von Mises stress will be abbreviated as Battery Stress. Battery stress data were obtained by picking the maximum von Mises stress of all battery packs at any time, where each battery’s location can be found in Figure 7. In the case of model no. 1, the maximum battery’s von Mises stress happened at
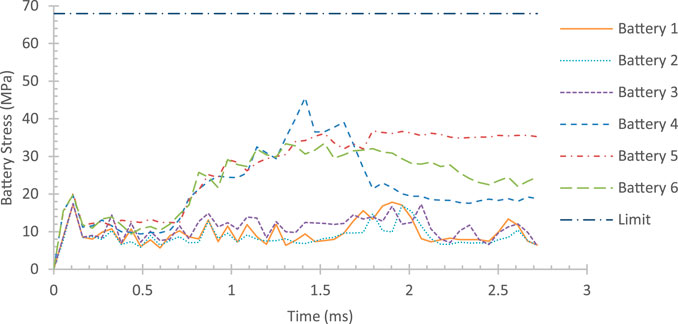
FIGURE 11. Battery’s von Mises Stress vs. time of system model no. 1.
The energy state and the detailed sum slave/master sliding energy were also checked to ensure the accuracy of the data (energy state of model no. 1 shown in Supplementary Figure S5).
2.4 Artificial neural network modeling
Two kinds of codes were used to develop the ANN model. The first kind is called optimization code, and the second kind is called validation code. The optimization code was used to help find the rough hyperparameter for the validation code using the Keras Tuner package (Keras Tuner, 2019). The validation code was used to fine-tune and develop the final ANN model for each output using the Tensorflow package with a callback mechanism (Abadi et al., 2015). Both were written in Google Colab.
The loss function was evaluated using the mean square error (MSE) equation, as written in Eq. 2.
The model’s performance is also assessed using maximum absolute percentage error (MAPE), which is written in Eq. 3.
2.5 NSGA-II and TOPSIS modeling
The optimization code was written in Google Colab using the Platypus package (Platypus, n.d.) with TOPSIS.
The NSGA-II part of the optimization code was set with
The TOPSIS part of the optimization code was set with the assumption that the weight of SEA inversed and battery stress are
The NSGA-II algorithm processed the combination of SEAinv and Stress predictor to obtain the Pareto Front curve, which shows the relation between SEAinv and Stress. Data points were generated by the NSGA-II algorithm and then fitted with regression to obtain the relation function between SEAinv and Stress.
3 Result and discussion
3.1 Predictor result (ANN)
3.1.1 SEAinv prediction
The neural network model for SEAinv prediction is pictured in Figure 12. The model consists of
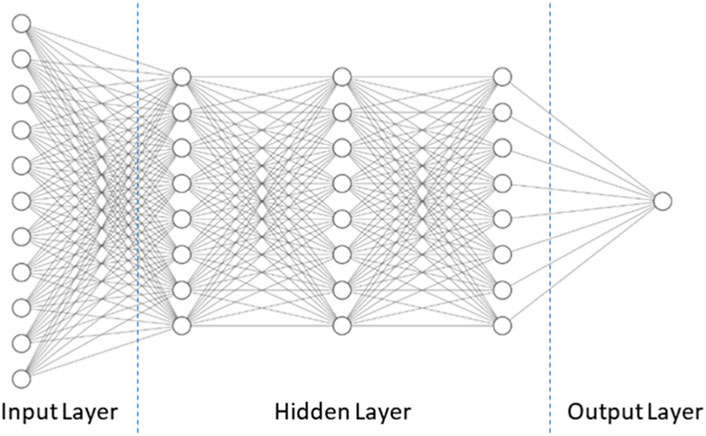
FIGURE 12. Neural network architecture for SEAinv prediction.
The training was done until a maximum of
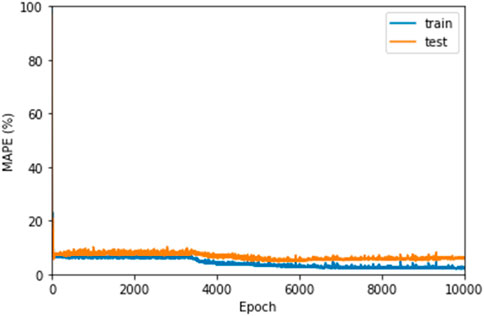
FIGURE 13. MAPE in ANN training of SEAinv predictor vs. Epoch.
3.1.2 Stress prediction
The neural network model for Stress prediction is visualized in Figure 14. The model consists of
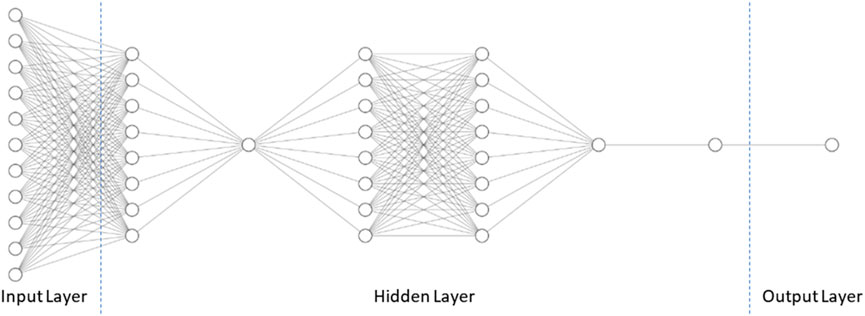
FIGURE 14. Neural network architecture for Stress prediction.
The training was done until a maximum of
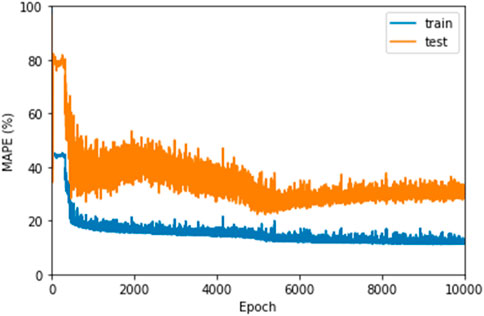
FIGURE 15. MAPE in ANN training of Stress predictor vs. Epoch.
3.2 Optimization result (NSGA-II and TOPSIS)
The Pareto Front curve shows the relation between SEAinv and Stress, shown in Figure 16. Data points in Pareto Front were fitted with regression function as shown in the black curve in Eq. 4. The regression fitted the data points with
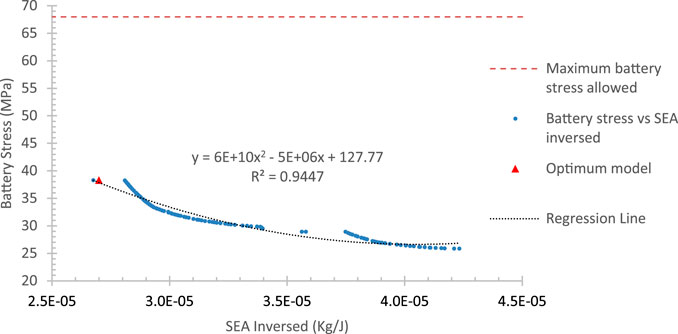
FIGURE 16. Pareto Front curve for battery stress vs. SEA inversed.
Figure 16 also shows the optimum point obtained by the TOPSIS method, with SEA of
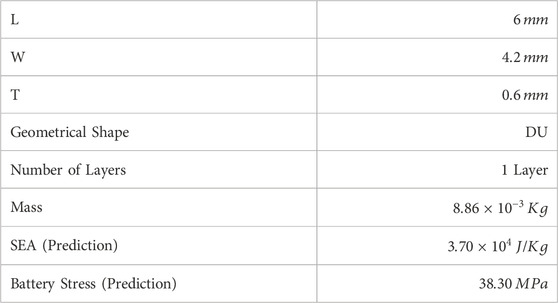
TABLE 5. Input parameter and output prediction of the optimum design.

FIGURE 17. CAD of optimum design.
This result is better than every model simulated in the design of experiment in Chapter 2.1. Model 71, which has the highest SEA over all other models that successfully protect the battery, has a SEA of
The optimum configuration was then numerically simulated with the same configuration in Chapter 2.3 to validate the optimization result, as shown in Supplementary Figure S6.
The comparison between prediction and numerical simulation results is shown in Table 6. The comparison shows that the error between prediction and validation results is still pretty big. It was found that the SEA of the optimum design is even higher than the prediction, but the maximum battery stress is lower than the prediction. However, the maximum battery stress of the optimum design is well within the safe limit of

TABLE 6. Validation and comparison of optimum design.
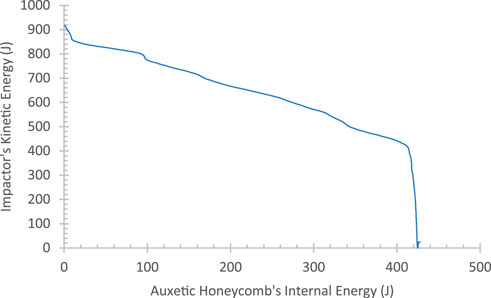
FIGURE 18. Impactor’s kinetic vs. auxetic honeycomb’s internal energy of the system with optimum design.
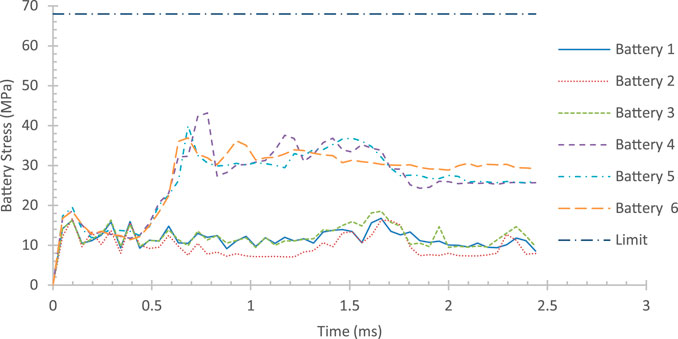
FIGURE 19. Battery’s von Mises Stress vs. time of system with optimum design.
Supplementary Figure S7 shows that the crash mechanics of the optimum design follows classical crash mechanics during vehicle impact, where there are zero crossing time of
Just as with every other numerical model done for the design of experiment, the energy state and the detailed sum slave/master sliding energy were checked on the optimum design’s validation result to ensure the accuracy of the obtained data, shown in Supplementary Figure S8. The total energy is almost in constant value over time, with the value ranging between
4 Conclusion
The research shows that the machine learning methods work well for battery protection design and multiple objective optimization, with small training data, limited computing power, and pretty accurate results.
The optimization results in a protector with an auxetic honeycomb that has a geometric shape of Double-U, length of
During impact, the auxetic structure (the core of the sandwich structure) has absorbed
Data availability statement
The raw data supporting the conclusions of this article will be made available by the authors, without undue reservation.
Author contributions
MB: Conceptualization, Methodology, Software, Validation, Formal Analysis, Investigation, Data Curation, Writing—Original Draft, Writing—Review and Editing, Visualization, Project Administration. SS: Conceptualization, Methodology, Validation, Resources, Writing—Original Draft, Writing—Review and Editing, Supervision, Project Administration, Funding Acquisition. DW: Methodology, Validation, Resources, Writing—Original Draft, Writing—Review and Editing, Supervision, Project Administration. All authors have read and agreed to the published version of the manuscript.
Funding
This research is fully funded by ITB Research Program managed by the Center for Research and Community Service (2022).
Acknowledgments
Thanks are due to Tom Wierzbicki and Dr. Juner Zhu of MIT for available discussion and collaboration in the battery safety research.
Conflict of interest
The authors declare that the research was conducted in the absence of any commercial or financial relationships that could be construed as a potential conflict of interest.
Publisher’s note
All claims expressed in this article are solely those of the authors and do not necessarily represent those of their affiliated organizations, or those of the publisher, the editors and the reviewers. Any product that may be evaluated in this article, or claim that may be made by its manufacturer, is not guaranteed or endorsed by the publisher.
Supplementary material
The Supplementary Material for this article can be found online at: https://www.frontiersin.org/articles/10.3389/fenrg.2023.1114263/full#supplementary-material
References
Abadi, M., Agarwal, A., Barham, P., Brevdo, E., Chen, Z., Citro, C., et al. (2015). TensorFlow: Large-scale machine learning on heterogeneous systems. Cornell Tech: arXiv. https://arxiv.org/abs/1603.04467v2.
Aluminum Extruders Council, , Electric Vehicle Battery Box. [Online], Available at: https://www.aec.org/page/electric-vehicle-battery-box[Accessed 21 July 2022].
Available at: Dynamore GmbH, (2021). LS-DYNA support. [Online] https://www.dynasupport.com/(Accessed May, 2021).
Available at: Pietsch, B. (2021). 2 killed in driverless tesla car crash, officials say. [Online] https://www.nytimes.com/2021/04/18/business/tesla-fatal-crash-texas.html (Accessed August 30, 2021).
Battery Power, , 2019. Thermal runaway: Understanding the fundamentals to ensure safer batteries. [Online], Available at: https://www.batterypoweronline.com/news/thermal-runaway-understanding-the-fundamentals-to-ensure-safer-batteries/, [Accessed 21 August 2021].
Battery University, , 2018. BU-204: How do lithium batteries work? [Online], Available at: https://batteryuniversity.com/index.php/learn/article/lithium_based_batteries[Accessed 28 October 2020].
Biharta, M. A. S., Santosa, S. P., Widagdo, D., and Gunawan, L. (2022). Design and optimization of lightweight lithium-ion battery protector with 3D auxetic meta structures. World Electr. Veh. J. 13 (7118), 118. doi:10.3390/wevj13070118
Bisschop, R., Willstrand, O., Amon, F., and Rosengren, M. (2019). Fire safety of lithium-ion batteries in road vehicles. Thane, Maharashtra, India: Diva.
Campbell, F. C. (2006). Manufacturing Technology for aerospace structural materials. Amsterdam, Netherlands: Elsevier.
Carakapurwa, F. E., and Santosa, S. P. (2022). Design optimization of auxetic structure for crashworthy pouch battery protection using machine learning method. Energies 15 (22), 8404. doi:10.3390/en15228404
Chen, C. S., and Ingraffea, A. R. (2002). Residual strength prediction of aircraft fuselages using crack-tip opening angle criterion. American Institute of Aeronautics and Astronautics Journal 40 (3), 566–575. doi:10.2514/3.15098
Cochrane, C., Rochery, M., and Hertleer, C., Auxetic structures., https://campus.mines-douai.fr/pluginfile.php/19034/mod_resource/content/0/CH2_en_mai_2013/co/ch2_5_2_en.html, [Accessed 28 October 2020].
Drew, C., and Mouawad, J. (2013). Safety board gives new details on boeing battery fire, but not cause. [Online] https://www.nytimes.com/2013/03/08/business/safety-board-reports-little-progress-in-787-inquiry.html (Accessed October 28, 2020).
Fischer, B. (2019). New car assesment Program (NCAP) moving deformable barrier side impact test, Audi AG, 2019 Audi e-tron quattro 5-door SUV, NHTSA No.: O20195805. Washington DC: U.S. Department of Transportation, National Highway Traffic Safety Administration.
Gao, Q., Liao, W.-H., and Wang, L., 2020. On the low-velocity impact responses of auxetic double arrowed honeycomb. Aerosp. Sci. Technol., January.Volume 98, 105698, doi:10.1016/j.ast.2020.105698
Gibson, L. J., and Ashby, M. F., 1997. Cellular solids: Structure and properties - second edtion. University of Cambridge, Cambridge, UK.
Guo, M.-F., Yang, H., and Ma, L. (2020). Design and analysis of 2D double-U auxetic honeycombs. Thin-Walled Struct. 155, 106915. doi:10.1016/j.tws.2020.106915
Hadka, D. A free and open source Python library for multiobjective optimization. https://github.com/Project-Platypus/Platypus#:∼:text=GitHub%20%2D%20Project%2DPlatypus%2FPlatypus,Python%20Library%20for%20Multiobjective%20Optimization.
Hertzke, P., Müller, N., Schenk, S., and Wu, T., 2018. The global electric-vehicle market is amped up and on the rise. [Online], Available at: https://www.mckinsey.com/industries/automotive-and-assembly/our-insights/the-global-electric-vehicle-market-is-amped-up-and-on-the-rise, [Accessed 28 October 2020].
Hou, Z., Huang, M., Leung, L. R., Lin, G., and Ricciuto, D. M. (2012). Sensitivity of surface flux simulations to hydrologic parameters based on an uncertainty quantification framework applied to the Community Land Model. J. Geophys. Res. Atmos. 117, 117. doi:10.1029/2012jd017521
Indeed Editorial Team, , 2021. What is speed to market and why is it important?, [Online], Available at: https://www.indeed.com/career-advice/career-development/speed-to-market, [Accessed 4 August 2022].
Keras Tuner, (2019). Keras Tuner. https://keras.io/keras_tuner/.
Kermani, G., Keshavarzi, M. M., and Sahraei, E., 2021. Deformation of lithium-ion batteries under axial loading: Analytical model and Representative Volume Element. Energy Reports, 19 February, Volume 7, p. 2849–2861. doi:10.1016/j.egyr.2021.05.015
Lakes, R. (1987). Foam structures with a negative Poisson's ratio. Science 235 (4792), 1038–1040. doi:10.1126/science.235.4792.1038
Li, X., Yin, X., Tian, Z., Jiang, X., Jiang, L., and Smith, J. 2022. Multi-layer state of health balancing control for a battery-based energy storage system to extend cycle life based on active equalization circuits. Front. Energy Res., 30 September.Volume 10, 10, doi:10.3389/fenrg.2022.966422
Ma, L., Chen, Y. L., Yang, J. S., Wang, X. T., Ma, G. L., Schmidt, R., et al. (2018). Modal characteristics and damping enhancement of carbon fiber composite auxetic double-arrow corrugated sandwich panels. Compos. Struct. 203, 539–550. doi:10.1016/j.compstruct.2018.07.006
Najafi, M., Ahmadi, H., and Liaghat, G. (2020). Experimental investigation on energy absorption of auxetic structures. Mater. Today Proc. 34, 350–355. doi:10.1016/j.matpr.2020.06.075
Philips, M., 2018. The present and future of AI in design (with infographic). [Online], Available at: https://www.toptal.com/designers/product-design/infographic-ai-in-design, [Accessed 4 August 2022].
Pratama, L. K., Dirgantara, T., Widagdo, D., and Santosa, S. P., 2021. Optimization of lattice Structure for lithium-ion battery protection system undergoing ground impact using machine learning method. s.l.:Master's thesis, Institut Teknologi Bandung, Jawa Barat, Indonesia.
Sahraei, E., Hill, R., and Wierzbicki, T. (2012). Calibration and finite element simulation of pouch lithium-ion batteries for mechanical integrity. J. Power Sources 201, 307–321. doi:10.1016/j.jpowsour.2011.10.094
Sakai, Y., and Ohsaki, M. (2021). Optimization method for shape design of Auxetic Bending-Active Gridshells using discrete differential geometry. Structures 34, 1589–1602. doi:10.1016/j.istruc.2021.08.067
Shi, T., Zhao, F., Hao, H., and Liu, Z. (2019). WCX SAE World Congress Experience. https://www.sae.org/publications/technical-papers/content/2019-01-0724/.Costs, benefits and range: Application of lightweight Technology in electric vehicles
Smith, J. (2005). Federal motor vehicle safety standards (FMVSS) No. 214 "side impact protection. Washington DC, USA: U.S. Departement of Transportation, National Highway Traffic Safety Administration.
Sun, P., Bisschop, R., Niu, H., and Huang, X. (2020). A Review of battery fires in electric vehicles. Fire Technology 56 (4), 1361–1410. doi:10.1007/s10694-019-00944-3
Wang, T., Wang, L., Ma, Z., and Hulbert, G. M. (2018). Elastic analysis of auxetic cellular structure consisting of re-entrant hexagonal cells using a strain-based expansion homogenization method. Mater. Des. 160, 284–293. doi:10.1016/j.matdes.2018.09.013
Wang, W., Dai, S., Zhao, W., Wang, C., and Ma, T. (2021). Design optimization of a novel negative Poisson's ratio non-module battery pack system considering crashworthiness and heat dissipation. Compos. Struct. 275, 114458. doi:10.1016/j.compstruct.2021.114458
Wisch, M., Ott, J., Thomson, R., Abert, M., and Yao, J. (2014). Recommendations and Guidelines for battery crash Safety and post-crash safe handling. https://www.diva-portal.org/smash/record.jsf?dswid=9548&pid=diva2%3A1367933.
Wu, X., Su, Y., and Shi, J. (2020). In-plane impact resistance enhancement with a graded cell-wall angle design for auxetic metamaterials. Compos. Struct. 247, 112451. doi:10.1016/j.compstruct.2020.112451
Xiao, D., Chen, X., Li, Y., Wu, W., and Fang, D. (2019). The structure response of sandwich beams with metallic auxetic honeycomb cores under localized impulsive loading-experiments and finite element analysis. Mater. Des. 176, 107840. doi:10.1016/j.matdes.2019.107840
Keywords: auxetic honeycomb, battery protection, crashworthiness, artificial neural network, NSGA-II
Citation: Biharta MAS, Santosa SP and Widagdo D (2023) Design and optimization of lithium-ion battery protector with auxetic honeycomb for in-plane impact using machine learning method. Front. Energy Res. 11:1114263. doi: 10.3389/fenrg.2023.1114263
Received: 02 December 2022; Accepted: 09 January 2023;
Published: 01 February 2023.
Edited by:
Fenghui Wang, Northwestern Polytechnical University, ChinaCopyright © 2023 Biharta, Santosa and Widagdo. This is an open-access article distributed under the terms of the Creative Commons Attribution License (CC BY). The use, distribution or reproduction in other forums is permitted, provided the original author(s) and the copyright owner(s) are credited and that the original publication in this journal is cited, in accordance with accepted academic practice. No use, distribution or reproduction is permitted which does not comply with these terms.
*Correspondence: Sigit Puji Santosa, c2lnaXQuc2FudG9zYUBpdGIuYWMuaWQ=