 Asif Durez
 Muzaffar Ali2
 Sudhakar Kumarasamy
- 1Mechanical Engineering Department, National University of Technology (NUTECH), Islamabad, Pakistan
- 2Mechanical Engineering Department, University of Engineering and Technology, Taxila, Pakistan
- 3U. S.-Pakistan Center for Advanced Studies in Energy (USPCAS-E), National University of Science and Technology (NUST), Islamabad, Pakistan
- 4Faculty of Mechanical and Automotive Engineering Technology, Universiti Malaysia, Pahang (UMP), Pekan, Pahang, Malaysia
- 5Centre of Excellence for Advanced Research in Fluid Flow (CARIFF), University Malaysia Pahang, Kuantan, Pahang, Malaysia
- 6Automotive Engineering Centre, Universiti Malaysia Pahang, Pekan, Pahang, Malaysia
To address the increasing energy demand, replacing conventional energy systems with non-conventional resources like solar power generation is crucial. Photovoltaic (PV) panels play a significant role in harnessing solar energy and converting it into electrical power. However, the solar cells’ temperature dramatically influences the panel’s performance, particularly in hot climates. In this study, a detailed mathematical model is developed and conducted simulations using three different phase change materials (PCMs)—RT21, RT35, and RT44—integrated with PV panels in various climate conditions worldwide during the summer season. An optimization model is also created using MATLAB and a genetic algorithm to identify the most suitable PCM for specific climate zones. The findings revealed that incorporating PCM resulted in a surface temperature reduction of PV panels, leading to a 6% increase in efficiency and a 16% boost in electrical output. Specifically, when using a PCM with a melting point of 21°C, the maximum cell temperature during summer operation decreased from 65°C to 38°C. Similar temperature reductions were observed when using PCMs with melting points of 35°C and 44°C. Current analysis demonstrates that the correct selection of a phase change material can decrease panel temperature by approximately 39% in June. Furthermore, PCM with a melting point of 21°C exhibited the best outcomes in terms of maximum electrical performance, efficiency, and PV cell temperature reduction.
1 Introduction
The rapid increase in world population has put immense pressure on energy systems as the demand for energy to support human activities and development continues to rise. In the last few decades, power generation and interest in PV systems have increased remarkably around the world because of both exhaustion of fossil fuels and environmental hazards (Othman et al., 2005). During the 10 years of 2010–2020, Photovoltaics are used immensely, with over 34% percent growth annually (Allouhi et al., 2022). In the record of changing solar energy into power, the PV system consented to both prerequisites, with no CO2 emanations (Kaiser et al., 2014). The rising temperature of the PV panel causes disturbance in the bandgap (Dwivedi et al., 2020). Due to this, the photo-generation rate of PV panels increases, and a minor increase in the current (Jiang et al., 2011. However, the reverse intensity current also additions quickly with temperature (Richardson and Harvey, 2015), reducing the efficiency of PV panels. Therefore, to improve efficiency, artificial cooling is used to control the panel’s temperature (Vasies et al., 2012). To decrease the surface temperature, the three most common cooling methods are used, i.e., fins, cooling of micro-channels, and water spraying on panel surfaces (Kermani, 2008). (Osmani et al., 2022) reveals that once the various characteristics of phase change materials (PCM) are recognized, a selection procedure is established that considers the melting temperature, latent heat, or thermal conductivity of the PCM. The findings reveal that Commercial PCM is the most favorable choice, followed by Organic PCM, primarily due to their superior chemical properties compared to Inorganic and Eutectic PCM. The measured power of solar PV depends mainly on temperature, solar irradiance, orientation or angle of the PV module, and other environmental parameters like humidity, dust, wind velocity and direction of the wind, etc. Therefore, the installer and designer require accurate information before installing PV modules in specific climates. An analysis showed that solar cell temperature dropped to 12°C using PV in combination with PCM, resulting in 1.6 times more energy than conventional (Maiti et al., 2011). It is evident from different research that the efficiency of PV cells reduces by 0.45% for every degree increase in temperature (Stritih, 2016). The experimental work (Bianchini et al., 2017) suggested that a maximum temperature drop of 35.6°C can be attained using a PCM-based PV panel system during autumn. With a melting point of 28°C, PCM can improve power generation by up to 7.5 percent. Another work indicated that a PCM layer was applied to PV back surface to enhance the output of the PV panel by 5% (Paoli et al., 2010). The above studies infer that PCMs help lower the surface temperature PV cell. If PCM solidifies entirely during non-working hours, maximum PCM advantages can be gained with any system, mainly PV system (Lozaro et al., 2009). (Shi et al., 2021) presented a method to design ionic liquid PCMs for thermal energy storage. Bhandwal and Tyagi, 2022 research stated that phase change material (PCM) is also used to maintain the temperature (Husain et al., 2017). Focuses on different analysis parameters analysis maximum power tracking. This serves as the basis for understanding different ways of power tracking. Solar energy, which is a clean and abundant new energy source, has broad application prospects (Rajendran et al., 2017; Amina et al., 2016). This paper elaborates on using solar energy to generate thermal energy and storage systems by proposing phase change materials as the collector fluid for the thermal energy storage system (Muruganantham and Balaji, 2021). The researcher (Shakibi et al., 2023) combines finned collectors with a nanoparticle-based phase change material (PCM) layer to enhance electricity generation in photovoltaic/thermal (PV/T) collectors. This combination results in 10%–24% of thermal efficiency improvements. Marudaipillai et al., 2023 investigated the comprehensive enhancement of thermal management and performance in cooling solar PV panels through experimental methods. This was achieved by utilizing a stable phase change material composed of polyethylene glycol and expanded graphite. The proposed PV panel demonstrated a noteworthy efficiency improvement of 3.667%, surpassing the conventional cooling technique (heat sink) with a mere 1.072% efficiency enhancement.
Chandel and Agarwal, 2017 studied the hazards and environmental challenges that can occur due to using PCMs. They presented an overview of major available PCMs and their applications. They found a lack of understanding about using PCMs and a requirement to enhance awareness of their use to tackle current challenges.
As of the author’s knowledge, the passive cooling technique of PV panels has not been as much in focus compared to the experimental setups. However, at the initial design stage, it is essential to analyze the most appropriate PCM material that provides maximum heat dissipation in a particular climate before the experimental setup, which becomes costly and time-consuming. Therefore, in the current study, a detailed model-based optimization approach is developed to analyze the most suitable PCM in a specific climate at the initial design stage, as mentioned in Table 1. A comprehensive mathematical model is developed and coded in MATLAB. Then Optimization is performed using a genetic algorithm in three climates worldwide where solar PV systems are already installed.
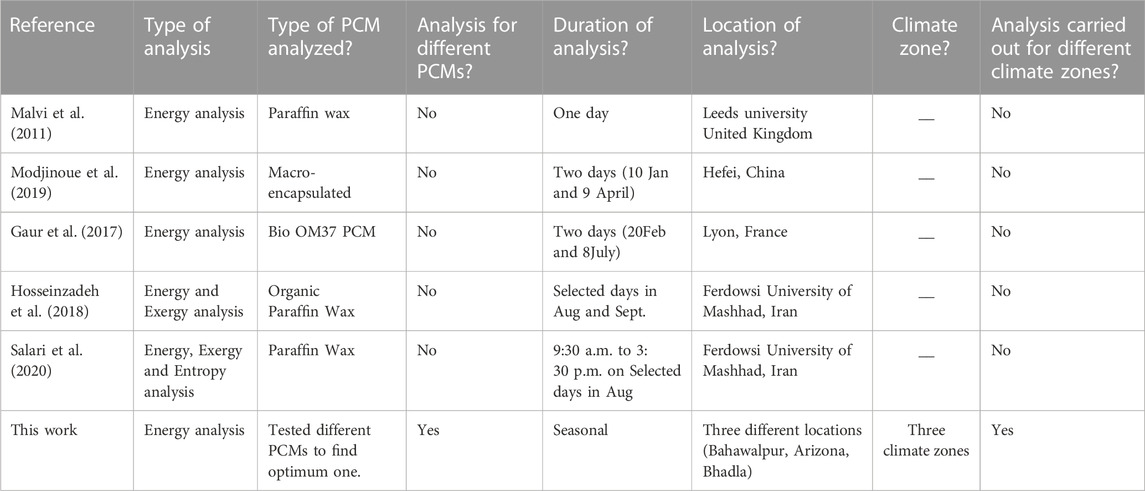
TABLE 1. Related Studies on PCM based PV cooling.
2 Methodology
A mathematical model is made based on heat transfer mechanisms involved in using PCMs on the rare side of PV cells. The climate data of the summer season, i.e., April to August, of the selected cities, including Bahawalpur-Pakistan, Bhadla-India, Arizona-United States, is integrated with the model to check the performance of different PCMs in different climatic conditions. Three PCMs, RT21, RT35 and RT44, are used in this study for analysis.
2.1 Model development
In this section, a mathematical model that is used for calculating the efficiency, panel temperature, and heat transfer mechanism in PCMs is discussed in detail. The model involves basic components of PV and PCM such as glass cover, Solar cell with EVA, and Tedlar and, subsequently their equations for energy balance as shown in Figure 1. The PCM is considered on the back side of the cell. The PV panel is placed on the roof of a building.
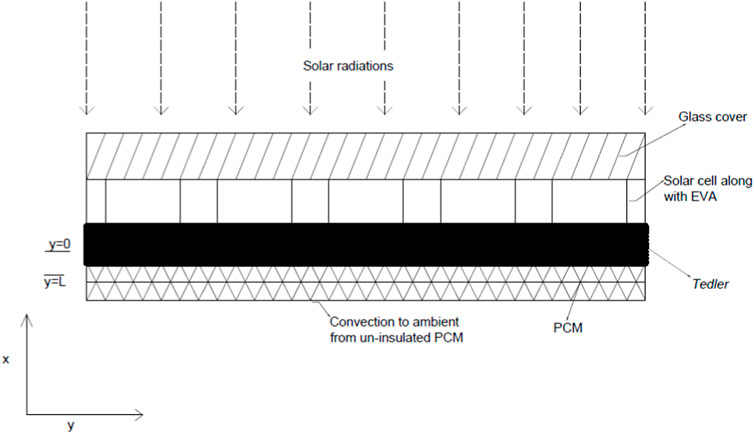
FIGURE 1. PCM-based PV panel.
2.1.1 Model for PV panel
Energy balance equations are based on the following assumptions.
• Transmissivity is not affected in the presence of EVA (Tonui and Tripanagnostopoulos, 2007).
• 1-Dimensional heat conduction estimation is used (Solanki et al., 2009).
2.1.2 Energy balance for glass cover
The energy balance equation incorporates that portion of solar radiation absorbed and depends on the glass cover. The convection coefficient of heat transfer due to air can be found using the relationship:
2.1.3 Energy balance for solar cells
The surface temperature of the panel is determined using the following expression, which applies to specific modules (Migan, 2013):
Eq. 3 is used to calculate the back-surface temperature
2.2 Mathematical model for PCM
In the current work, the enthalpy method is used to determine the temperature of PCM (Voller et al., 1987). Few assumptions are used for the heat transfer mechanism in PCM.
• Within PCM, heat is transferred only through conduction.
• Natural convection due to density difference is not considered. (Zivkovic and Fujii, 2001).
The liquid fraction (LF) indicates the state of PCM. LF = 0 indicates the solid phase of PCM(
The total enthalpy of the system can be determined from the following relations:
The relationship in equation-4 indicates that when PCM is in a solid phase, the latent heat of a material is zero, and the value is entirely due to its sensible heat. In the liquid state, total enthalpy is the mixture of latent heat and sensible heat where
Volumetric enthalpy is used to calculate the PCM temperature. “
The remaining unknown now is cell temperature with PCM “
Where A is the cell area,
Temperature related efficiency
The electrical output from Eq. 8 can be calculated using the relation mentioned in (Ji et al., 2008; Keliang et al., 2009)
2.2.1 Initial and boundary conditions
PCM is in solid-state before the start of simulation.
In Eq. 9, the boundary condition states that PCM is bound to the PV’s backside. Depending on the back-surface temperature of PV, heat is gained and lost from PCM at this point.
2.2.2 Types of PCMs
Commercially available PCMs-RT21, RT-35, and RT-44 at RUBITHERM GmbH (Rubitherm, 2020) are used for the study having a melting point of 20–23°C, 34–36°C, 43–44°C, respectively. PCMs are selected based on their efficiency. PCMs are included only in the study if their efficiency increases by 17% for the current study. All three chosen PCMs have an efficiency greater than 17% when combined with boundary conditions. Detailed properties of PCMs are given in Table 2. In addition, the properties of the panel are mentioned in Table 3.
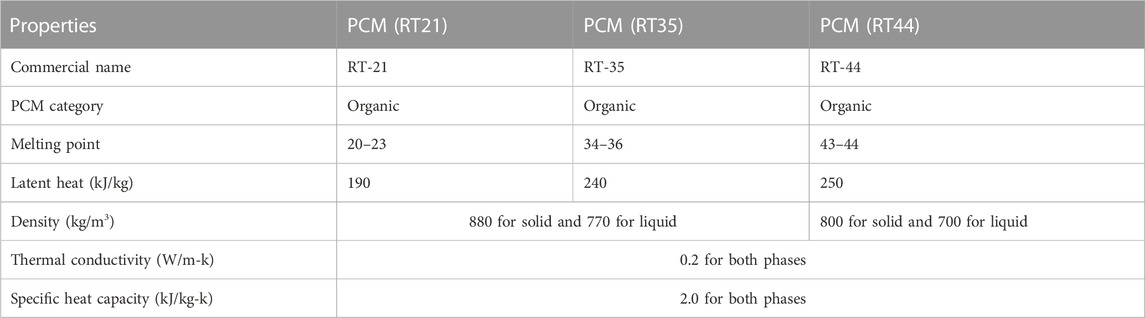
TABLE 2. Properties of PCMs.
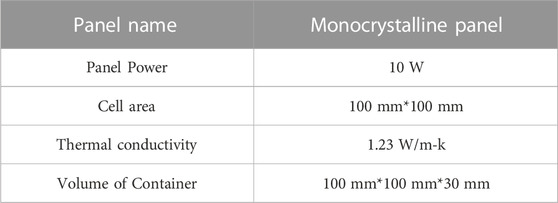
TABLE 3. Properties of PV panel.
3 Köppen climate classification
In the current study, three climates are considered for the analysis. This includes Köppen climate classification considered cities with Bwh (Hot desert climate) category, including Bahawalpur-Pakistan, Bhadla-India, Arizona-United States (Merra., 2020). Due to overheating panel surfaces, PV systems can face severe challenges in such environments. The main reason for selecting these areas is that solar parks are built there. This climate represents a desert region where summer is very hot and dry while winter is mild. All three cities have temperatures relatively different than others in the summer season. Along with city data, three PCMs are being used in this research. Due to overheating panel surfaces, PV systems can face severe challenges in such climates. The main reason for selecting these areas is that solar parks are built there. This climate represents a desert region where summer is very hot and dry while winter is mild. Figure 2 shows the climatic data for the current study for all seasonal analyses. It illustrates the ambient temperature, wind speed, and Solar radiation for the Apr-Aug months in those areas.
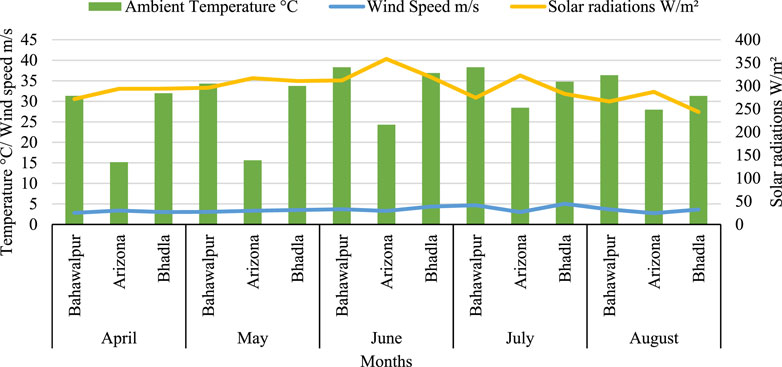
FIGURE 2. Seasonal Climatic data for the current study.
4 Model validation
Validation of the current computational model is presented in this section. PV temperature when PCM is attached to the back surface of the PV module is validated by the published results of (Ciulla et al., 2012). For this purpose, experimental values and data of PCM, PV cells, and solar radiation are used in the current model. The temperature of PV with PCM has been compared and validated from the published results, as shown in Figure 3. In the recent analysis, results of PCM with a melting point of 35°C are compared with experimental results. It can be observed that the model developed in this work effectively reduces the temperature of the PV panel on 19th June. Using data from published results, the current study model predicted the PV temperature of the panel using phase change materials. Results suggest that the computational model has the same behavior as the published experimental results for June in Palermo-Italy. Overall, the trend of the predicted result is very similar to the experimental result, and it makes the model capable of predicting the results of PV panels using PCM as a heat sink. Further, to compare the experimental and the simulated results, root mean square percent deviation (e) and a correlation coefficient (r) have been evaluated using Eqs 10, 11 (Bahaidarah et al., 2013). Root mean square percent deviation (e) and a correlation coefficient (r) are the statistical indicators generally used to validate the experimental and modeling results.
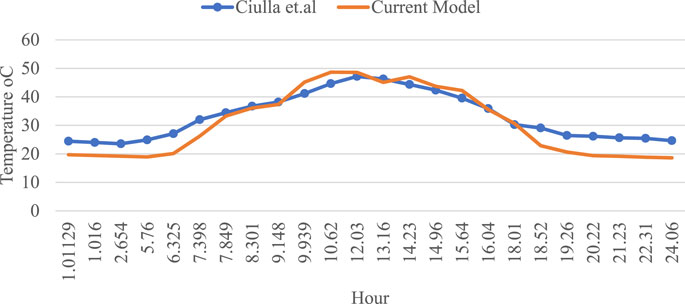
FIGURE 3. Comparison of PV cell temperature integrated with Ciulla et al., 2012.
The numerical results predicted by the current model and experimental results with a correlation coefficient (r) = 0.967 and root mean square percent deviation (e) = 2.2% is obtained. This demonstrates that the model can predict the PV temperature with reasonable accuracy.
5 Results and discussion
5.1 Effect of PCMs on PV cell temperature
Firstly, the PCM behavior is analyzed regarding the PV cell’s temperature. Figure 4 displays the average cell temperature of PV with and without PCMs in all cities using PCM with a melting point of 21, 35 and 44. It is evident that phase change materials have significantly reduced the PV cell temperature in all areas throughout the season, especially in Bahawalpur and Bhadla regions, with comparatively higher temperatures than others. However, based on Figure 4, the maximum temperature drop has been observed through PCM RT-21, where the temperature has dropped about 23.6% (Case of Bahawalpur in April). This decrease for PCM RT-35 and RT-44 is 13.1% and 15.7%, respectively, thus reflecting their comparatively low effectiveness. Further, it should also be noted that this temperature decrease depends on a specific area and its peak temperature. Since Bhadla has the highest average peak temperature of around 40°C, it has experienced the most significant drop in each category of PCMs.
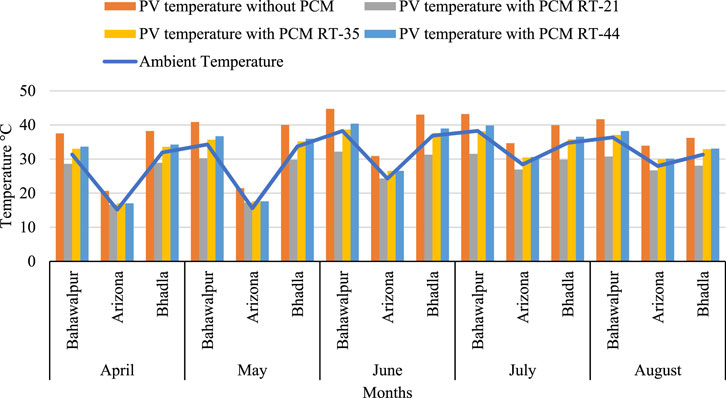
FIGURE 4. Average temp. of PV cell with and without PCMs for Seasonal analysis (Apr-Aug).
5.2 Effect of PCMs on efficiency
This section analyzes and discusses the effects of PCMs on PV cell efficiency. Based on the model results, solar PV efficiency appears to be a direct index of the surface temperature drop. A drop in surface temperature proportionally increases solar PV efficiency. Figure 5 displays the average cell efficiency of PV with and without PCMs in all cities using all three PCMs. It is evident that PCMs have significantly increased PV cell efficiency in all areas throughout the season. Especially in Bahawalpur and Bhadla regions, RT-21 has considerably increased cell efficiency. It is evident from Figure 5, that PCM RT-35 has increased the PV cell efficiency significantly in all areas throughout the season. Especially in Bahawalpur and Bhadla regions, RT-35 has considerably increased cell efficiency. PCM RT-44 has dramatically increased PV cell efficiency in all areas throughout the season.
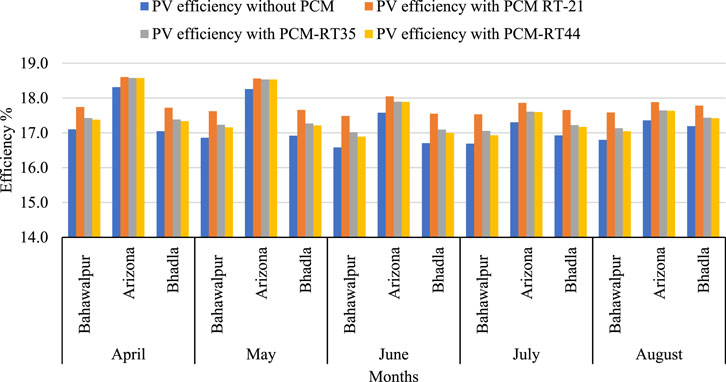
FIGURE 5. Average efficiency of PV cell with and without PCMs for Seasonal analysis(Apr-Aug).
5.3 Effect of PCMs on electrical output
This section discusses the influence of PCMs on the electrical output of Photovoltaic cell temperature. Figure 6 depicts the average power output of PV with and without PCMs in all cities using PCM with a melting point of 21. It can be seen from Figure 6 that all three PCMs have increased the PV cell output significantly in all areas throughout the season. As shown in Figure 6, Arizona’s optimum power output in the month of June is higher due to high temperature.
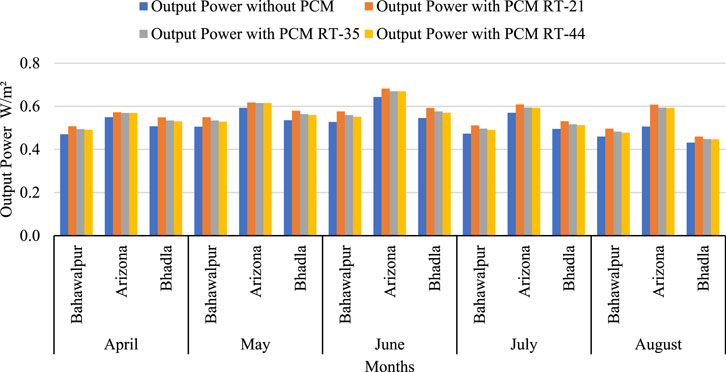
FIGURE 6. Average output of PV cell with and without PCMs for Seasonal analysis (Apr-Aug).
Peak Temperatures, Maximum efficiencies, and Maximum electric output of PV cells using all three PCMs in three cities for seasonal analysis are tabulated in Table 4, Table 5 and Table 6.

TABLE 4. Temperature, Efficiency, and output of PV cell with and without PCM RT21 for season analysis.

TABLE 5. Temperature, Efficiency, and output of PV cell with and without PCM RT35 for season analysis.

TABLE 6. Temperature, Efficiency, and output of PV cell with and without PCM RT44 for season analysis.
5.4 Optimization
The program for the whole process is developed in MATLAB. The enthalpy method is used to design the system. Optimization starts with writing an objective function (elec_eff_pcm) in which input (wind velocity, melting temperature of PCM, mass of PCM) and output parameters (electric output and efficiency) are considered. Moving forward to the main script, mention the name of the process (Modeling and Optimization of PV Panels). The next step is introducing that objective function and the number of variables which is three in this model, i.e., wind velocity, mass of the PCM, and melting temperature of the PCM. Using a Genetic Algorithm requires an objective function and several variables. In this work, a genetic algorithm is used to check the optimum values of wind speed, melting temperature, and mass of PCMs against respective cities at which maximum efficiency and maximum electrical output can be achieved.
5.4.1 Effect of PCMs on the efficiency of PV cell
It is observed from Figure 7 that PCM-RT21 gives the best possible efficiency of almost 19% for the Apr-Aug season in all regions. While PCM-RT35 offers 18.8%, and PCM-RT44 results in the best possible efficiency of approx. 18.6%. Optimum values of PCM RT-35 have increased the PV cell efficiency in all areas throughout the season. Especially in Bahawalpur and Bhadla regions, RT-35 has considerably increased cell efficiency. The optimal values of parameters are mentioned in Table 7 in detail. Overall, PCM-RT21 is effective in increasing the efficiency of PV panels. It indicates that the phase change material melting at 21°C has recorded more efficiency than all other PCMs used in the analysis.
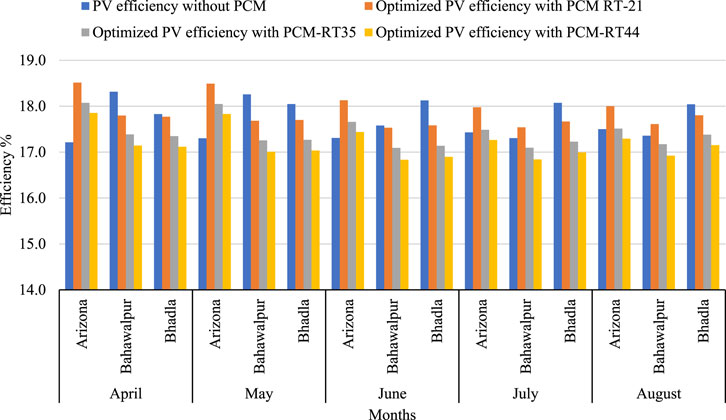
FIGURE 7. Average efficiency of PV cell with and without PCM-RT21, RT35 and RT44 under optimized conditions for Seasonal analysis (Apr-Aug).

TABLE 7. Optimal values of input parameters for seasonal analysis.
5.4.2 Effect of PCMs on electrical output of PV cell
The effect of PCMs on PV cell output under optimum conditions is shown in Figure 8. It presents the average optimized cell output of PV with and without PCMs in all selected cities. PCM-RT21 provides the best possible output of almost 2.11 W/m2 for the Apr-Aug season in all regions. While PCM-RT35 gives 2 W/m2 and PCM-RT44 offers the best potential output of approx. 1.8–1.9 W/m2. Optimum values of PCM RT-35 have increased the PV cell electrical output significantly in all areas throughout the season.
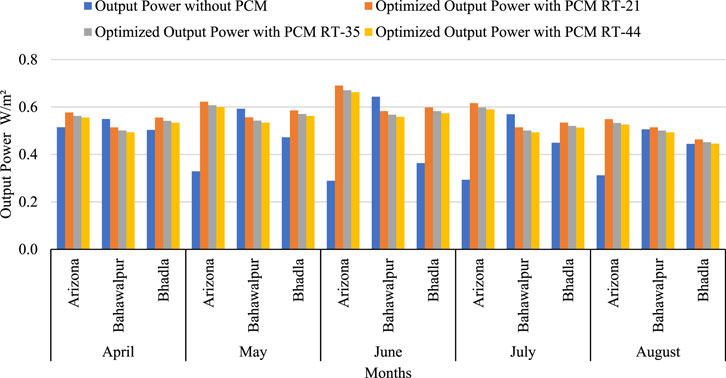
FIGURE 8. Average output of PV cell with and without PCM-RT21, RT35 and RT44 under optimized conditions for Seasonal analysis (Apr-Aug).
In the case of PV without PCM, the temperature of PV is equal to the ambient temperature before sunshine hours. This remains the same until radiations are absorbed, reaching maximum level and then returning to its position without radiations. Thus, peaks of PV coincide with those of ambient temperature. The results confirm that using PCM drops down PV temperature, which is confirmed through literature where authors highlighted that selecting suitable PCM could only improve Panels’ thermal management. Results are on the lower side when there’s minimum solar radiation. This concludes that thermal management is impossible when no or minimum solar radiation is available.
6 Conclusion
It is observed that during the summer season, PCMs function efficiently in lowering the PV cells. Using PCMs during the summer season reduces cell temperature by up to 27°C. This reduction increases PV panel performance by up to 6%. The results indicate that PV panels observed a drop in surface temperature by using PCM that caused an increase in efficiency and electrical output by 6% and 16%, respectively. In terms of optimal parameters, if the wind is 10–11 m/s, a melting temperature of 21–22°C gives the best possible results. What is interesting here is the mass of PCM used, which is around 2.7–2.8 gms in capacity on the excellent quality output. In an experimental setup, using two or three PCMs at a time to check which is the best according to specific climatic conditions, setup becomes costly and time-consuming. Using this comprehensive model well before practical implementation saves time and cost. In the current analysis, to achieve maximum electrical efficiency and lower PV cell surface temperature, PCM with 21°C melting point provides the best result. When PCM is not chosen correctly, it affects the performance of the PV panel but can also harm the PV cells due to high temperatures, becoming costly and time-consuming. When different PCMs are used in Bahawalpur during monthly analysis, PCM-RT21 drops the PV cell temperature by almost 36%, more than the other two PCMs used in the monthly study in Bahawalpur. After Optimization, it is concluded that PCM-RT21 is the most appropriate for passive cooling of PV systems for climate classification (Bwh). The current work can be extended by considering the complete cooling cycle. Parameters of economic analysis can also be added to extend this research work.
Data availability statement
The raw data supporting the conclusion of this article will be made available by the authors, without undue reservation.
Author contributions
All authors listed have made a substantial, direct, and intellectual contribution to the work and approved it for publication.
Funding
We extend our sincere gratitude to the National University of Technology (NUTECH), University of Engineering and Technology, Taxila, National University of Science and Technology (NUST), Pakistan, for the Technical support and Universiti Malaysia Pahang (www.ump.edu.my), Malaysia for the project fund (Grant ID: RDU210351).
Conflict of interest
The authors declare that the research was conducted in the absence of any commercial or financial relationships that could be construed as a potential conflict of interest.
Publisher’s note
All claims expressed in this article are solely those of the authors and do not necessarily represent those of their affiliated organizations, or those of the publisher, the editors and the reviewers. Any product that may be evaluated in this article, or claim that may be made by its manufacturer, is not guaranteed or endorsed by the publisher.
References
Allouhi, A., Rehman, S., Buker, M. S., and Said, Z. (2022). Up-to-date literature review on Solar PV systems: Technology progress, market status and R&D. J. Clean. Prod. 362, 132339. doi:10.1016/j.jclepro.2022.132339
Amina, B., Miloud, A., Samir, L., Abdelylah, B., and Solano, J. P. (2016). Heat transfer enhancement in a parabolic trough solar receiver using longitudinal fins and nanofluids. J. Therm. Sci. 25 (5), 410–417. doi:10.1007/s11630-016-0878-3
Bahaidarah, H., Subhan, A., Gandhidasan, P., and Rehman, S. (2013). Performance evaluation of a PV (photovoltaic) module by back surface water cooling for hot climatic conditions. Energy 59, 445–453. doi:10.1016/j.energy.2013.07.050
Bhandwal, M., and Tyagi, R. K. (2022). Disambiguation of catalytic converter with fluid compounds using automation and reducing cold start time with PCM. J. Eng. Res. 10. doi:10.36909/jer.ICMET.17195
Bianchini, A., Guzzini, A., Pellegrini, M., and Saccani, C. (2017). Photovoltaic/thermal (PV/T) solar system: Experimental measurements, performance analysis and economic assessment. Renew. Energy 111, 543–555. doi:10.1016/j.renene.2017.04.051
Chandel, S. S., and Agarwal, T. (2017). Review of cooling techniques using phase change materials for enhancing efficiency of photovoltaic power systems. Renew. Sustain. Energy Rev. 73, 1342–1351. doi:10.1016/j.rser.2017.02.001
Chandel, S. S., and Agarwal, T. (2017). Review of current state of research on energy storage, toxicity, health hazards and commercialization of phase changing materials. Renew. Sustain. Energy Rev. 67, 581–596. doi:10.1016/j.rser.2016.09.070
Ciulla, G., Brano, V. L., Cellura, M., Franzitta, V., and Milone, D. (2012). A finite difference model of a PV-PCM system. Energy Procedia 30, 198–206. doi:10.1016/j.egypro.2012.11.024
Dubey, S., and Tiwari, G. N. (2008). Thermal modeling of a combined system of photovoltaic thermal (PV/T) solar water heater. Sol. energy 82 (7), 602–612. doi:10.1016/j.solener.2008.02.005
Dwivedi, P., Sudhakar, K., Soni, A., Solomin, E., and Kirpichnikova, I. (2020). Advanced cooling techniques of PV modules: A state of art. Case Stud. Therm. Eng. 21, 100674. doi:10.1016/j.csite.2020.100674
Gaur, A., Ménézo, C., and Giroux, S. (2017). Numerical studies on thermal and electrical performance of a fully wetted absorber PVT collector with PCM as a storage medium. Renew. Energy 109, 168–187. doi:10.1016/j.renene.2017.01.062
Hosseinzadeh, M., Sardarabadi, M., and Passandideh-Fard, M. (2018). Energy and exergy analysis of nanofluid based photovoltaic thermal system integrated with phase change material. Energy 147, 636–647. doi:10.1016/j.energy.2018.01.073
Husain, M. A., Tariq, A., Hameed, S., Arif, M. S. B., and Jain, A. (2017). Comparative assessment of maximum power point tracking procedures for photovoltaic systems. Green Energy and Environ. 2 (1), 5–17. doi:10.1016/j.gee.2016.11.001
Ji, J., Liu, K., Chow, T. T., Pei, G., He, W., and He, H. (2008). Performance analysis of a photovoltaic heat pump. Appl. Energy 85 (8), 680–693. doi:10.1016/j.apenergy.2008.01.003
Jiang, H., Lu, L., and Sun, K. (2011). Experimental investigation of the impact of airborne dust deposition on the performance of solar photovoltaic (PV) modules. Atmos. Environ. 45 (25), 4299–4304. doi:10.1016/j.atmosenv.2011.04.084
Kaiser, A. S., Zamora, B., Mazón, R., García, J. R., and Vera, F. (2014). Experimental study of cooling BIPV modules by forced convection in the air channel. Appl. Energy 135, 88–97. doi:10.1016/j.apenergy.2014.08.079
Keliang, L., Jie, J., Tin-tai, C., Gang, P., Hanfeng, H., Aiguo, J., et al. (2009). Performance study of a photovoltaic solar assisted heat pump with variable-frequency compressor–a case study in Tibet. Renew. Energy 34 (12), 2680–2687. doi:10.1016/j.renene.2009.04.031
Kermani, E. (2008). Manifold micro-channel cooling of photovoltaic cells for high efficiency solar energy conversion systems. College Park: University of Maryland.
Lazaro, A., Dolado, P., Marín, J. M., and Zalba, B. (2009). PCM–air heat exchangers for free-cooling applications in buildings: Experimental results of two real-scale prototypes. Energy Convers. Manag. 50 (3), 439–443. doi:10.1016/j.enconman.2008.11.002
Maiti, S., Banerjee, S., Vyas, K., Patel, P., and Ghosh, P. K. (2011). Self regulation of photovoltaic module temperature in V-trough using a metal–wax composite phase change matrix. Sol. energy 85 (9), 1805–1816. doi:10.1016/j.solener.2011.04.021
Malvi, C. S., Dixon-Hardy, D. W., and Crook, R. (2011). Energy balance model of combined photovoltaic solar-thermal system incorporating phase change material. Sol. Energy 85 (7), 1440–1446. doi:10.1016/j.solener.2011.03.027
Marudaipillai, S. K., Karuppudayar Ramaraj, B., Kottala, R. K., and Lakshmanan, M. (2023). Experimental study on thermal management and performance improvement of solar PV panel cooling using form stable phase change material. Energy Sources, Part A Recovery, Util. Environ. Eff. 45 (1), 160–177. doi:10.1080/15567036.2020.1806409
Migan, G. A. (2013). Study of the operating temperature of a PV module. Sweden: Project Report, 140.
Modjinou, M., Ji, J., Yuan, W., Zhou, F., Holliday, S., Waqas, A., et al. (2019). Performance comparison of encapsulated PCM PV/T, microchannel heat pipe PV/T and conventional PV/T systems. Energy 166, 1249–1266. doi:10.1016/j.energy.2018.10.007
Muruganantham, P., and Balaji, D. (2021). Optimal forecasting of thermal conductivity and storage in parabolic trough collector using phase change materials. J. Eng. Res. 9 (2). doi:10.36909/jer.v9i2.7706
Osmani, K., Ramadan, M., Haddad, A., Lemenand, T., and Castanier, B. (2022). An overview on the use of phase change material (PCM) for PV cooling. Key Eng. Mater. 922, 3–9. doi:10.4028/p-t2m41c
Othman, M. Y. H., Yatim, B., Sopian, K., and Bakar, M. N. A. (2005). Performance analysis of a double-pass photovoltaic/thermal (PV/T) solar collector with CPC and fins. Renew. energy 30 (13), 2005–2017. doi:10.1016/j.renene.2004.10.007
Paoli, C., Voyant, C., Muselli, M., and Nivet, M. L. (2010). Forecasting of preprocessed daily solar radiation time series using neural networks. Sol. energy 84 (12), 2146–2160. doi:10.1016/j.solener.2010.08.011
Rajendran, D. R., Sundaram, E. G., and Jawahar, P. (2017). Experimental studies on the thermal performance of a parabolic dish solar receiver with the heat transfer fluids SiC+ water nano fluid and water. J. Therm. Sci. 26 (3), 263–272. doi:10.1007/s11630-017-0938-3
Richardson, D. B., and Harvey, L. D. D. (2015). Strategies for correlating solar PV array production with electricity demand. Renew. Energy 76, 432–440. doi:10.1016/j.renene.2014.11.053
Rubitherm Technologies GmbH (2020). We love PCM.They also? Available at: www.rubitherm.com.
Salari, A., Kazemian, A., Ma, T., Hakkaki-Fard, A., and Peng, J. (2020). Nanofluid based photovoltaic thermal systems integrated with phase change materials: Numerical simulation and thermodynamic analysis. Energy Convers. Manag. 205, 112384. doi:10.1016/j.enconman.2019.112384
Shakibi, H., Shokri, A., Sobhani, B., and Yari, M. (2023). Numerical analysis and Optimization of a novel photovoltaic thermal solar unit improved by Nano-PCM as an energy storage media and finned collector. Renew. Sustain. Energy Rev. 179, 113230. doi:10.1016/j.rser.2023.113230
Shi, H., Zhang, X., Sundmacher, K., and Zhou, T. (2021). Model-based optimal design of phase change ionic liquids for efficient thermal energy storage. Green Energy and Environ. 6 (3), 392–404. doi:10.1016/j.gee.2020.12.017
Solanki, S. C., Dubey, S., and Tiwari, A. (2009). Indoor simulation and testing of photovoltaic thermal (PV/T) air collectors. Appl. energy 86 (11), 2421–2428. doi:10.1016/j.apenergy.2009.03.013
Stritih, U. (2016). Increasing the efficiency of PV panel with the use of PCM. Renew. Energy 97, 671–679. doi:10.1016/j.renene.2016.06.011
The Modern-Era Retrospective analysis for Research and Applications (2020). (MERRA-2). Version 2. Available at: http://www.soda-pro.com/web-services/meteo-data/merra (accessed September 17, 2020).
Tonui, J. K., and Tripanagnostopoulos, Y. (2007). Improved PV/T solar collectors with heat extraction by forced or natural air circulation. Renew. energy 32 (4), 623–637. doi:10.1016/j.renene.2006.03.006
Vasies, G., Axinte, E., and Teleman, E. C. (2012). Numerical simulation of wind action on solar panel placed on flat roofs with and without parapet. Bul. Institutului Politehnic Din. Lasi. Sect. Constr. Arhit. 58 (1), 139.
Voller, V. R., Cross, M., and Markatos, N. C. (1987). An enthalpy method for convection/diffusion phase change. Int. J. Numer. methods Eng. 24 (1), 271–284. doi:10.1002/nme.1620240119
Waqas, A., and Jie, J. (2018). Effectiveness of phase change material for cooling of photovoltaic panel for hot climate. J. Sol. Energy Eng. 140 (4). doi:10.1115/1.4039550
Keywords: solar PV panel, phase change material, surface temperature, climate conditions, seasonal, monthly and daily simulation, model development and optimization
Citation: Durez A, Ali M, Waqas A, Nazir K and Kumarasamy S (2023) Modelling and optimization of phase change materials (PCM)-based passive cooling of solar PV panels in multi climate conditions. Front. Energy Res. 11:1121138. doi: 10.3389/fenrg.2023.1121138
Received: 11 December 2022; Accepted: 16 June 2023;
Published: 30 June 2023.
Edited by:
Mohammadreza Aghaei, Norwegian University of Science and Technology, NorwayReviewed by:
Shyam. Singh Chandel, Shoolini University, IndiaHamdani Umar, Syiah Kuala University, Indonesia
Copyright © 2023 Durez, Ali, Waqas, Nazir and Kumarasamy. This is an open-access article distributed under the terms of the Creative Commons Attribution License (CC BY). The use, distribution or reproduction in other forums is permitted, provided the original author(s) and the copyright owner(s) are credited and that the original publication in this journal is cited, in accordance with accepted academic practice. No use, distribution or reproduction is permitted which does not comply with these terms.
*Correspondence: Sudhakar Kumarasamy, c3VkaGFrYXJAdW1wLmVkdS5teQ==; Asif Durez, YXNpZmR1cmV6QG51dGVjaC5lZHUucGs=