 Cong Zhang
 Ke Peng
 Xinhui Zhang
 Yan Jiang
- School of Electronic Engineering, Shandong University of Technology, Zibo, China
With the increasing number of electric vehicles, a large number of charging loads connected to the power system will have an impact on the economic and safe operation of the power system. In this paper a day-ahead optimal dispatching method for distribution network (DN) with fast charging station (FCS) integrated with photovoltaic (PV) and energy storage (ES) is proposed to deal with the negative impact of FCS on DN. By adjusting the load distribution of DN through the optimization decision of ES and soft open points (SOP), the operation level of DN is improved. Firstly, based on the historical vehicle travel data, Monte Carlo simulation method (MCSM) is applied to realize the simulation of fast charging load. Secondly, the uncertainties of PV power is addressed via a robust optimization model of the economic operation level of DN. Based on the second order cone relaxation and duality theory, a two-stage optimal dispatching model of DN is proposed. The optimization model is divided into main problem (MP) and sub problem (SP). For MP, the access position of FCS is adjusted based on SOP. And the charging and discharging power of ES is adjusted. The load distribution is optimized. For SP, based on the uncertainty of PV, the worst scenario of DN is calculated. The robustness of the proposed strategy is guaranteed. Finally, the proposed is verified based on the IEEE 33 bus system and a road network with 34 nodes. The simulation results show that the proposed method can effectively relieve line congestion of DN. The operating range of the voltage is better optimized. And the operation cost of DN is reduced significantly.
1 Introduction
Electric vehicles (EVs) are regarded as one of the important ways to alleviate the energy crisis and reduce carbon emissions (Li et al., 2021). However, the charging load of EVs has greater randomness. When large-scale charging loads are connected to distribution network (DN), the safe and economic operation of the distribution network will face huge challenges. The random of charging time and charging place will lead to the increase of network loss, line congestion (Zhang et al., 2021). Therefore, it is necessary to study the charging load modeling of FCSs and its related regulation methods.
On the one hand, charging load modeling is the basis for conducting research on related optimal scheduling methods. At present, most scholars mainly study charging load modeling from spatiotemporal dimension (Chaudhari et al., 2018). According to the measured vehicles arrival data, a charging load estimation model was established, and the model was solved based on Voronoi method (Biviji et al., 2014; Zhang et al., 2017). At the same time, according to the daily load, the time of use tariff mechanism was established to influence the temporal and spatial distribution of charging load through charging price. Although the price factor was considered, the charging station information and road condition information were not considered. The statistical modeling method is applied to obtain the probability distribution of the parameters related to the charging behavior of EVs, such as initial charging time and state of charge (SOC). And Monte Carlo simulation method (MCSM) is applied to obtain the charging load of EVs (Su et al., 2019). However, in the above literature the method based on temporal dimension is applied to predict the charging demand. The spatio-temporal characteristics of EVs are modeled based on Markov chain. And the charging load probability model of FCSs is obtained (Shen et al., 2022). But the behavior simulation of electric vehicles on the road is lacking.
On the other hand, renewable energy distribution generations are widely used to reduce the dependence on traditional energy and relieve the power supply pressure of power system (Li et al., 2022). In order to reduce the impact of charging load on the distribution network, a predictive voltage/reactive power optimization method based on time range considering the uncertainty of photovoltaic (PV) and load is proposed under different penetration rates of electric vehicles (Singh et al., 2019). The user equilibrium (UE) model of the road network (RN) is applied to plan the travel path of EVs. Base on the randomness of charging load, a robust optimization model (RO) of distribution network coupled with the transport system is proposed (Wu et al., 2017). But the time-varying of charging load is neglected. In order to mitigate the impact of electric vehicle charging on the power system, A. (Zahedmanesh et al., 2020) proposed a coherent horizon energy management (CHEM) process is proposed. FCSs can relieve the fluctuation of charging load through energy storage system (ESS). At the same time, the power system can realize the calculation of the economic operation of FCSs and realize the elastic distributed control of FCSs. Bryden T. S, (2019) established the relationship between the energy storage capacity and the charging waiting time for FCSs. The impact of charging load on the power system has been mitigated to a certain extent. The authors (Shao et al., 2019) proposed a two-layer queue model to simulate the dynamic queue of FCS. The dynamic electricity price demand function was used to establish the charging price model, and the objective is to minimize the charging cost of users to guide users to choose fast charging stations. However, the above literatures only considered the dispatching problem of a single electric vehicle, and did not consider the impact of a large number of EVs on road network and power system.
In addition, energy storage (ES) is one of the important measures to mitigate the impact of FCSs on distribution network. Considering the load characteristics of EVs, a optimal dispatching strategy of distribution network considering fast charging stations integrated with energy storage, which greatly is proposed to reduce the economic operation cost (Fan et al., 2019). At the same time, soft open points (SOP) can continuously control the active power flow between feeders to realize the interconnection between two feeders (Li et al., 2017; Ivic and Stefanov, 2021; Liu and Wang, 2021). A two-stage optimization strategy based on SOP is proposed to reduce the impact of load alternating attacks (LAA) on the distribution network (Liu et al., 2022). And a real-time voltage and VAR control (VVC) strategy based on SOP is proposed for active distribution network to meet the requirements of rapid voltage regulation.
Therefore, in order to further mitigate the impact of fast charging stations on the distribution network, the main work of this paper is as follows:
(1) In order to more accurately describe the charging load, a charge load modeling method based MCSM is proposed. According to the spatio-temporal characteristics of the road network, the operation state of the road network is divided into static road network state and dynamic road network state. The static road network state describes the connection state of the road network. Based on the static road network state, the travel routes of EVs will be simulated. Dynamic road network state describes the traffic state of the road network. Based on the dynamic road network state, the travel time of EVs will be simulated. Based on the spatio-temporal characteristics of the road network and historical travel data, the MCSM is used to realize the charging load modeling of FCSs.
(2) An optimal operation strategy of distribution network is proposed based on the flexible application of SOP and ES. In order to mitigate the impact of charging load on distribution network, FCSs integrated with PV and ES are flexibly connected to the distribution network through SOP. The grid connection point of node of charging load can be adjusted according to the load distribution based on the SOP control strategy. And The load distribution status of the distribution network can be continuously controled through SOP. The PV and charging load can b be integrated based on the EV control strategy. And the impact of charging load on distribution network is reduced.
(3) A two-stage RO solution method for distribution networks is proposed. Considering the uncertainty of PV in FCSs, the optimization model is converted into a two-stage RO for solution. In main problem (MP), the control of energy storage and SOP status is realized. In sub problem (SP), the worst scenario is calculated. And the column-and-constraint generation (C&CG) method is applied to solve the RO. Compared with other optimization strategies, the method of combining SOP and energy storage proposed in this paper can improve the economic operation level of distribution network.
2 Charging load modeling of fast charging station
For EVs, the road network state can generally be divided into two categories. Therefore, the state description of the road network system can be divided into static road network state description matrix and dynamic road network state description matrix.
2.1 Static road network state description matrix
The road network structure is mainly composed of nodes and links. The static road network state description matrix is shown in (1).
Where
Where
For the selection of FCSs, the shortest route is selected according to Dijkstra algorithm. And the distance between EV and FCSs is as follows:
Where
2.2 Dynamic road network state description matrix
The static road network state description matrix is shown in (4).
Where
Where
For the selection of FCSs, the shortest route is selected according to Dijkstra algorithm. And the travel time between EV and FCSs is as follows:
Where
2.3 Charging load model
EVs under normal operation state should meet the following requirements:
Where
The EVs needed to be charged are described as follows:
Where
In this paper, we assume that EVs will select the nearest FCS when the EVs need to charge. So the charging load calculation process is shown in Figure 1.

FIGURE 1. Calculation flow chart of charging load.
BPR model is used to update the road network state.
Where
Therefore, the charging load of FCSs is defined as follows:
Where
3 An optimal operation strategy of distribution network considering SOP and ES
3.1 Objective function
In this paper, the FCS is equipped with ES and PV to reduce the negative impact of the charging load on the distribution network. At the same time, in order to further optimize the power flow the distribution network, SOP is applied to adjust the FCS node to realize the optimal dispatching of the distribution network.
The objective function is to minimize the day ahead operation cost of the distribution network.
Where
3.2 Constraints
3.2.1 Power flow constraints
The Distflow model is applied for AC power flow constraints of distribution network. And the model is convex based on the second-order cone relaxation method. The power flow constraints are as follows:
Where
3.2.2 Voltage constraints
Where
3.2.3 Current constraints
Where
3.2.4 EV constraints
Where
3.2.5 SOP constraints
Where
4 A two-stage RO solution method for distribution networks considering FCSs integrated with PV and ES
In order to solve the uncertainty of PV in distribution network, a two-stage robust optimization model is proposed. And the solution process is shown in Figure 2.
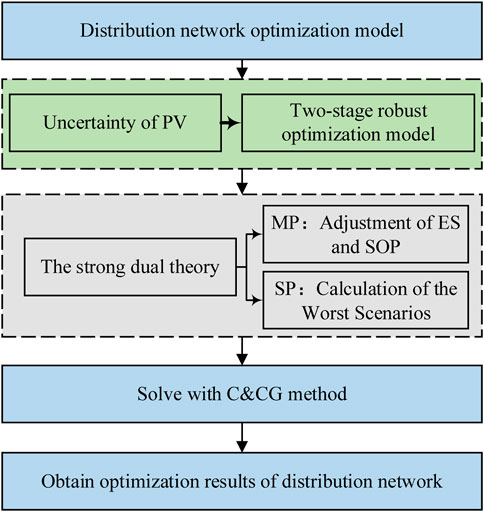
FIGURE 2. Model solving process.
4.1 Optimal dispatching model
Considering the uncertainty of PV, the uncertainty of PV is addressed by box sets, which can be expressed as:
Where
The objective function can be modeled as follows:
The optimization model is described in general form:
Where
4.2 Optimal dispatching model
The C&CG method is applied to solve the two stage RO. The optimization model is divided into MP and SP. The form of MP is as follows:
Where
The form of SP is as follows:
For a given
“max” form according to the strong duality theory and combined with the outer “max” problem.
Where
There are bilinear terms in the above objective functions, i.e.,
After the above transformation, the calculation process is as follows:
(1) Given a set of
(2) Solve the MP (27), and update the lower bound as
(3) Solve the SP (33), obtain the worst scenario
(4) If
(5) Set
5 Case study
5.1 Case data
The road network structure is shown in Figure 3. This paper selects a road network of about 10 mile2 (Li et al., 2020). There are 55 passable roads and the roads are two-way roads in the road network. There are five FCS, which are respectively located at nodes 5, 12, 15, 24, and 31. The road network data can be obtained from previous research (Zhang et al., 2023). For the five FCSs integrated with optical storage charging, they are located in three different distribution networks. We select a distribution network to verify the proposed method. The distribution network structure is shown in Figure 4. And the corresponding coupling data is shown in Table 1. The TOU is shown in Figure 5. The road network vehicle trip data is generated based on the National Household Travel Survey (NHTS) (NHTS, 2021).
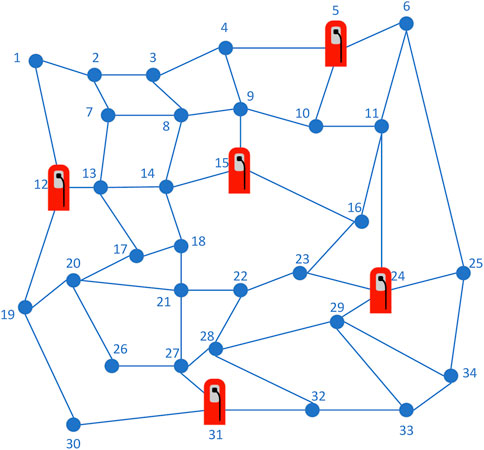
FIGURE 3. Topological structure of road network.
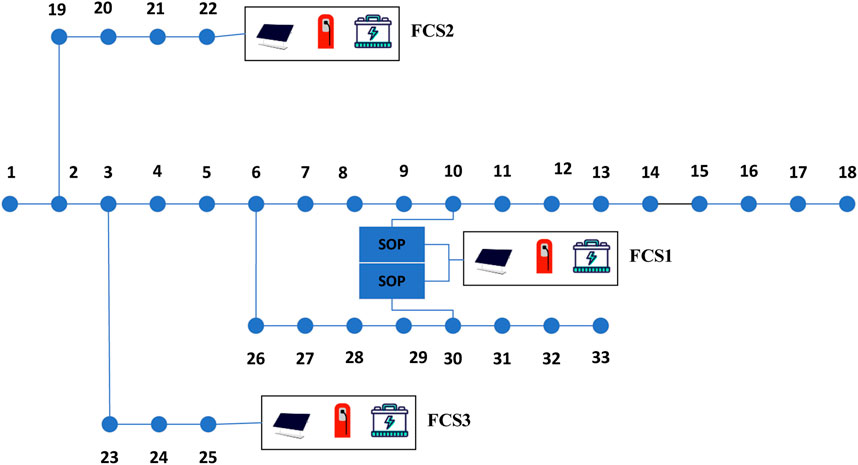
FIGURE 4. Topological structure of distribution network.
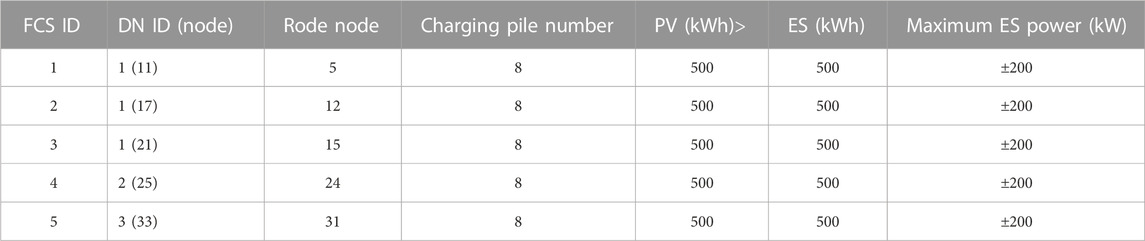
TABLE 1. Case data.
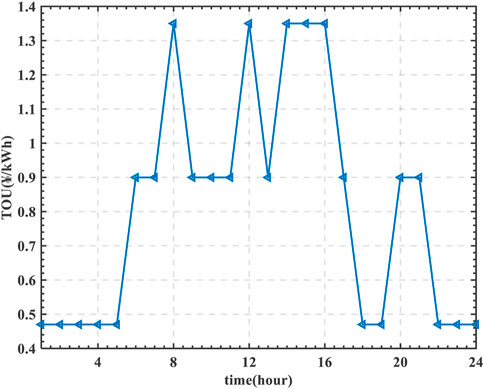
FIGURE 5. TOU setting.
5.2 Distribution of EVs
The distribution of vehicle trips is shown in Figure 6. It can be seen from Figures 6–8 that the number of charged EVs increases with the increasing of the number of traveling vehicles.
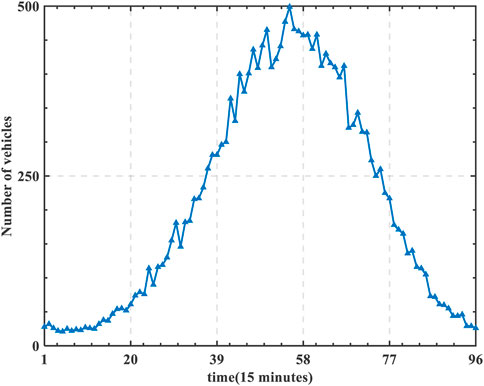
FIGURE 6. Distribution of departure vehicles.
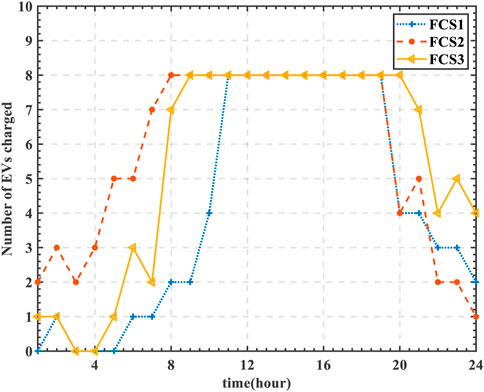
FIGURE 7. Distribution of EVs charged for the FCSs selection of the shortest path.
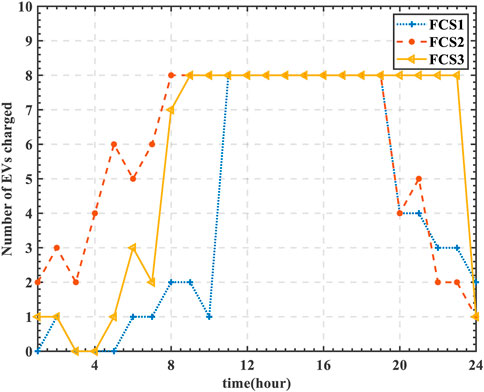
FIGURE 8. Distribution of EVs charged for the FCSs selection of shortest the travel time path.
5.3 Comparative analysis
Several scenarios in Table 2 are used to verify the effectiveness of the proposed method. In order to verify the robustness of the strategy, the uncertain adjustment parameter setting is shown in Table 3.
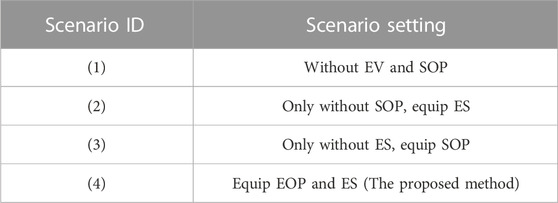
TABLE 2. Scenario setting.
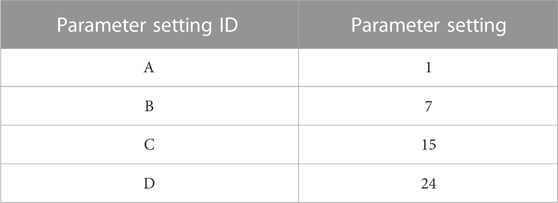
TABLE 3. Uncertain adjustment parameter setting.
5.3.1 Gateway power of distribution network
The curve of distribution network gateway power is shown in Figures 9, 10. The simulation results based on the selection FCSs with the shortest path are shown in Figure 9. And the simulation results based on the selection FCSs with the shortest travel time path are shown in Figure 10. It can be seen from scenario 1 and scenario 2 that when FCS is equipped with ES, ES can be charged in the valley periods of TOU. And ES is discharged in the peak period of high load value. By the application of ES, the line congestion is relieved. It can be seen from scenario 1 and scenario 3 that when SOP is used to adjust the access position of FCS, the gateway power of the distribution network is effectively reduced at 8:00–11:00. In scenario 4, SOP and ES are comprehensively considered. From 6:00 to 11:00, the gateway power of scenario 4 is the lowest, which effectively reduces the power purchase cost of DN. At the same time, based on the application of SOP and ES the fluctuation of gateway power is reduce effectively.
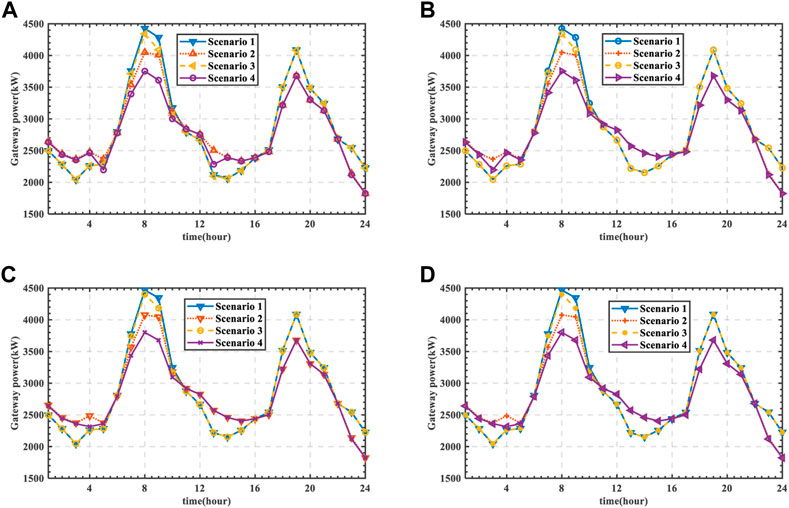
FIGURE 9. Gateway power of DN for the shortest path.
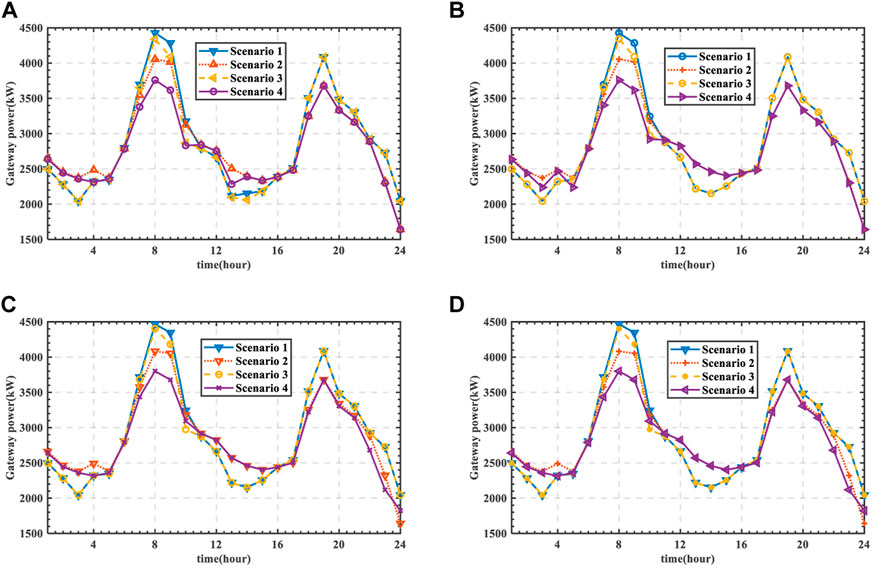
FIGURE 10. Gateway power of DN for the shortest travel time path.
The selection FCSs with the shortest path and the selection FCSs with the shortest travel time path represent extreme cases of uncertainty. And it can be seen from Figures 9, 10 that the uncertainty of charging load will not affect the robustness of the proposed strategy.
5.3.2 Distribution of voltage
In this paper, the minimum voltage amplitude in DN at each time is selected for comparison. It can be seen from scenario 1 and scenario 2 inFigures 11, 12 that when ES is equiped, the distribution of voltage amplitude is significantly improved. Especially in the period from 7:00 to 9:00, the minimum value of voltage amplitude is obviously. It can be seen from scenario 1 and scenario 4 that when SOP and ES are considered comprehensively, the voltage distribution of DN is optimized obviously. The voltage amplitude between 7:00 to 9:00 and 18:00 to 24:00 is optimized obviously. The comparison of four scenarios shows that the voltage amplitude can be maintained in a better range when the proposed method is applied.
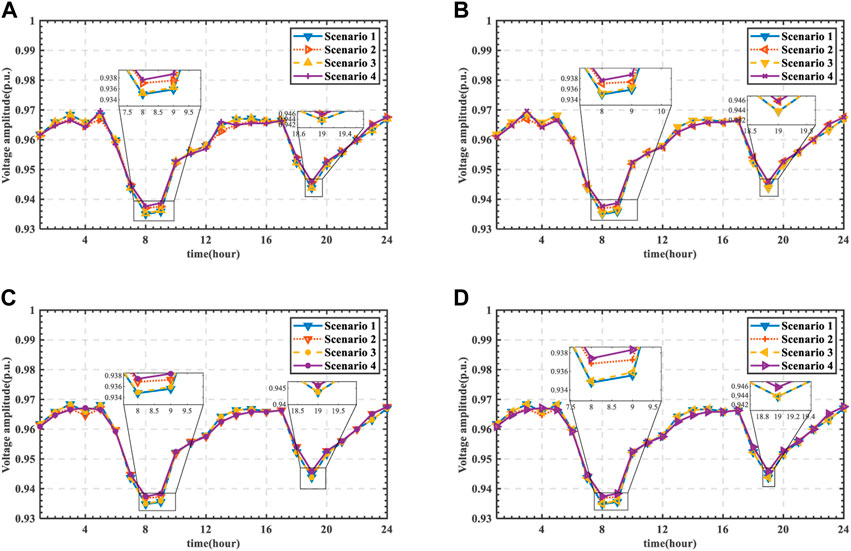
FIGURE 11. Distribution of minimum voltage amplitude for the shortest path.

FIGURE 12. Distribution of minimum voltage amplitude for the shortest travel time path.
5.3.3 Cost optimization
The operation cost is shown in Figures 13, 14. It can be seen from the comparison between scenario 1 and scenario 2 that when ES is applied, ES will adjust the charging and discharging time according to TOU, which can reduce the operation cost of DN. It can be seen from scenario 1 and scenario 3 that SOP can adjust the access point of DN according to the load distribution, which can effectively reduce the power loss. In Figure 13B It can be seen from Scenario 4 that when SOP and ES are comprehensively considered, the operating cost of DN has decreased by ¥36877.4 compared with scenario 1. And the economic operation level of DN has been significantly improved. The effective output power period of PV is less than 24 h. So in Figures 13C, D, the operation costs are equal.
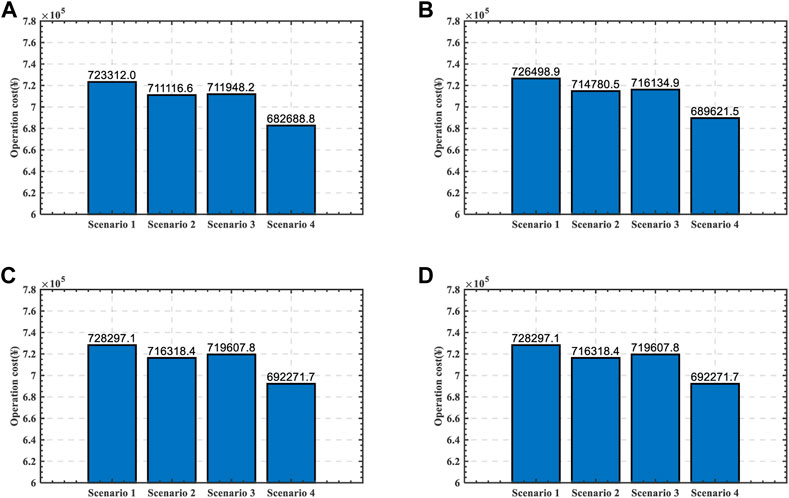
FIGURE 13. The operation cost of DN for the shortest path.
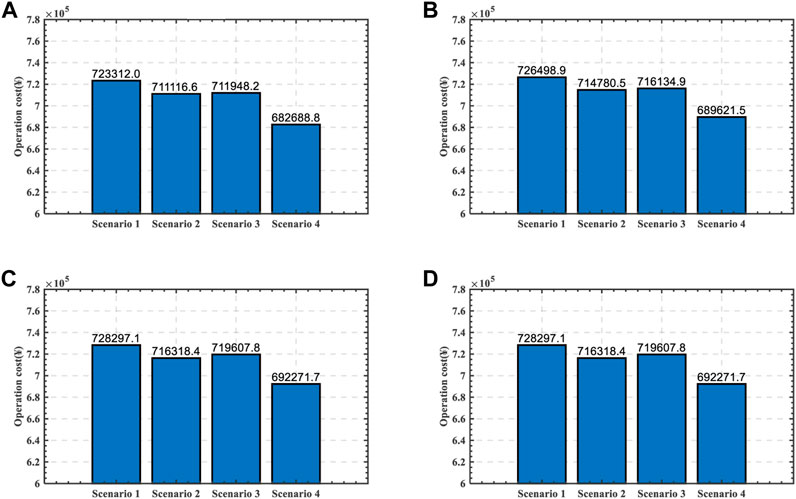
FIGURE 14. The operation cost of DN for the shortest travel time path.
5.3.4 ES dispatching
The ES dispatching strategy of scenario 2 and scenario 4 is shown in Figures 15–18. The overall trend of the residual capacity of ES in the two scenarios is basically consistent, which is related to TOU of DN. When TOU is in the valley period, ES will be charged; When TOU is in the peak period, ES will be discharged to reduce the power purchase and the operation cost of DN. For the ES dispatching strategy, there are some differences between Figures 15, 16. In scenario 4, the control of SOP is also considered.
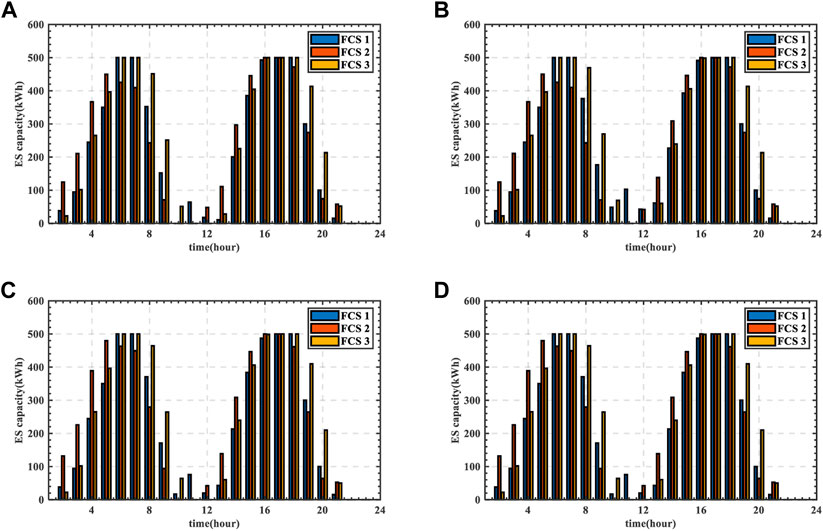
FIGURE 15. ES operation status of scenario 2 for the shortest path.
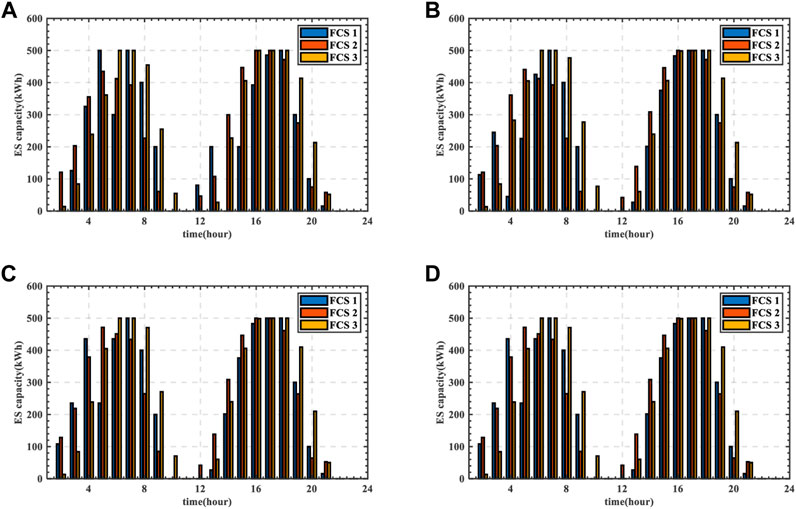
FIGURE 16. ES operation status of scenario 4 for the shortest path.
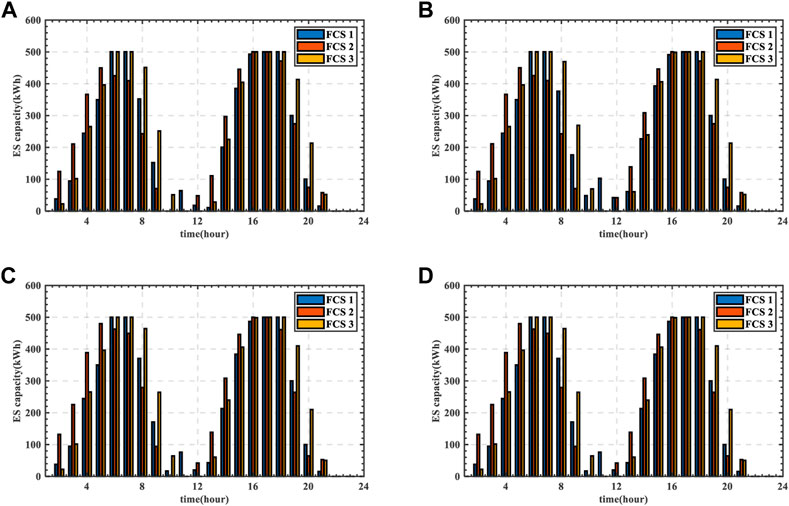
FIGURE 17. ES operation status of scenario two for the shortest travel time path.
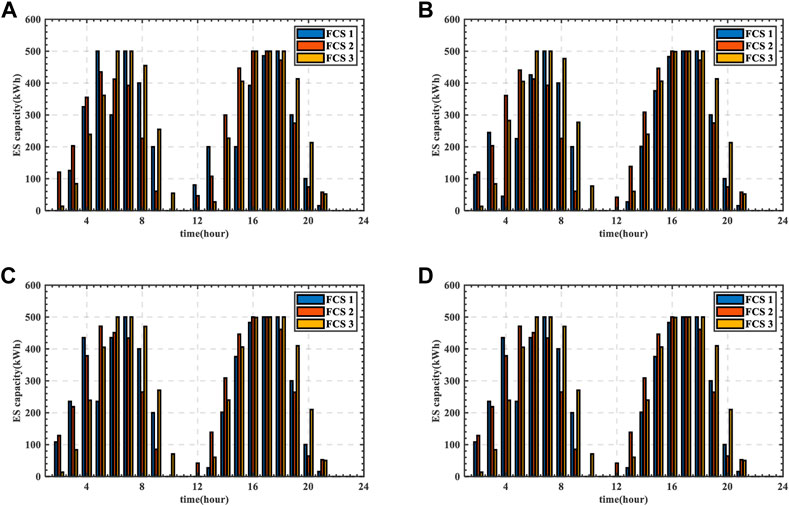
FIGURE 18. ES operation status of scenario four for the shortest travel time path.
5.3.5 SOP dispatching
The ES dispatching strategy of scenario 3 and scenario 4 is shown in Figures 19, 20. And the SOP status settings are shown in Table 4. In scenario 3 and scenario 4, the status of SOP is basically consistent. The status of SOP is different between scenario 3 and scenario 4 at 1:00 and 23:00 based on the application of ES in Figure 19A and Figure 20B. Due to the difference of charging load, the status of SOP is different in Figure 19C and Figure 20C.
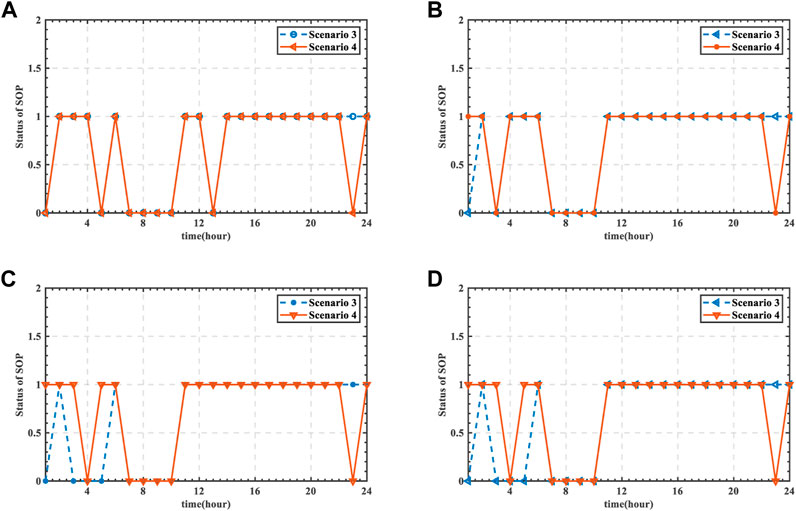
FIGURE 19. Status of SOP for the shortest path.
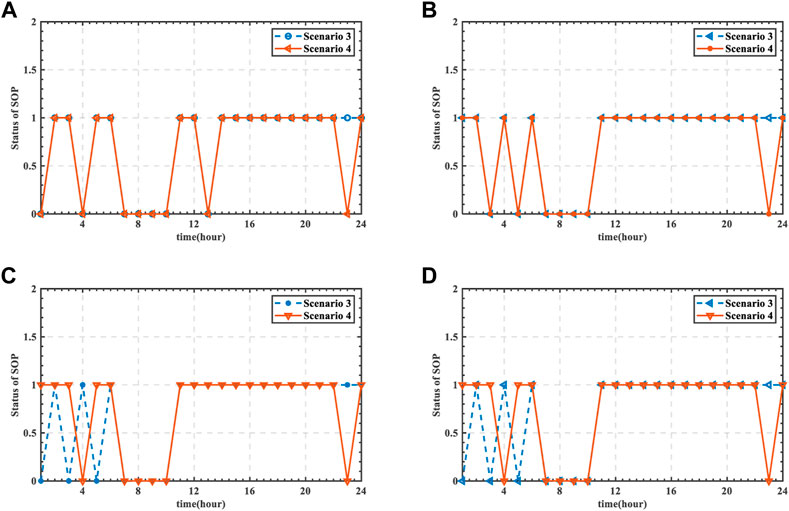
FIGURE 20. Status of SOP for the shortest travel time path.

TABLE 4. SOP status settings.
6 Conclusion
In this paper, a robust optimal dispatching strategy of distribution networks considering fast charging stations integrated with photovoltaic and energy storage is proposed. The following are some major finding:
(1) A fast charging load modeling is proposed based on the road network model and MCSM. The road network analysis is realized based on historical travel data and BPR model. And the simulation and modeling of charging load is realized.
(2) A robust optimal dispatching strategy of distribution networks considering FCS integrated with PV and ES is proposed. Based on the cooperation of SOP and ES, the operation state of distribution network is optimized. And the operation cost of distribution network is reduced.
Data availability statement
The original contributions presented in the study are included in the article/Supplementary Material, further inquiries can be directed to the corresponding author.
Author contributions
CZ: Responsible for resources, software, formal analysis, program compilation and writing original draft. KP: Responsible for methodology, project administration and funding acquisition. XZ: Responsible for writing review and editing. YJ: Responsible for writing review and editing. YL: Responsible for writing review and editing. YC: Responsible for writing review and editing.
Funding
The study in this paper was sponsored by the Project supported by National Natural Science Foundation of China (51807112).
Conflict of interest
The authors declare that the research was conducted in the absence of any commercial or financial relationships that could be construed as a potential conflict of interest.
Publisher’s note
All claims expressed in this article are solely those of the authors and do not necessarily represent those of their affiliated organizations, or those of the publisher, the editors and the reviewers. Any product that may be evaluated in this article, or claim that may be made by its manufacturer, is not guaranteed or endorsed by the publisher.
References
Biviji, M., Uçkun, C., Bassett, G., Wang, J., and Ton, D. (2014). “Patterns of electric vehicle charging with time of use rates: Case studies in California and Portland,” in Isgt 2014 (New Jersey, United States: IEEE), 1–5.
Bryden, T. S., Hilton, G., Dimitrov, B., de León, C. P., and Cruden, A. (2019). Rating a stationary energy storage system within a fast electric vehicle charging station considering user waiting times. IEEE Trans. Transp. Electrification 5 (4), 879–889. doi:10.1109/tte.2019.2910401
Chaudhari, K., Kandasamy, N. K., Krishnan, A., Ukil, A., and Gooi, H. B. (2018). Agent-based aggregated behavior modeling for electric vehicle charging load. IEEE Trans. Industrial Inf. 15 (2), 856–868. doi:10.1109/tii.2018.2823321
Fan, J., Bi, S., Yuan, H., Han, Y., Wu, Q., Liu, X., et al. (20192019). “An optimal dispatch strategy of distribution networks with electric vehicle charging stations integrated energy storage,” in Proceedings of the IEEE Innovative Smart Grid Technologies-Asia (ISGT Asia), Singapore, Nov 02, 2022 - Nov 05, 2022, 3462–3466.
Ivic, D. R., and Stefanov, P. C. (2021). An extended control strategy for weakly meshed distribution networks with soft open points and distributed generation. IEEE Access 9, 137886–137901. doi:10.1109/access.2021.3116982
Li, P., Ji, H., Wang, C., Zhao, J., Song, G., Ding, F., et al. (2017). Coordinated control method of voltage and reactive power for active distribution networks based on soft open point. IEEE Trans. Sustain. Energy 8 (4), 1430–1442. doi:10.1109/tste.2017.2686009
Li, X., Xiang, Y., Lyu, L., Ji, C., Zhang, Q., Teng, F., et al. (2020). Price incentive-based charging navigation strategy for electric vehicles. IEEE Trans. Industry Appl. 56 (5), 5762–5774. doi:10.1109/tia.2020.2981275
Li, J., Liang, M., Cheng, W., and Wang, S. (2021). Life cycle cost of conventional, battery electric, and fuel cell electric vehicles considering traffic and environmental policies in China. Inter. J. Hydro. Ener. 46 (14), 9553–9566.
Li, Y., Ding, Y., Liu, Y., Yang, T., Wang, P., Wang, J., et al. (2022). Dense skip attention based deep learning for day-ahead electricity price forecasting. IEEE Trans. Power Syst. 2022, 1–19. doi:10.1109/tpwrs.2022.3217579
Liu, Z., and Wang, L. (2021). A robust strategy for leveraging soft open points to mitigate load altering attacks. IEEE Trans. Smart Grid 13 (2), 1555–1569. doi:10.1109/tsg.2021.3134176
National Household Travel Survey (2021). National Household travel Survey. Available at: https://nhts.ornl.gov/.
Shao, Y., Mu, Y. F., Lin, J. Y., Wang, K. R., and Gong, Y. (2019). A fast charging guidance strategy for multiple demands of electric vehicle fast charging station and distribution network. Automation Electr. Power Syst. 43 (18), 60–64.
Shen, H., Wang, Z., Zhou, X., Lamantia, M., Yang, K., Chen, P., et al. (2022). Electric vehicle velocity and energy consumption predictions using transformer and markov-chain Monte Carlo. IEEE Trans. Transp. Electrification 8, 3836–3847. doi:10.1109/tte.2022.3157652
Singh, S., Pamshetti, V. B., and Singh, S. P. (2019). Time horizon-based model predictive Volt/VAR optimization for smart grid enabled CVR in the presence of electric vehicle charging loads. IEEE Trans. Industry Appl. 55 (6), 5502–5513. doi:10.1109/tia.2019.2928490
Su, J., Lie, T. T., and Zamora, R. (2019). Modelling of large-scale electric vehicles charging demand: A New Zealand case study. Electr. Power Syst. Res. 167, 171–182. doi:10.1016/j.epsr.2018.10.030
Wu, L., Wang, J., Fang, Y., and Fang, Y. (2017). Robust operation of distribution networks coupled with urban transportation infrastructures. IEEE Trans. Power Syst. 32 (3), 2118–2130. doi:10.1109/tpwrs.2016.2595523
Zahedmanesh, A., Muttaqi, K. M., and Sutanto, D. (2020). Active and reactive power control of PEV fast charging stations using a consecutive horizon-based energy management process. IEEE Trans. Industrial Inf. 17 (10), 6742–6753. doi:10.1109/tii.2020.3047097
Zhang, C., Peng, K., Guo, L., Xiao, C., Zhang, X., and Zhao, Z. (2023). An EVs charging guiding strategy for the coupling system of road network and distribution network based on the PT3. Electr. Power Syst. Res. 214, 108839. doi:10.1016/j.epsr.2022.108839
Zhang, J., Zhou, H., Li, H., Liu, H., Li, B., Liu, C., et al. (20172017). “Multi-objective planning of charging stations considering vehicle arrival hot map,” in Proceedings of the IEEE Conference on Energy Internet and Energy System Integration (EI2), Chengdu, China, Nov. 11th – 13th, 2022, 1–6.
Keywords: fast charging station, electric vehicles, energy storage, soft open point, distribution network, road network, robust optimization
Citation: Zhang C, Peng K, Zhang X, Jiang Y, Liu Y and Cai Y (2023) A robust optimal dispatching strategy of distribution networks considering fast charging stations integrated with photovoltaic and energy storage. Front. Energy Res. 11:1126295. doi: 10.3389/fenrg.2023.1126295
Received: 17 December 2022; Accepted: 30 January 2023;
Published: 16 February 2023.
Edited by:
Yuanzheng Li, Huazhong University of Science and Technology, ChinaCopyright © 2023 Zhang, Peng, Zhang, Jiang, Liu and Cai. This is an open-access article distributed under the terms of the Creative Commons Attribution License (CC BY). The use, distribution or reproduction in other forums is permitted, provided the original author(s) and the copyright owner(s) are credited and that the original publication in this journal is cited, in accordance with accepted academic practice. No use, distribution or reproduction is permitted which does not comply with these terms.
*Correspondence: Ke Peng, cGVuZ2tlQHNkdXQuZWR1LmNu