 Weiqiang Xie
 Xiaoyun Li*
- School of Electric Power Engineering, Shanghai University of Electric Power, Shanghai, China
The Integrated Energy System (IES) that coordinates multiple energy sources can effectively improve energy utilization and is of great significance to achieving energy conservation and emission reduction goals. In this context, a low-carbon and economic dispatch model for IES is proposed. Firstly, a hydrogen energy-based IES (H2-IES) is constructed to refine the utilization process of hydrogen energy. Secondly, the carbon emissions of different energy chains throughout their life cycle are analyzed using the life cycle assessment method (LCA), and the carbon emissions of the entire energy supply and demand chain are considered. Finally, a staged carbon trading mechanism is adopted to promote energy conservation and emission reduction. Based on this, an IES low-carbon and economic dispatch model is constructed with the optimization goal of minimizing the sum of carbon trading costs, energy procurement costs, and hydrogen sales revenue, while considering network constraints and constraints on key equipment. By analyzing the model under different scenarios, the introduction of life cycle assessment, staged carbon trading, and hydrogen energy utilization is shown to promote low-carbon and economic development of the comprehensive energy system.
1 Introduction
Currently, the use of fossil fuels has led to serious problems of energy depletion and environmental pollution. Wind and photovoltaic power generation, as renewable clean energy sources, can improve the energy structure and reduce carbon emissions (Yang et al., 2017).
Hydrogen energy has the characteristics of high calorific value and low pollution, and can be coupled with electricity and heat in the integrated energy system (IES) to form an integrated energy system with hydrogen energy (H2-IES). This has important implications for improving overall energy utilization and achieving a reduction in carbon emissions (Xu et al., 2019; Lin et al., 2020; Wan et al., 2021).
There are a large number of literatures on integrated energy systems (IES) research both domestically and abroad. WU (Wu et al., 2021) established an optimization and scheduling model for an IES system that takes into account power-to-gas (P2G) devices and combined cooling, heating, and power (CCHP) units, and verified that introducing diversified energy conversion equipment is beneficial to improving wind power consumption and energy utilization efficiency. ZHENG (Zheng et al., 2021) considered the uncertainty of renewable energy generation and energy demand, and proposed a data-driven stochastic cooperative timing model for electric and gas integrated energy systems, and addressed the energy price formation and settlement issues in an uncertain market by proposing expected locational marginal prices, and demonstrated that the flexibility of P2G can help hedge against uncertainty. QIU (Qiu et al., 2022) explored the advantages of a mixed hydrogen-natural gas transportation system in improving energy utilization efficiency and reducing costs. SHI (Shi et al., 2018) coordinated demand-side flexible loads with P2G scheduling, and verified the optimal scheduling of the system under four scenarios. The scheduling models in these references focus on the operation optimization of IES and ignore the current low-carbon development background.
Currently, carbon trading is regarded as an important mechanism to reduce carbon emissions. LU (Lu et al., 2021) proposes a wind power curtailment strategy that takes into account the thermal and electrical characteristics of Combined Heat and Power (CHP) units based on the carbon trading mechanism. CUI (Cui et al., 2021) analyzes the principle of carbon trading mechanism and introduces an electric-thermal integrated energy system to analyze the impact of carbon trading prices on the system’s carbon emissions. ZHANG (Zhang et al., 2020) introduces a reward-penalty carbon trading mechanism in the IES planning model, and uses a two-stage robust optimization model to deal with the uncertainty of electric-thermal loads, verifying the low-carbon and economic performance of the model. HUANG (Huang et al., 2023) proposes a double-layer trading framework with regional carbon emission constraints based on the Stackelberg game theory, in which a virtual power plant with zero carbon emissions is the leader that sets flexible carbon emission permit prices, and analyzes the superiority of this trading mechanism in carbon emissions reduction. WANG, CHENG and WANG (Cheng et al., 2020; Wang et al., 2020; Wang et al., 2022) calculate the carbon emission responsibility borne by the demand side based on the theory of carbon emission flow, and verify that the model that takes into account the demand side’s carbon emissions responsibility can stimulate the willingness of the constructed system to reduce emissions.
Given the current installed capacity of new energy generation units, increasing the consumption of new energy can reduce carbon emissions, but the problem of wind power curtailment is prominent due to the anti-peak characteristics of wind power (Yang et al., 2013). WU and QIU (Wu et al., 2021; Qiu et al., 2022) has used P2G to improve wind power consumption, however, most existing studies only consider the conversion of electricity to natural gas in P2G modeling. CUI (Cui et al., 2020) points out that the efficiency of producing natural gas from electricity is 55%, while the efficiency of producing hydrogen from electricity can reach up to 70% (Wei et al., 2018), indicating a need for detailed consideration of the electricity-to-gas conversion process. Currently, we mainly study coal-fired units Carbon in CHP units, gas fired boilers, and hydrogen fuel cell vehicles Emissions, rarely analyzing energy production Carbon emissions from transportation and storage.
In the context of the above, this paper comprehensively considers stepped carbon Trading mechanism, hydrogen energy utilization and optimization of integrated energy system The impact of degree. Compared with existing research, the main innovations and contributions of this article are as follows:
1. Aiming at the incomplete life cycle assessment of carbon emissions from hydrogen energy chains, the LCA (Life Cycle Assessment) method was used to analyze carbon emissions generated during the migration and transformation process of hydrogen energy chains in H2-IES.
2. Aiming at the non-linear efficiency problems of hydrogen energy production and utilization equipment under different operating conditions, a refined model was established to comprehensively reflect the impact of specific energy efficiency characteristics of hydrogen energy equipment on the operation of H2-IES.
3. Considering the role of the carbon trading market, a stepped carbon trading model is established to limit the system’s carbon emissions, and the impact of carbon trading parameters on the operation of H2-IES is discussed.
2 H2-IES analysis of a carbon trading mechanism with a stepped structure incorporating LCA energy chain analysis
IES meets its internal energy demands through multiple energy sources and supply equipment. This paper introduces hydrogen production equipment (HPE) and hydrogen fuel cells (HFC) to the traditional model, forming an H2-IES. The specific framework is shown in Figure 1.

FIGURE 1. Integrated energy system framework.
2.1 Modeling of hydrogen utilization stage
Hydrogen, as a clean and efficient energy source, has great potential for utilization in various fields such as industry, civilian use, and transportation. The utilization stages of hydrogen in H2-IES include hydrogen production by electrolysis and hydrogen-to-heat-to-electricity conversion. HPE converts electrical energy into hydrogen energy, and fuel cells use hydrogen energy for thermal and electrical production.
1) HPE
where
HPE equipment can be used for wind power curtailment. It can be known from LI (Li et al., 2020), the efficiency of hydrogen production equipment is non-linear, and the hydrogen production efficiency gradually decreases as the input power increases to the rated power, while the production output increases. However, the low efficiency leads to an increase in hydrogen production costs. Therefore, considering the economic issues of its output, a flexible operation mode should be adopted. That is, when the hydrogen production revenue exceeds the cost of coal-fired power generation, the coal-fired power should be input to HPE to obtain revenue; otherwise, the coal-fired power will not be input to HPE.
2) HFC
HFC can realize the coupling between hydrogen energy, thermal energy, and electrical energy, strengthen the synergy between different forms of energy in the system, and convert hydrogen energy into electricity and thermal energy through HFC without producing pollutants and carbon dioxide as traditional CHP units do. Therefore, it can promote the clean operation of the system. The HFC model in this paper is as follows:
where
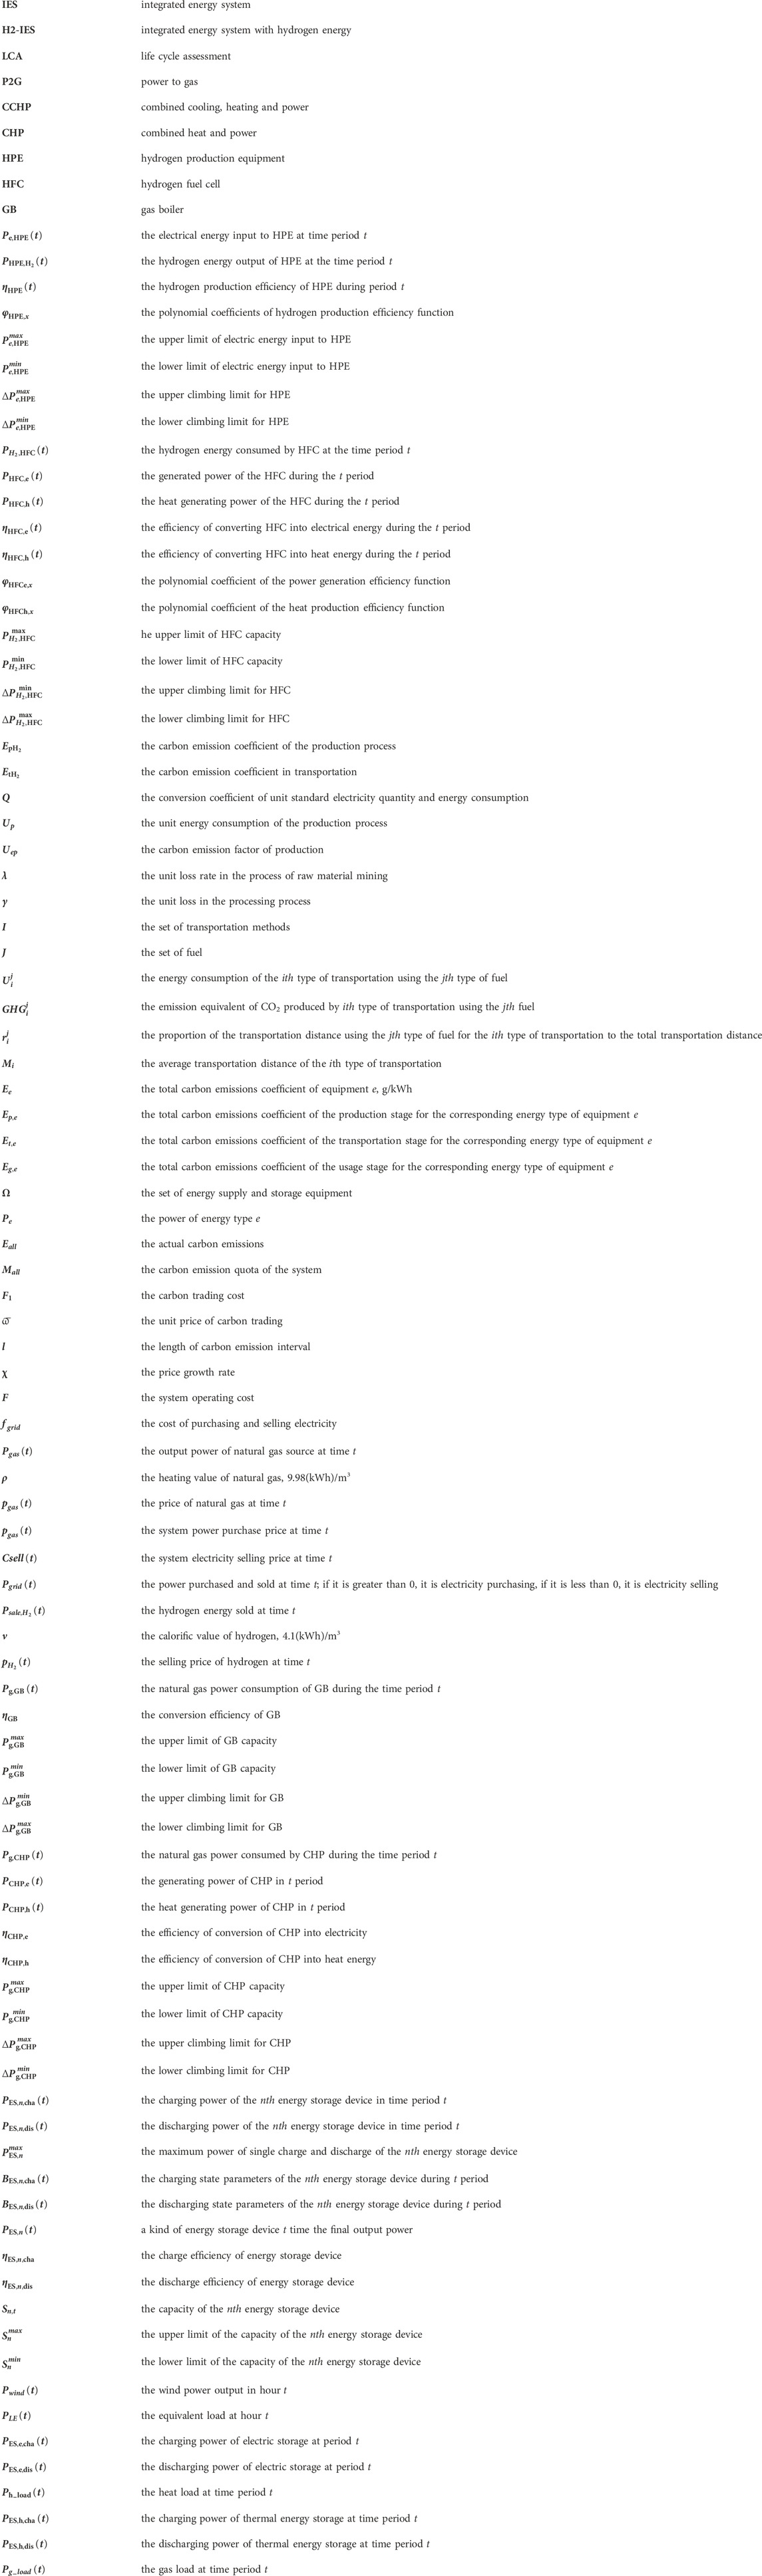
In the formula: is the hydrogen energy consumed by HFC in time period t; and are the power generation and heat production power of HFC in time period t, respectively; and are the efficiency of HFC converting hydrogen energy into electrical and thermal energy in time period t; and are the polynomial coefficients of the power generation and heat production efficiency functions, respectively; and are the upper and lower limits of HFC capacity, respectively; is the ramp-up and ramp-down limit of HFC.
2.2 LCA energy chain analysis in IES
2.2.1 LCA energy chain analysis
Life Cycle Assessment (LCA) energy chain analysis consists of three implementation steps: classification, characterization, and quantification (Wang et al., 2019). During the energy production and transmission process in the H2-IES supply process, carbon emissions are generated. If only the carbon emissions during device usage are considered, the overall carbon emissions of the H2-IES cannot be fully reflected. Therefore, the total carbon emissions of each energy chain are calculated using LCA energy chain analysis, which includes the entire process from energy extraction to consumption, taking into account the accompanying effects of material conversion.
2.2.2 Carbon emission analysis of IES based on LCA
WANG (Wang et al., 2019) and HUANG (Huang et al., 2022) respectively analyzed the LCA energy chains of coal-fired power, new energy, natural gas, and energy storage, but did not quantify the carbon emissions of the hydrogen energy chain. The carbon emissions of the hydrogen energy LCA energy chain can be divided into two stages: production (raw material mining and processing) and transportation (raw material transportation and hydrogen transportation). The specific measurement process is as follows:
where
2.3 Carbon trading model
Carbon trading is essentially establishing reasonable carbon emissions quotas and allowing market-based trading of carbon emissions quotas, thus controlling the trading mechanism of carbon emissions.
2.3.1 Carbon emissions quota model
For major carbon emission sources such as coal-fired power plants, CHP units, and gas boilers, the baseline method is used to determine their carbon emissions quotas (Qu et al., 2018); the carbon emissions quotas for renewable energy units can refer to YANG (Yang et al., 2015). Since the government has not yet set carbon quotas for energy storage devices, the carbon emissions quota for energy storage is set to 0 in this paper.
2.3.2 Actual carbon emission model
The LCA energy chain of H2-IES involves various energy production, transportation, and utilization stages. The carbon emission coefficients of the three stages are quantified using the following formula:
Where
where Ω is the set of energy supply and storage equipment;
Once the actual carbon emissions are obtained, the carbon emissions trading volume involved in the carbon trading market can be calculated.
where
2.3.3 Staggered carbon trading model
The traditional carbon trading mechanism assumes a fixed carbon trading cost throughout the entire scheduling period. If the carbon emissions do not exceed the quota, the excess quota can be traded for profit. Otherwise, the excess carbon emissions must be offset by purchasing additional carbon quotas, which can be expressed as Eq. 7:
where
The cost of tiered carbon trading mechanism is determined by dividing the carbon emission quota into different intervals, with different carbon trading prices for each interval.
where l is the length of carbon emission interval; χ is the price growth rate.
3 Consideration of the staircase carbon trading mechanism and the low-carbon economic dispatch model of H2-IES objective function
3.1 Objective function
The optimization objective of the low-carbon economic dispatch model of H2-IES is the sum of carbon trading cost
where
3.2 Constraint condition
3.2.1 Equipment constraints
1) Constraints of HPE and HFC are shown in Eqs 1, 2.
2) Gas Boiler (GB)
where
3) CHP
where
4) Constraints on energy storage operation
According to JIANG (Jiang and Ai, 2019), the models of energy storage devices such as electric and thermal are similar, so this paper adopts a unified modeling approach for electric and thermal energy storage devices.
Where
3.2.2 Electrical, gas, and heat network constraints
1) Active power balance constraint
Where
2) Thermal power balance constraints
Where
Natural gas equilibrium constraint
where
3.3 Model linearization processing
The hydrogen production equipment and fuel cell models constructed in this paper are nonlinear models that require piecewise linearization before being solved using CPLEX.
Step 1. Divide the definition field of the original function independent variable into Q intervals according to the required accuracy. The interval determination method is as follows. When performing piecewise linearization fitting, the linearization function
The calculation idea can be summarized as follows: First, give the maximum error value
Step 2. Add Q+1 continuous auxiliary variables
Step 3. Assume that the determined segment interval is
4 Case study analysis
4.1 Case study parameters
To validate the effectiveness of the proposed scheduling strategy, simulation is conducted based on the following load, energy, and equipment data. The various loads of the IES and wind power output prediction results are shown in Figure 2. The parameters of time-of-use electricity prices, various equipment, and energy storage are shown in Supplementary Appendix Tables A1–A3. The price of natural gas is 0.35 yuan per cubic meter, and that of hydrogen is 3.6 yuan per cubic meter. Interval length
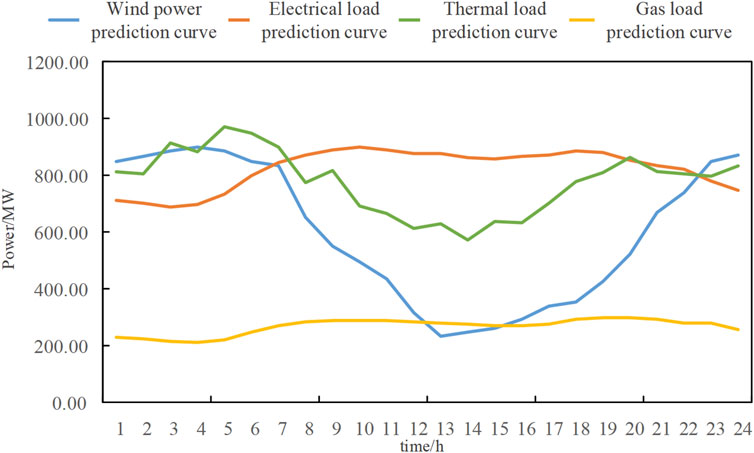
FIGURE 2. Influence of different carbon trading base price on system carbon emission.
This paper performs optimization using CPLEX and sets up four operating scenarios for analysis.
Scenario 1: The operational cost of H2-IES without considering carbon trading costs under the tiered carbon trading mechanism; Scenario 2: H2-IES considers the cost of carbon trading under the traditional carbon trading mechanism; Scenario 3: H2-IES considering carbon trading costs under the tiered carbon trading mechanism (the optimization method proposed in this paper); Scenario 4: The traditional combined heat and power system considering carbon trading costs under the tiered carbon trading mechanism.
The total carbon emission coefficient obtained by the LCA energy chain analysis is shown in Table 1. The introduction of carbon trading mechanism is to study the carbon emissions in economic terms. The selection of the carbon emission quota coefficient per unit of electricity output in this paper refers to the relevant data on carbon emission quota allocation issued by the National Development and Reform Commission, and the specific data is shown in Table 2.
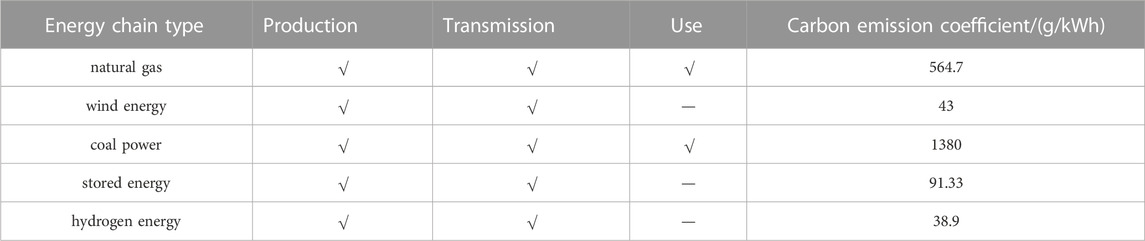
TABLE 1. Table of carbon emission from different energy chains.
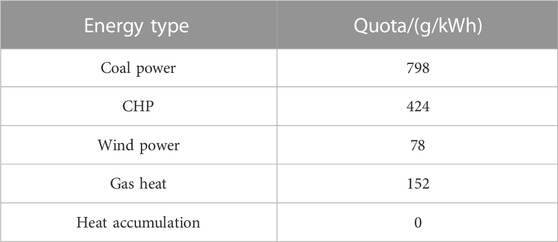
TABLE 2. Carbon quota coefficient per unit power.
4.2 Analysis of dispatch results in different optimization scenarios
Based on the four scenarios mentioned above, the system operating costs were obtained as shown in Table 3. Among them, scenarios 1, 2, and 3 have the same energy supply structure and equipment, and in scenario 4, traditional P2G devices replace HPE and HFC.
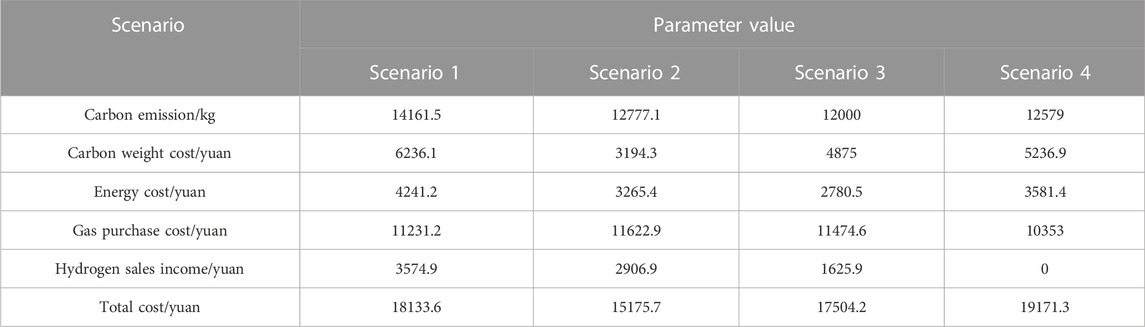
TABLE 3. Benefit comparison of each scenario.
Figures 3–5 show the operation conditions of electric load units and thermal load units in Scenario 1, 2 and 3, and the operation results of electric, thermal and gas loads in Scenario 4 are shown in Figure 6.
1 Comparison and analysis of different carbon trading mechanisms
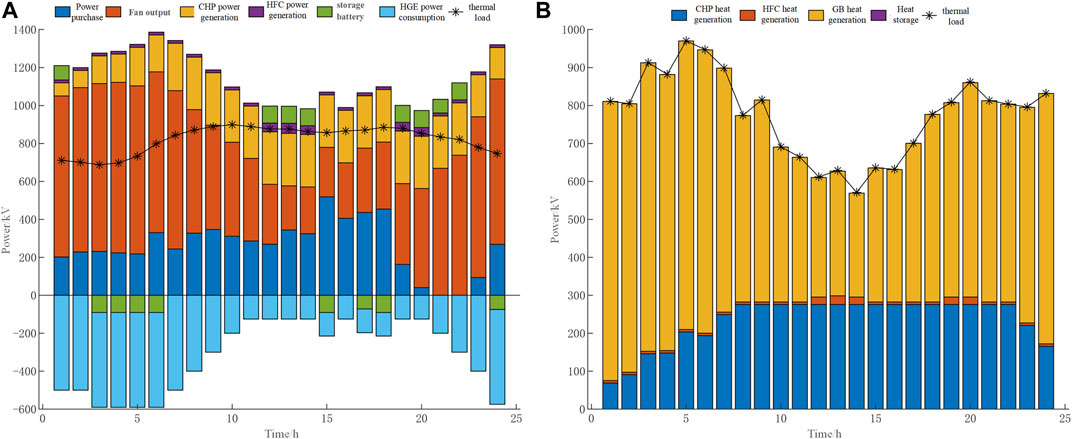
FIGURE 3. Scenario 1 electric (A) and thermal (B) power blance diagram.
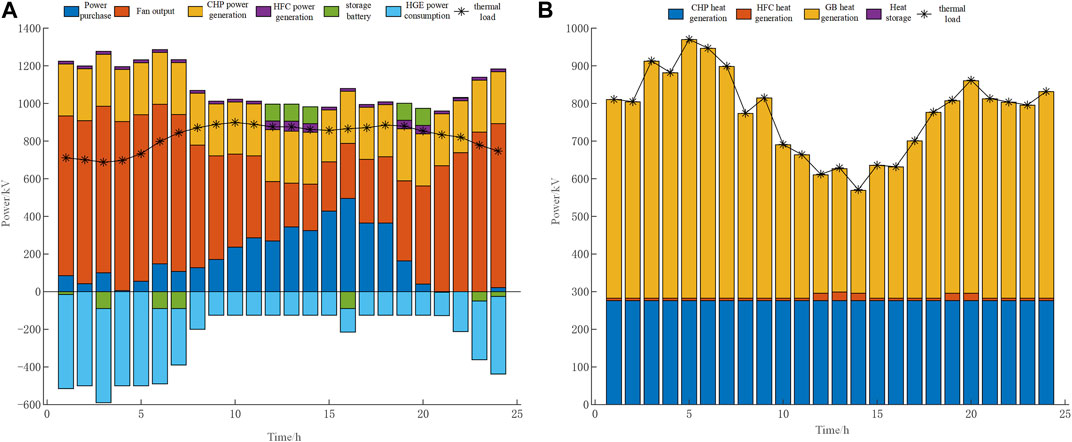
FIGURE 4. Scenario 2 electric (A) and thermal (B) power blance diagram.
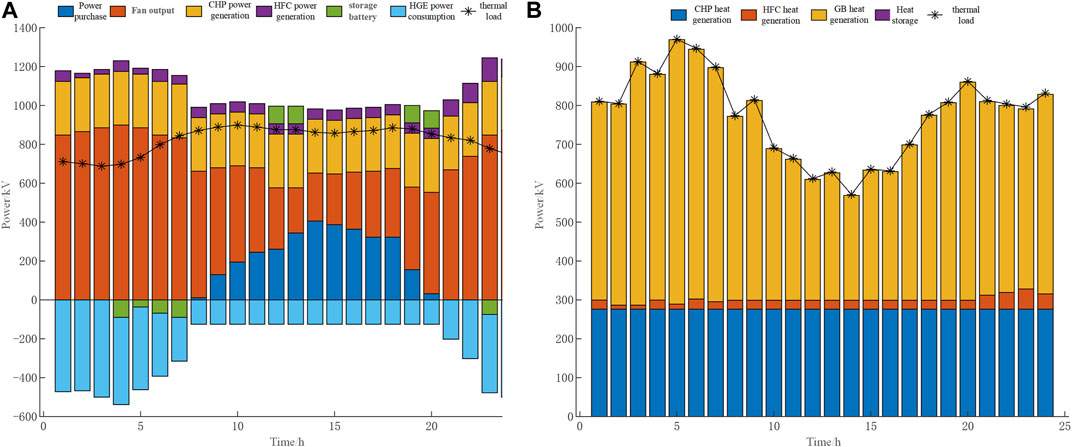
FIGURE 5. Scenario 3 electric (A) and thermal (B) power blance diagram.
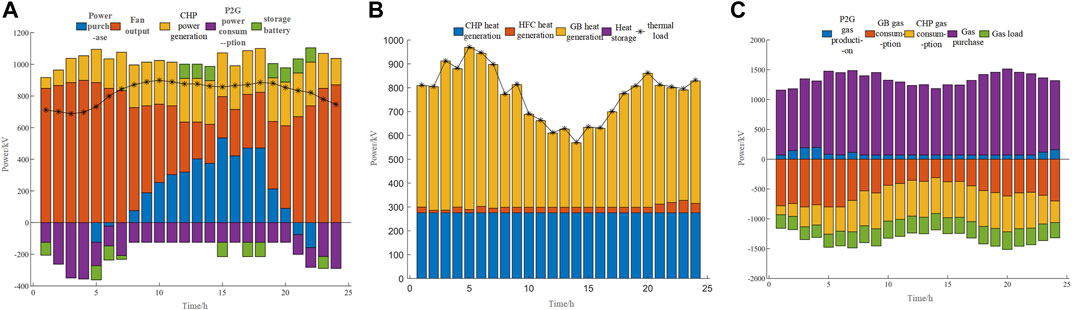
FIGURE 6. Scenario 4 electric (A), thermal (B) and gas (C) power blance diagram.
In Scenario 1, with the goal of optimizing traditional economic operations, the system will purchase as much natural gas as possible to produce electricity and heat through CHP, as the gas price is cheaper than the electricity price during all time periods. Before 06:00, wind power is sufficient and the efficiency of GB in producing heat is higher than that of CHP, so most of the heat load is supplied by GB, while CHP is in a state of heat-determined electricity. As the electricity load increases and wind power gradually becomes insufficient, CHP needs to supply more electricity, so it gradually reaches full load and produces the maximum electricity and heat power. The period from 23:00 to 24:00 is the same as before 06:00. In order to maximize profits from selling hydrogen, HPE operates at maximum capacity throughout the day, leading to a minimal sum of energy purchase and hydrogen sales revenue. However, a large amount of energy purchases lead to actual carbon emissions far exceeding the carbon emission quota, requiring the purchase of a large amount of carbon emission quotas from the carbon trading market, resulting in the highest total cost.
In Scenario 2, traditional carbon trading is considered in the optimization process. Due to CHP being cleaner than thermal power and GB, CHP is prioritized in providing electricity and heat power, which is why CHP operates at full capacity throughout the day. In addition, unlike Scenario 1, during the peak load period from 07:00 to 22:00, the revenue from selling hydrogen is lower than the cost of carbon trading, so CHP operates near its lower limit, resulting in a decrease in energy purchase cost.
In Scenario 3, due to the tiered carbon trading mechanism, the revenue from selling hydrogen becomes lower than the cost of purchasing carbon emission quotas from the carbon trading market more quickly, resulting in a further reduction in energy purchase.
Figure 7 shows a comparison of the total electricity generated by all types of units throughout the day in the three scenarios. According to Figure 7, in the dispatching cycle, the on-grid electricity of coal-fired units in Scenario 1 is the highest, while that in Scenario 3 is the lowest. The difference between Scenario 2 and Scenario 3 lies in the output of HFC equipment. This is because the high carbon trading cost under stepped carbon trading forces HFC to consume hydrogen for energy supply to reduce carbon emissions, which proves that the use of stepped carbon trading is conducive to improving the output of cleaning units. In addition, due to the income from hydrogen sales, surplus wind power in the three scenarios will produce hydrogen through HPE, absorbing all wind power.
2) Comparison Analysis between H2-IES and Traditional CHP Integrated Energy Systems

FIGURE 7. The online power of each unit in each scenario.
Scenario 4 includes a P2G system, which can also absorb excess wind power and convert it into natural gas to supply the GB, CHP, or gas load, resulting in the lowest total purchasing cost. However, the P2G conversion efficiency is not high, and the hydrogen undergoes multiple processes of loss after being synthesized into natural gas through a methane reactor before being delivered to the GB or CHP. Although P2G can absorb some of the carbon dioxide, burning natural gas will also emit carbon dioxide. In contrast, in the H2-IES system, the HFC uses hydrogen for thermal and electrical production, reducing losses and directly utilizing clean energy, thus reducing carbon emissions. Since all the hydrogen is converted into natural gas in the P2G system, there is a lack of revenue from selling hydrogen, and the economic cost has not decreased.
4.3 Benefit analysis under different carbon trading prices
With the development of society, in order to reduce emission intensity, there is a possibility of changes in the carbon trading base price, price growth rate, and interval length in the stepped carbon trading mechanism. Changes in these parameters will affect the output of various units in the system. Figure 8 shows the impact trend of changes in carbon trading base price on system carbon emissions and total cost in Scenario 3.
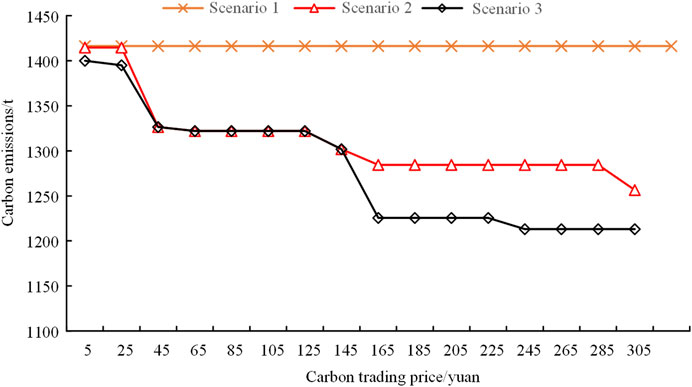
FIGURE 8. Influence of different carbon trading base price on system carbon emission.
According to Figure 8, as the carbon trading base price increases, the weight of carbon trading costs in the total system cost increases, and the carbon trading mechanism imposes stronger restrictions on carbon emissions. Although the carbon emissions of both Scenario 2 and Scenario 3 will decrease as the carbon trading price increases, the decrease in Scenario 3 is faster than that in Scenario 2. When the carbon trading price is less than 45 yuan/t, both Scenario 2 and Scenario 3 provide heat and electricity to the system by increasing the output of relatively clean CHP, thereby reducing carbon emissions. When the carbon trading price is greater than 145 yuan/t, the system reduces its electricity purchases and increases the output of HFC for heat and electricity to reduce carbon emissions. In contrast, Scenario 2 can only affect the purchased electricity when the carbon trading price is greater than 285 yuan/t, indicating that considering the stepped carbon trading is more favorable for the low-carbon operation of the system. In Scenario 3, when the carbon trading base price increases to 245 yuan/t, the output distribution of each equipment in the system tends to be stable, and the carbon emissions also tend to be stable, so the carbon emissions are less affected by changes in the carbon trading base price; due to the increase in carbon trading costs, the total system cost also increases.
According to the above analysis, it can be seen that when the carbon trading base price is greater than a certain value, the system tends to be stable and carbon emissions reach their minimum, indicating that simply raising the base price cannot further reduce emissions, but instead leads to cost increases. Therefore, in Scenario 3, a carbon trading base price of 165 yuan per ton should be selected to balance emissions reduction and economic feasibility.
Based on the analysis between carbon emissions reduction and system costs, high-emission entities face the cost of paying for carbon quotas or fines under carbon trading policies, or buying low-carbon technologies from low-emission entities. If there is no technological innovation, simply increasing the carbon trading price cannot further reduce carbon emissions but instead leads to cost escalation. In contrast, low-emission entities can compensate for their technological innovation and production costs by selling surplus quotas and low-carbon technologies, which will encourage them to increase their investment in low-carbon technologies and create a virtuous circle. Therefore, under carbon trading policies, carbon emitters can only achieve reduced carbon emissions and reduced costs through technological improvements.
4.4 Impact of relative price fluctuations of hydrogen and natural gas on system economics
When analyzing the impact of relative price fluctuations between hydrogen and natural gas on the system economy, it is assumed that the natural gas price remains constant while the hydrogen price fluctuates up and down by 3.6 yuan/m3. The resulting relative economic relationship is shown in Figure 9.
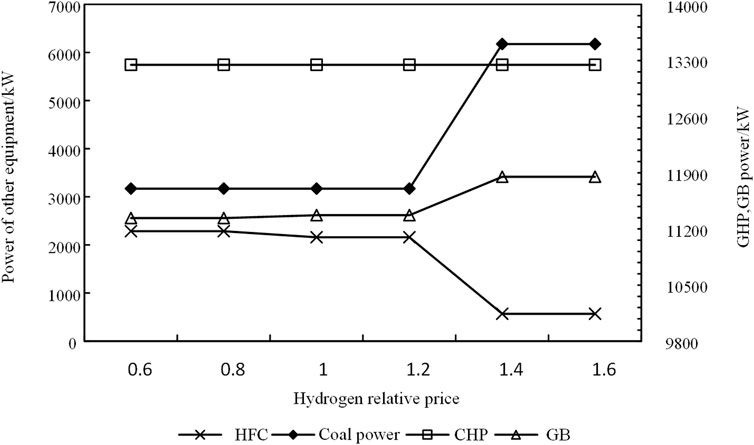
FIGURE 9. Diagram of the hydrogen relative price on system operating cost.
According to Figure 9, when the relative price of hydrogen and natural gas fluctuates in a large range (0.6–1.6), it does not affect the output of CHP units. When the relative price is at 1.2, if the price of hydrogen decreases, the output of the HFC equipment increases, because the equipment has no carbon emissions during the entire operation process, which means that the carbon trading cost is higher than the hydrogen sales revenue. If the consumption potential of hydrogen energy in China continues to increase, leading to changes in the supply and demand relationship of hydrogen energy and the price rises, the system will increase the purchase of electricity and reduce the output of HFC to ensure hydrogen sales revenue.
5 Conclusion
This article presents a dispatch model for integrated energy systems (IES) based on the life cycle method and a tiered carbon trading mechanism, taking into account the demands for electricity, heat, and gas loads and the operating characteristics of IES units. Different carbon trading mechanisms and carbon trading benchmark prices were compared and analyzed, and the impact of carbon trading prices on system carbon emissions and the influence of different hydrogen/natural gas prices on system operation were examined. The conclusions drawn are as follows:
1) Taking into account the carbon emissions of each energy chain in IES makes the system’s carbon emissions more accurate. Introducing a tiered carbon trading mechanism can adjust the output of each device, and setting a reasonable carbon trading price can guide the system’s carbon emissions.
2) The proposed H2-IES low-carbon optimization model can promote wind power consumption while leveraging the high energy efficiency of hydrogen energy. Additionally, it can improve system economics by selling hydrogen gas. When the relative price of hydrogen and natural gas is low, HFC can share part of the energy supply demand of CHP and GB, reducing their carbon emissions and further reducing carbon emissions.
Data availability statement
The original contributions presented in the study are included in the article/Supplementary Material, further inquiries can be directed to the corresponding author.
Author contributions
WX participated in the design of this study, performed the statistical analysis, and drafted the manuscript. XL carried out the study and collected important background information.
Conflict of interest
The authors declare that the research was conducted in the absence of any commercial or financial relationships that could be construed as a potential conflict of interest.
Publisher’s note
All claims expressed in this article are solely those of the authors and do not necessarily represent those of their affiliated organizations, or those of the publisher, the editors and the reviewers. Any product that may be evaluated in this article, or claim that may be made by its manufacturer, is not guaranteed or endorsed by the publisher.
Supplementary material
The Supplementary Material for this article can be found online at: https://www.frontiersin.org/articles/10.3389/fenrg.2023.1177595/full#supplementary-material
References
Cheng, Y. H., Zhang, N., Zhang, B. S., Kang, C. Q., Xi, W. M., and Feng, M. S. (2020). Low-carbon operation of multiple energy systems based on energy-carbon integrated prices. IEEE Trans. smart grid 11 (2), 1307–1318. doi:10.1109/TSG.2019.2935736
Cui, Y., Yang, S., Zhong, W. Z., Wang, Z., Zhang, P., and Zhao, Y. T. (2020). Optimaal thermoelectric dispatching of regional integrated energy system with power-to-gas. Power Syst. Technol. 44 (11), 4254–4264. doi:10.13335/j.1000-3673.pst.2019.2468
Cui, Y., Zeng, P., Zhong, W. Z., Cui, W. L., and Zhao, Y. T. (2021). Low-carbon economic dispatch of electricity-gas-heat integrated energy system based on ladder-type carbon trading. Electr. Power Autom. Equip. 41 (03), 10–17. doi:10.16081/j.epae.202011030
Huang, H. X., Li, Z. M., Mohasha Isuru Sampath, L. P., Yang, J. W., and Nguyen, H. D. (2023). Blockchain-enabled carbon and energy trading for network-constrained coal mines with uncertainties. IEEE Trans. Sustain. Energy 2023, 1–12. doi:10.1109/TSTE.2023.3240203
Huang, J. g., Xiong, H. j., Li, Z. X., and Wang, T. (2022). Capacity configuration optimization of buileding inttegrated engrgy system considering fine energy storage mode. Electr. Measurement& Instrum. 59 (03), 82–91. doi:10.19753/j.issn1001-1390.2022.03.011
Jiang, C. F., and Ai, X. (2019). Integrated energy system operation opitimization model considering uncertainty of multi-energy coupling units. Power Syst. Technol. 43 (08), 2843–2854. doi:10.13335/j.1000-3673.pst.2019.0197
Li, X. S., Sui, Q., Lin, X. N., Wang, Z. X., Wu, C. T., Wei, F. R., et al. (2020). A flexible load control strategy for power grid considering fully consumption of surplus wind power and global benefits. Proceeding CSEE 40 (18), 5885–5897. doi:10.13334/j.0258-8013.pcsee.191028
Lin, Z. H., Jiang, C. W., Chen, M. H., Shang, H. Y., Zhao, H. W., Yang, Z., et al. (2020). Low-carbon economic operation of integrated energy systenm considering flexible loads. Electr. Power Constr. 41 (05), 9–18. doi:10.12204/j.issn.1000-7229.2020.05.002
Lu, H. P., Xie, L. R., and Gao, W. (2021). Cogeneration-storage-electric boiler wind power consumption strategy with carbon trading. Electr. Measurement& Instrum. 2021, 1–11. Available at: http://kns.cnki.net.shiep.vpn358.com/kcms/detail/23.1202.TH.20210831.1125.002.html (Accessed: February 13, 2020).
Qiu, B., Mu, H. B., Wang, K., Zhang, Z. C., and Yang, Z. (2022). An optimal scheduling model of hydrogen coupling IES considering the mixed transportation of hydrogen and natural gas. Proc. CSU-EPSA. 34 (8), 51–59. doi:10.19635/j.cnki.csu-epsa.000935
Qu, K. P., Huang, L. N., Yu, T., and Zhang, X. S. (2018). Decentralized dispatch of multi-area integrated energy systems with carbon trading. Proc. CSEE 38 (03), 697–707. doi:10.13334/j.0258-8013.pcsee.170602
Shi, S. S., Wang, H. J., Fang, C., Ling, Z., Yang, X., and Li, Y. (2018). “Optimal scheduling of integrated energy system combined with demand side flexible loads,” in Proceedings of the international conference on information Technology and electrical engineering (New York, NY: Assoc Computing Machinery). 10036-9998 USA, 1–6. doi:10.1145/3148453.3306290
Wan, W. X., Ji, Y. N., Yin, L., and Wu, H. (2021). Application and prospect of carbon trading in the planning and operation of integrated energy system. Electr. Meas. &Instrumentation 58 (11), 39–48. doi:10.19753/j.issn1001-1390.2021.11.006
Wang, Y. Q., Qiu, J., Tao, Y. C., Zhang, X., and Wang, G. B. (2020). Low-carbon oriented optimal energy dispatch in coupled natural gas and electricity systems. Appl. energy 280 (15), 115948. doi:10.1016/j.apenergy.2020.115948
Wang, Z. S., Shi, Y., Tang, Y. M., Men, X. Y., Cao, J., and Wang, H. J. (2019). Low carbon economy operation and energy efficiency analysis of integrated energy systems considering LCA energy chain and carbon trading mechanism. Proceeding CSEE 39 (06), 1614–1626+858. doi:10.13334/j.0258-8013.pcsee.180754
WangQiu, Y. Q. J., and Tao, Y. C. (2022). Robust energy systems scheduling considering uncertainties and demand side emission impacts. Energy 239, 122317. doi:10.1016/j.energy.2021.122317
Wei, F. R., Sui, Q., Lin, X. N., Li, L., Chen, L., Zhao, B., et al. (2018). Energy control scheduling optimization strategy for coal-wind- hydrogen energy grid under consideration of the efficiency featyres of hydrogen production equipment. Proceeding CSEE 38 (05), 1428–1439. doi:10.13334/j.0258-8013.pcsee.170044
Wu, J., de, G., Tan, Z. F., and Zhang, S. (2021). Multi-objective coordinated optimization model for integrated energy systems with power-to-gas and combined-cooling-heating-power technologies. Electr. Measurement& Instrum. 58 (05), 20–30. doi:10.19753/j.issn1001-1390.2021.05.004
Xu, H., Dong, S. F., He, Z. X., Shi, Y. S., Wang, L., and Liu, Y. Q. (2019). Electro-thermal comprehensive demand response based on muti-energy complementarity. Power Syst. Technol. 43 (02), 480–489. doi:10.13335/j.1000-3673.pst.2018.2234
Yang, D., Liu, J. R., Yang, J. X., and Ding, J. (2015). Carbon footprint of wind turbine by life cycle assessment. Acta Sci. Cricumstantiae 35 (03), 927–934. doi:10.13671/j.hjkxxb.2014.0906
Yang, J. G., Liu, W. M., Li, S. X., Deng, T. H., Shi, Z. P., and Hu, Z. C. (2017). Optimal operation scheme and Benefit analysis of wind-hydrogen power systems. Electr. Power Constr. 38 (01), 106–115. doi:10.3969/j.issn.1000-7229.2017.01.014
Yang, N., Wang, B., Liu, D. C., Zhao, J., and Wang, H. (2013). An integrated supply-demand stochastic optimization method considering large-scale wind power and flexible load. Proc. CSEE 33 (16), 63–69+17. doi:10.13334/j.0258-8013.pcsee.2013.16.015
Zhang, X. H., Liu, X. Y., and Zhong, J. Q. (2020). Integrated energy system planning considering a reward and punishment ladder-type carbon trading and electric-thermal transfer load uncertainty. Proc. CSEE 40 (19), 6132–6142. doi:10.13334/j.0258-8013.pcsee.191302
Zheng, X. D., Xu, Y., Li, Z. M., and Chen, H. Y. (2021). Co-optimisation and settlement of power-gas coupled system in day-ahead market under multiple uncertainties. IET Renew. power Gener. 15 (8), 1632–1647. doi:10.1049/rpg2.12073
Nomenclature
Keywords: integrated energy system, hydrogen energy utilization, life cycle assessment, wind power consumption, low carbon economy
Citation: Xie W and Li X (2023) Low-carbon economic operation of IES based on life cycle method and hydrogen energy utilization. Front. Energy Res. 11:1177595. doi: 10.3389/fenrg.2023.1177595
Received: 01 March 2023; Accepted: 18 April 2023;
Published: 10 August 2023.
Edited by:
Zhengmao Li, Nanyang Technological University, SingaporeReviewed by:
Shuai Yao, Cardiff University, United KingdomXiaodong Zheng, Southern Methodist University, United States
Yunqi Wang, Monash University, Australia
Copyright © 2023 Xie and Li. This is an open-access article distributed under the terms of the Creative Commons Attribution License (CC BY). The use, distribution or reproduction in other forums is permitted, provided the original author(s) and the copyright owner(s) are credited and that the original publication in this journal is cited, in accordance with accepted academic practice. No use, distribution or reproduction is permitted which does not comply with these terms.
*Correspondence: Xiaoyun Li, MTE0ODkxNzIwMEBxcS5jb20=