 Dong Hui
 Longxin Li1
- 1Exploration and Development Research Institue, PetroChina Southwest Oil and Gasfield Company, Chengdu, Sichuan, China
- 2The State Key Laboratory of Oil and Gas Reservoir Geology and Exploitation, Southwest Petroleum University, Chengdu, Sichuan, China
- 3Research Institute of Shale Gas, PetroChina Southwest Oil and Gasfield Company, Chengdu, Sichuan, China
- 4Northeast Sichuan Operating Branch of PetroChina Southwest Oil and Gasfield Company, Chengdu, Sichuan, China
Knowledge of the interaction mechanisms between shale and CH4/CO2 is crucial for the implementation of CO2 sequestration with enhanced CH4 recovery (CS-EGR) in shale reservoir. As one of the main constituents of shale, clay minerals can profoundly affect the storage capacity of gases in nanopores. In this paper, the adsorption behaviors of both CO2 and CH4 on montmorillonite, illite as well as kaolinite under dry condition are investigated by Grand Canonical Monte Carlo (GCMC) simulation. The results exhibit that the maximum adsorption capacity of single-component CH4 and CO2 is associated with the types of clay crystals. Specifically, the montmorillonite has the strongest adsorption capacity for CO2, followed by illite and kaolinite, while the sequence in maximum adsorption capacity of CH4 is predicted in the order of kaolinite > montmorillonite > illite. These discrepancies are closely related to the characteristics of adsorbate molecules as well as the different structures of clay crystals. Meanwhile, the maximum adsorption capacity of CH4 in studied clay minerals gradually decreases as pore size increases, while nanopores with 2-nm basal spacing demonstrate the highest adsorption capacity for CO2. In addition, it is observed that the studied clay minerals tend to preferentially adsorb CO2 rather than CH4 during binary gas mixtures simulation. The selectivity of CH4/CO2 mixtures in montmorillonite and kaolinite exhibits various performances as the adsorption pressure increases, with the selectivity in montmorillonite being the largest, especially at low pressure. The cation exchange significantly enhances the electrostatic interaction with CO2 molecules, leading to a higher loading of CO2 as well as larger value of selectivity. These findings can provide basis and guidance for the CS-EGR project in shale reservoirs.
1 Introduction
Due to low carbon emissions as well as significant increases in reserves and production, shale gas has received great attention and changed the global energy framework. Recently, with the continuous progress of drilling and fracturing technology, China has made breakthroughs in shale gas development. At least four shale gas reservoirs (Fuling, Weiyuan, Changning, Chuan’nan) have been commercially developed (Zhu et al., 2018; Mei et al., 2022). As the first and most commercial shale gas field in China, the cumulative gas production of Fuling has exceeded 28.7 BCM (billion cubic meters) in 2019 (Nie et al., 2020), proving the feasibility of shale gas revolution in China. On the other hand, owing to the large amount of greenhouse gas emissions, the world is facing an increasingly serious problem of climate change. To address this issue, carbon capture and storage (CCS) is considered as one of the feasible solutions, which may contribute up to about a third of CO2 emission reductions by 2050 (Jiang et al., 2020). Conventional CO2 storage sites include saline aquifer, coal seam and depleted oil/gas reservoir (Pruess and Spycher, 2007; Biagi et al., 2016; Han et al., 2019; Zhang et al., 2023). Nevertheless, unconventional shale reservoirs lend themselves extremely well to CO2 sequestration in virtue of strong storage capacity as well as greater affinity for CO2 (Busch et al., 2008).
Shale formation is characterized by extremely low porosity and permeability. Generally, the shale gas in the nanopores mainly exists in adsorbed, free and dissolved phase, demonstrating a in-situ reservoir-generating and reservoir-storing mode. Among these different occurrence states, the adsorbed CH4 can account for almost 30%–80% of the total amount (Chen et al., 2019), indicating that CH4 in adsorbed state plays a key role in shale resource.Injecting CO2 into shale gas reservoir can not only realize carbon storage, but also increase the production of shale gas in nanopore system, which is the so-called CO2 sequestration with enhanced CH4 recovery (CS-EGR) technology (Biagi et al., 2016). A recent field practice of injecting CO2 into Chattanooga Shale formation showed that the flow rate of shale gas was obvious increased after soaking process (Louk et al., 2017), further confirming the feasibility and potential of CS-EGR technology. Understanding the adsorption mechanisms of CH4 and CO2 within the shale nanopores under geological condition is crucial for the implementation of CS-EGR project.
Shale is consisted of organic matter and various minerals. Recent studies based on adsorption experiments with gravimetric and volumetric measurements indicated that the content and types of clay minerals (including kaolinite, montmorillonite, illite, et al.) in shale play an important role in the amount of gas adsorption (Ji et al., 2012; Duan et al., 2016). These clay minerals are rich in numerous micropores and mesopores, providing lots of adsorption sites for the occurrence of gas (Zhu et al., 2021). A positive correlation was found between CH4 adsorption capacity and the values of surface area in clay-dominated shale samples (Ji et al., 2012). Moreover, although lots of adsorption measurements have revealed that there are significant differences in the adsorption capacity of various clay minerals for CH4 and CO2, the relevant mechanisms concerning these discrepancies between clay minerals and gases are still unknown.
Since it is a challenging work to understand these microscopic mechanisms by experimental tests, recently lots of scholars attempted to determine CH4/CO2 adsorption behaviors using computational molecular simulation method at microscopic level, including both molecular dynamic (MD) and Grand Canonical Monte Carlo (GCMC) simulation. Prior researches mainly focused on sorbents (CH4 and CO2) on single material surface, such as activated-carbon material (Tenney and Lastoskie, 2006; Liu and Wilcox, 2012; Song et al., 2018), coal (Han et al., 2017; Lu et al., 2023), kerogen (Collell et al., 2014; Michalec and Lísal, 2016; Huang et al., 2018; Pang et al., 2019), illite (Zhang et al., 2016; Chong and Myshakin, 2018), montmorillonite (Yang et al., 2015; Hu et al., 2018; Wang and Huang, 2019), kaolinite (Zhang et al., 2018; Zhou et al., 2019), calcite (Sun et al., 2017; Cui et al., 2022). Song et al. (2018) performed GCMC simulation to study the influence of pore morphology and structure on the adsorption capacity of CH4, they found that different pore morphology characteristics exhibit diverse adsorption density and excess adsorption isotherm. Huang et al. (2018) used GCMC method to evaluate the effect of moisture and kerogen maturity on adsorption behavior of CH4, and their results revealed that the adsorption capacity of CH4 enhances with increasing kerogen maturity while weakens with the increase of water content. Sun et al. (2017) concluded that compared with graphene surface, the interactions between calcite surface and CO2 are much more stronger, which may be caused by the charge properties of calcite surface. Jin and Firoozabadi (2014) believed that the chemical heterogeneity of montmorillonite affects the adsorption mechanisms of gases, and the cation exchange in clay crystals can obviously increase the adsorption of CO2 molecules at low pressure. Wang et al. (2018) studied the competitive adsorption mechanisms of binary gas mixtures in kerogen. It is observed that due to the strong affinity of oxygen-containing functional groups in kerogen for CO2, kerogen pores exhibit preferential adsorption of CO2 compared to CH4.The above literatures provide instructional significance for the study of gases adsorption mechanisms in nanopores, however, as mentioned before, due to the chemical heterogeneity and complex structural properties of various clay crystals, these microscopic adsorption mechanisms of both pure CH4/CO2 and their binary mixtures in different clay minerals have not been systematically compared and analyzed.
In this work, three slit-like clay mineral models, including montmorillonite, illite as well as kaolinite, with different sizes (1, 2, and 4 nm) were established based on the pore morphology characteristics of clay minerals in shale. Then the GCMC simulation was conducted to evaluate the adsorption behaviors of pure CO2 and CH4 as well as their mixtures within the typical clay minerals in-depth. The results achieved from this paper can enrich the theoretical knowledge of microscopic adsorption interactions between clay minerals and CH4/CO2 within shale nanopore system, providing meaningful guidance for CS-EGR project.
2 Models and methodology
2.1 Models
The simulation system is composed of adsorbate including methane, carbon dioxide and adsorbent, such as montmorillonite, illite, as well as kaolinite. The montmorillonite model adopted in our simulation is sodium-saturated Wyoming-type montmorillonite with the unit cell chemical formula of Na0.75 [Si7.75Al0.25] (Al3.5Mg0.5)O20(OH)4, comprising typical tetrahedral-octahedral-tetrahedral (TOT) layers (Skipper et al., 1991). On the basis of the formula, one Si4+ is substituted by Al3+ every 32 Si4+ in the tetrahedral sheet, while one Al3+ is substituted by Mg2+ every 8 Al3+ in the octahedral sheet. And the interlayer Na+ can be used to equilibrium negative charge caused by these isomorphic substitution. Illite is also a typical 2:1 clay mineral, and the structure parameters of illite unit used in this work are established by Drits et al. (2010), with the chemical formula of KAl4(Si7Al)O20(OH)4. Isomorphic substitutions are achieved by substituting Si4+ by Al3+ every 8 Si4+, and the interlayer K+ is used to balance the negative layer charge. Kaolinite is composed of alumina octahedral and silica tetrahedron, showing typical characteristics of 1:1 clay mineral, with the composition of Si4Al4O10(OH)8. The structure parameters of the kaolinite unit are determined by Bish and Von Dreele (1989). The simulation box contains two layers of the clay sheets with different basal spacings (1nm, 2nm and 4 nm) in between, forming slit-like pore structure.
2.2 Force field
The ClayFF force field, based on precise representation of the metal-oxygen interactions between hydrated crystalline compounds and aqueous solutions (Cygan et al., 2004), is selected for the clay minerals. The potential model taken for the CO2 molecule is from the study of Cygan et al. (2012). This potential model can not only better reproduce the physicochemical properties of CO2, but also accurately describe the interaction between CO2 and silicate minerals. The charge of carbon and oxygen atom in CO2 molecule is +0.6512e and −0.3256e, respectively. Furthermore, the potential model adopted for CH4 molecule is obtained from the TraPPE force field, which is created to describe thermodynamic characteristics of alkane (Martin and Siepmann, 1998). The hydrogen and carbon atom in CH4 molecule are treated as a united atom without charge.
2.3 Simulation detail
The adsorption characteristics of pure CO2 and CH4 as well as their mixtures in slit-like pores of clay minerals are determined using the GCMC method. Generally, the GCMC simulation is conducted in the
In general, the adsorption amount achieved directly by experimental measurement is the excess adsorption amount, while it is worthy noting that the output of GCMC adsorption denotes the total loading number of molecules known as total adsorption amount. According to relevant literature (Rouquerol et al., 1999), the excess adsorption amount is defined as the product of adsorbed volume with the difference of adsorbed density and bulk density. Therefore, during the simulation, the excess adsorption amount per surface area of the adsorbent could be achieved by the Eq 1 (Pang et al., 2019).
where
where
3 Results and discussion
3.1 Model validation
The reasonability of these clay mineral models as well as the accuracy of simulation method need to be verified by comparing the simulation amount with experimental results. In general, the excess adsorption isotherms obtained by GCMC method are normalized by surface area of the basal spacing to unify the same comparison standard with the experimental measurement (Chen et al., 2017). Figure 1 shows excess adsorption isotherms of pure CH4 and CO2 on illite calculated in this work and relevant experimental data documented by previous literatures (Heller and Zoback, 2014; Jeon et al., 2014). It is observed that these excess adsorption isotherms obtained from experimental test and simulation are in the same order of magnitude and exhibit good consistency. Meanwhile, it should be noted that the slight deviation between the simulated and experimental isotherms is a normal phenomenon, because the clay crystals used in the simulation are ideal models, which may deviate from the minerals in the actual experiment. Besides, the pore size used for each adsorption simulation is a fixed value, while the pores in natural clay minerals are featured by multi-scale characteristics. In addition, the values of surface area used in the experimental tests were obtained from low-pressure N2 adsorption method, which cannot reflect the characteristics of micropores. Overall, the simulation results are acceptable, and these clay mineral models and GCMC method can be applied to further investigate the interactions between gases and clay minerals.
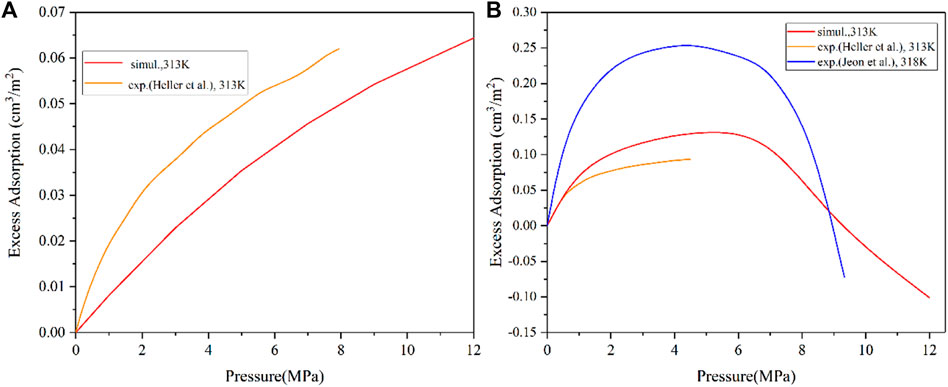
FIGURE 1. Comparison of the experimental and simulated isotherms of CH4 (A) and CO2 (B) on illite.
3.2 Adsorption behavior of pure CH4
Figure 2 depicts the adsorption isotherms as well as the fitting curves of CH4 using DR-based model in clay minerals with varying pore sizes (1nm, 2nm and 4 nm) at 313 K. It is observed that the shape of the adsorption curves can be classified as Type-I according to the classification of Aranovich and Donohue (1998), reflecting the characteristic of microporous adsorbent. The total adsorption isotherms of CH4 in different clay minerals display a similar variation tendency, that is, the total adsorption amount of CH4 gradually increases with the increase of pressure and pore size. This is because limited storage space of smaller pores is not conducive to the occurrence of gas, and a larger pore diameter can provide more space for the loading of molecules. The excess isotherms demonstrate a maximum with increasing pressure, showing typical characteristic of high-pressure adsorption (Zhou et al., 2018). However, it should be noted that the increase of total adsorption amount is not entirely from the contribution of adsorbed molecules. According to the fitting results of DR-based model as shown in Table 1, the increase of pore size will lead to the continuous decrease of CH4 adsorption capacity and the adsorbed phase density in various clay minerals, which may be due to the decrease of the coupling surface-gas interaction from the two sides of the walls as basal spacing increases from 1 nm to 4 nm.
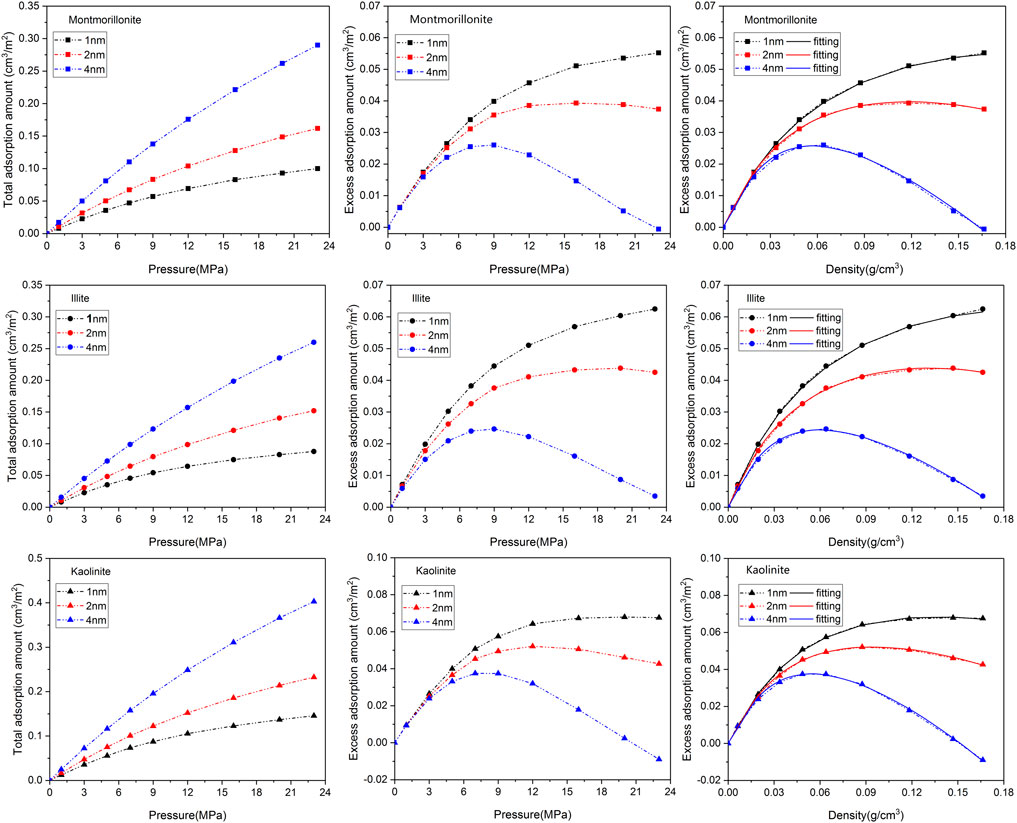
FIGURE 2. Adsorption isotherms as well as the fitting curves of CH4 in three clay minerals with different basal spacings.
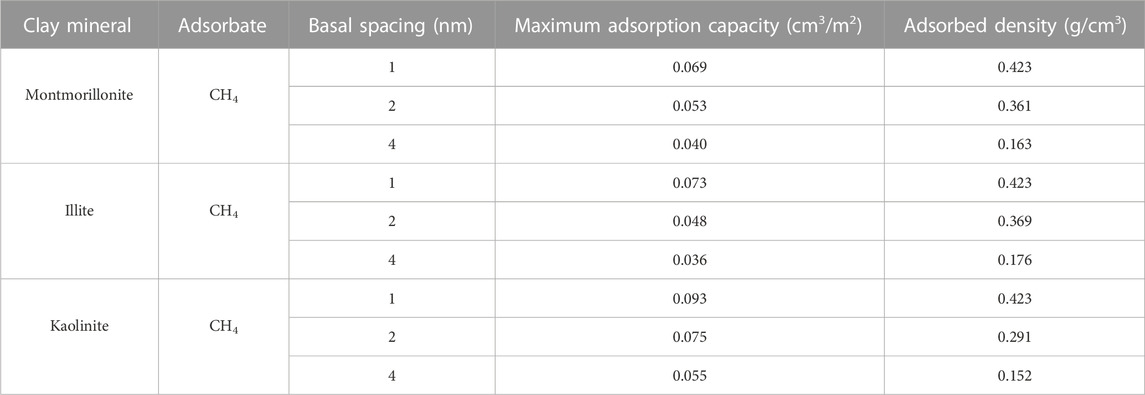
TABLE 1. The fitting results of CH4 excess isotherms by the DR-based model.
On the other hand, it is found that the maximum CH4 adsorption capacity of kaolinite is larger than that of illite and montmorillonite under the same pore size. This is an interesting phenomenon. As a non-polar molecule, the interactions between clay minerals and CH4 are dominated by van der Waals force (Wang and Huang, 2019). Different from montmorillonite and illite crytals, the surface of kaolinite model used in this work contains a large number of hydroxyl groups, which may strengthen the interaction mechanism of CH4 with kaolinite. Similar observations have been noticed by previous literature (Liu and Hou, 2020). In order to gain insights into these different adsorption behaviors of CH4 in clay minerals, the isosteric adsorption heat of CH4 in montmorillonite, illite and kaolinite under 20 MPa is quantitatively evaluated by Eq 3(Fokion and (3Alan) L, 1991):
where the Qst denotes the isosteric adsorption heat between adsorbent and adsorbate, T is the temperature in the system, R is the universal gas constant,
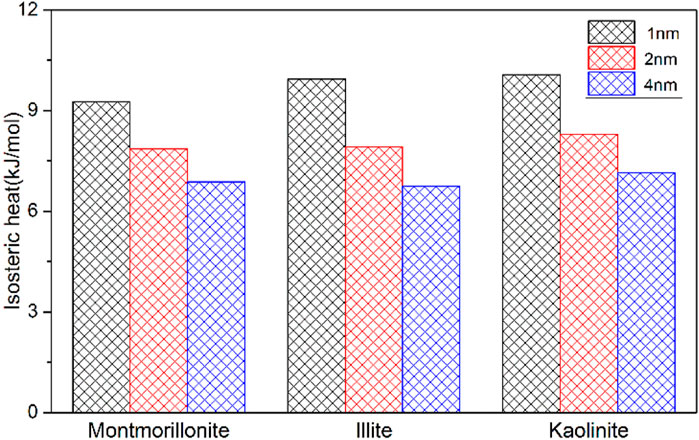
FIGURE 3. Isosteric adsorption heat of CH4 in three clay minerals with different basal spacings.
3.3 Adsorption behavior of pure CO2
A comparison of CO2 isotherms in three clay minerals with different basal spacings is illustrated in Figure 4 as a function of pressure. Interestingly, similar Type-I shape presented in CH4 isotherm is also observed in CO2 adsorption curves. The variation in CO2 adsorption amount of the different clay crystals exhibits a similar pattern. It is clearly seen that the loading number of CO2 molecules obviously increase with increasing pressure. For the nanopores with 1 nm or 2 nm basal spacing, the adsorption amount of CO2 is more easily to approach saturation as the adsorption pressure increases from 1 MPa to 9 MPa. In addition, it appears that the pore size of the clay crystals plays a more complex role in CO2 adsorption behavior. A careful analysis of Figure 4 further demonstrates that in low pressure range the total adsorption amount of CO2 in micropore (1 nm) is larger than that in mesopore (2nm and 4 nm), which may result from the overlapping effect of the stronger interactions between CO2 and the cation exchange near the two clay planes. This phenomenon is not unusual and similar observation has been reported by Yang et al. (2015). Moreover, it is also seen from Figure 4 that the CO2 excess adsorption amount first reaches a maximum at around 10–15 MPa, and then decreases with the increase of pressure, even becomes negative at higher pressures. The nonmonotonic behavior of CO2 excess isotherm with maximum has been widely observed on various adsorbents by both simulation and experiment (Pini et al., 2010; Liu and Wilcox, 2012; De Silva and Ranjith, 2014; Merey and Sinayuc, 2016).
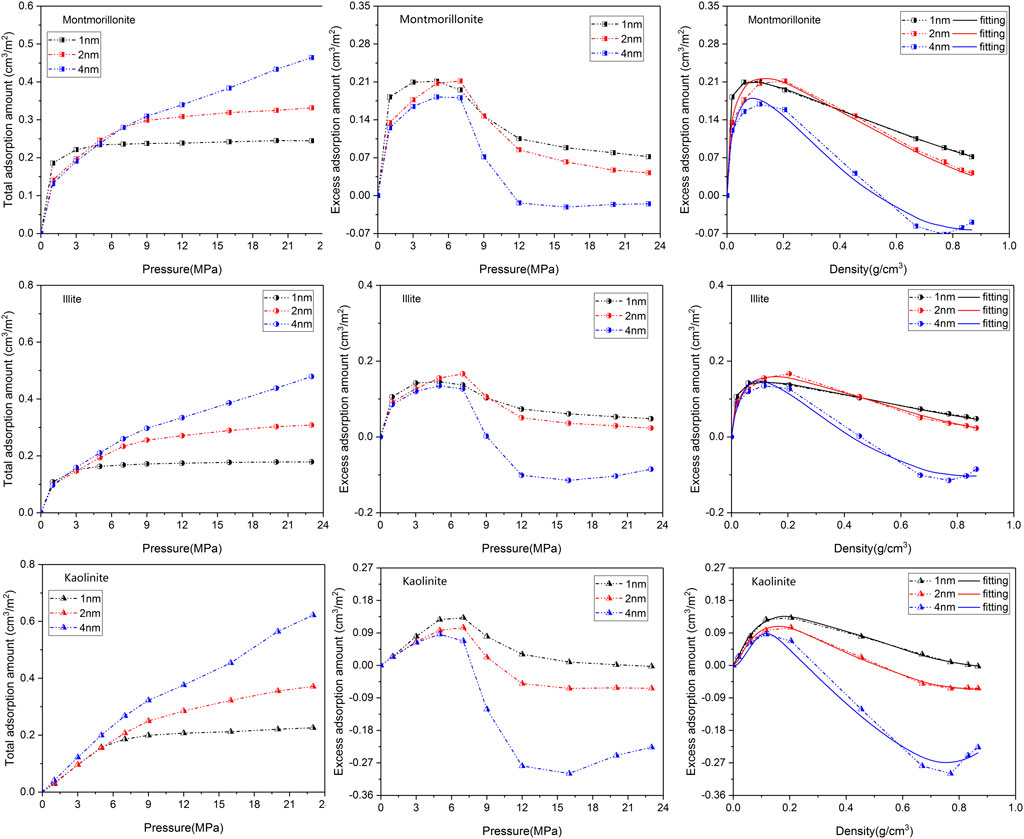
FIGURE 4. Adsorption isotherms as well as the fitting curves of CO2 in three clay minerals with different basal spacings.
Table 2 gives the maximum CO2 adsorption capacity of the three clay minerals with different basal spacings. It appears that the interaction mechanisms between CO2 and clay minerals are more complicated compared with CH4. As can be seen from Figure 4; Table 2 that the sequence in maximum CO2 adsorption capacity obtained by the DR-based model is in the order of montmorillonite > illite > kaolinite. Interestingly, kaolinite shows the smallest adsorption capacity to CO2 while the highest adsorption capacity to CH4. In addition, in contrast to CH4, the maximum CO2 adsorption capacity of the clay minerals does not decrease continuously with the increase of pore size. As seen from Table 2, as pore size increases from 1 nm to 2nm, the maximum CO2 adsorption capacity of montmorillonite, illite and kaolinite increases from 0.276 cm3/m2, 0.211 cm3/m2 and 0.179 cm3/m2 to 0.374 cm3/m2, 0.304 cm3/m2 and 0.248 cm3/m2, respectively. However, when the basal spacing further increases to 4 nm, the maximum CO2 adsorption capacity of the clay crystals all show an obvious decreasing trend, indicating that the optimal storage space of CO2 in clay minerals may be around 2 nm.
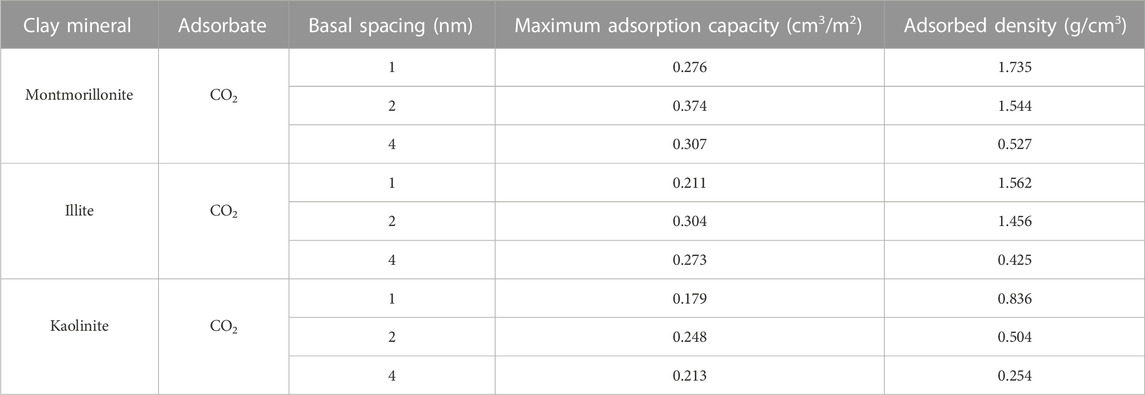
TABLE 2. The fitting results of CO2 excess isotherms by the DR-based model.
The effect of crystal types on CO2 adsorption behaviors and the variation of the maximum CO2 adsorption capacity with varying pore sizes are related to the characteristics of CO2 and different crystal structures. CO2 is a polar molecule with strong quadrupole moment (Jin and Firoozabadi, 2013; Deng et al., 2023). During the process of CO2 adsorption, in addition to van der Waals interaction energy, the electrostatic energy between clay minerals and CO2 also plays a key role. Figure 5 displays the contribution of different forces in interaction energy between the 2-nm clay minerals and CO2 molecules under 20 MPa. As illustrated in Figure 5, both electrostatic energy and van der Waals energy contribute to the interaction energy. For montmorillonite and illite with cation exchange, the electrostatic energy contributes almost half of the total energy. Therefore, the limited pore volume of smaller pore (such as 1 nm) may limit the effect of strong electrostatic adsorption energy induced by CO2 and charged clay crystals. As the basal spacing increases to 2 nm, the CO2 adsorption capacity is further enhanced due to enough space, while when the pore size continuously increases to 4 nm, the larger width will weaken the overlapping effect of the two mineral surfaces, leading to the reduction of the adsorption capacity.
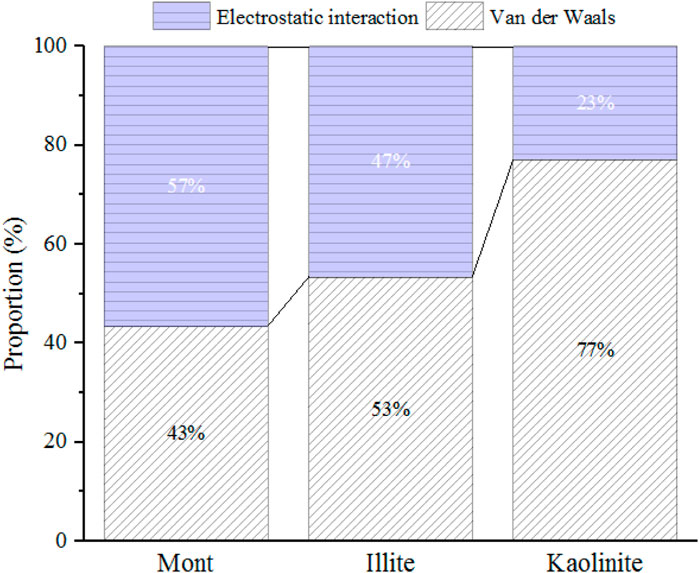
FIGURE 5. The proportion of electrostatic and van der Waals energy in the interaction energy between 2-nm clay minerals and CO2 under 20 MPa.
Furthermore, the stronger electrostatic interaction induced by CO2 and the cation exchange in illite and montmorillonite can significantly promote the adsorption behavior of CO2, especially at lower pressure. It is also seen from Figure 4 that compared with kaolinite, the total adsorption amount of CO2 on montmorillonite and illite is obviously enhanced in 1∼3 MPa pressure range due to the interlayer cations. These interlayer cations can also greatly effect the morphology of CO2 in the nanopore. Figure 6 presents the adsorption configuration of CO2 molecules in 2-nm crystal pores at 20 MPa. It is found that in the montmorillonite model, the CO2 molecules near the mineral surface are concentrated around Na+ cations. The distribution pattern of CO2 molecules in illite is similar to that of CO2 molecules in montmorillonite, in which the CO2 molecules close to the walls of the crystal are oriented toward K+ cations. However, different from illite and montmorillonite, the CO2 molecules in kaolinite close to the model surface are almost parallel to the crystal sheets, showing an orientation preference. In addition, hydrogen bonds are observed between some CO2 molecules and the hydroxyl groups in kaolinite crystal model.
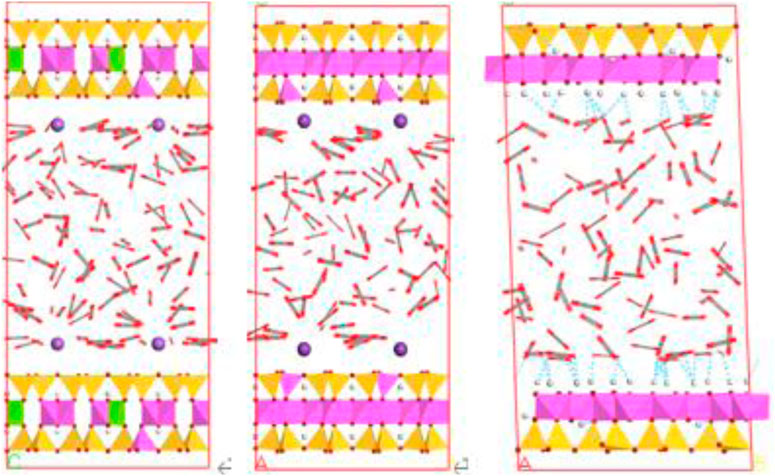
FIGURE 6. Snapshots of configurations of CO2 molecules in different clay minerals.
Based on the results in Tables 1, 2, the ratio of maximum adsorption capacity of pure CO2 to CH4 in different clay minerals is further compared and analyzed as illustrated in Figure 7. Obviously, the maximum adsorption capacity of CO2 in different pore sizes of various clay minerals is always larger than that of CH4. From the perspective of CS-EGR project, this conclusion is quite favourable. Specifically, the CO2 adsorption capacity of clay minerals is almost 2–8 times than that of CH4, and among these clay minerals the montmorillonite shows the best performance of preferential adsorption capacity, followed by illite and kaolinite. This conclusion is in line with previous experimental measurements (Kang et al., 2011; Heller and Zoback, 2014). According to the research by Heller and Zoback (2014) and Kang et al. (2011), for pure gases, the maximum adsorption capacity of CO2 is almost 2–10 times greater than that of CH4 in shale samples. Moreover, an in-depth analysis from Figure 7 reveals that the preferential CO2 adsorption capacity of the clay crystals is further enhanced due to the increase of basal spacing, while the extent of improvement under different pore sizes exists discrepancies. For example, it is interesting to note that the adsorption capacity ratio of CO2 to CH4 shows an obvious improvement from 4.0 to 7.0 as the basal spacing rises from 1 to 2 nm, while the ratio slowly increases to 7.6 when the pore size further reaches to 4nm, implying that it is favorable for CO2 to replace CH4 molecules in smaller mesopore.
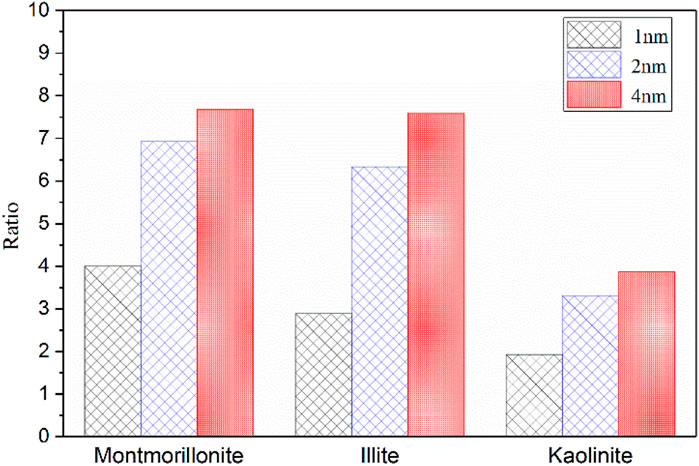
FIGURE 7. The ratio of maximun adsorption capacity of CO2 to CH4 in three clay minerals with different basal spacings.
3.4 Adsorption behavior of CO2/CH4 binary mixtures
The GCMC simulation is also applied to further determine competitive adsorption behaviors of CO2/CH4 binary mixtures. Considering the differences in chemical and physical properties of the different clay minerals, the montmorillonite and kaolinite crystals are selected to compare the competitive adsorption mechanisms of the binary gas mixtures with and without the effect of cation exchange. Figure 8 shows the adsorption isotherms of gas mixtures (50.0 mol%:50.0 mol%) in 2-nm montmorillonite and kaolinite nanopore with increasing pressure. It is found that for montmorillonite the CO2 isotherm shows a steep rise in low pressure range before approaching saturation, while a relatively slow rising trend is observed in the CO2 isotherm for kaolinite at low pressure. Comparatively, CH4 isotherms of both montmorillonite and kaolinite exhibit a gradual increase tendency with increasing loading. These different behaviors of isotherms are in accord with the performance of pure CH4 and CO2 in corresponding clay mineral. Furthermore, the adsorption amount of CO2 in both kaolinite and montmorillonite is obviously higher than that of CH4 in the whole adsorption pressure range, which is related to the interaction of charged clay structures and CO2 molecules, especially the stronger electrostatic interaction induced by CO2 and Na+ cations in montmorillonite. Such a large contrast in CO2 and CH4 adsorption amount is further favourable to implement the CS-EGR project. Moreover, in order to quantitatively study the selective adsorption capacity of binary gas mixtures in clay minerals, the adsorption selectivity
where xi is the molar fractions of component i in the clay pores, yi is the molar fractions of component i in the bulk gas reservoir. Figure 9 depicts the adsorption selectivity of CO2/CH4 mixtures in 2-nm montmorillonite and kaolinite pores as a function of pressure. Notably, the values of adsorption selectivity in both montmorillonite and kaonilite are always much larger than one over the whole pressure range, confirming that the clay minerals have a stronger affinity for CO2. Moreover, the montmorillonite exhibits larger selectivity than kaolinite under the same adsorption pressure, implying that montmorillonite can store more CO2 with more CH4 being recovered compared with kaolinate at the same condition. Similar results have been found by Liu and Hou (2020). It is observed from Figure 9 that the selectivity of CH4/CO2 in montmorillonite reduces sharply as the pressure increases from 0 MPa to 5 MPa, and then decreases slowly with further increase of pressure. It appears that for shale gas reservoirs rich in montmorillonite, lower pressure conditions are more favorable for CO2 to replace CH4. In other words, the depleted montmorillonite-rich formations are the best candidate for the implementation of CS-EGR. However, the selectivity of CH4/CO2 in kaolinite presents a slight fluctuation trend with increasing pressure, indicating that for kaolinite-rich reserviors the influence of pressure on the competitive adsorption behavior of CO2/CH4 mixtures is relatively insignificant.
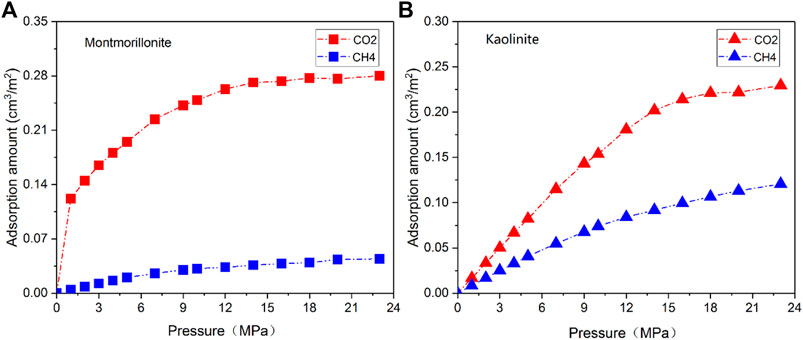
FIGURE 8. Adsorption isotherms of CO2/CH4 mixtures in 2-nm montmorillonite (A) and kaolinite (B) nanopore.
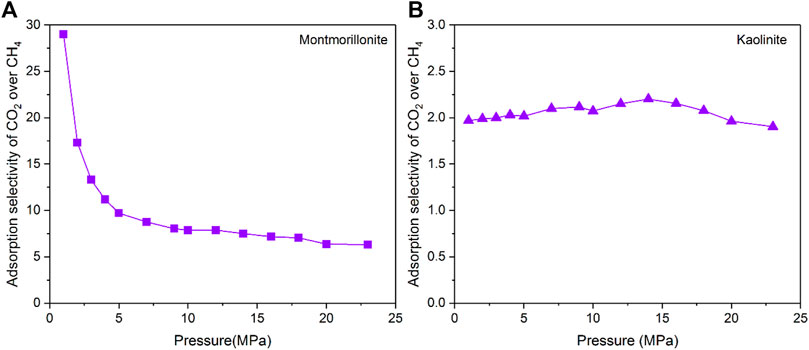
FIGURE 9. Adsorption selectivity of CO2/CH4 in 2-nm montmorillonite (A) and kaolinite (B) nanopore.
Figures 10, 11 show the configuration snapshots of CO2/CH4 mixtures in the 2-nm montmorillonite and kaolinite nanopores, respectively. Interestingly, it is observed from Figure 10 that the CO2 molecules preferentially occupy the adsorption sites near Na+ at lower coverage, forcing CH4 molecules away from the wall surface. As a consequence, almost few CH4 molecules can be found near the cation exchange, and the existing CH4 molecules are randomly dispersed in the pore space. With increasing coverage, CO2 molecules start to adsorb in the area away from the walls and coexist with small amount of CH4 molecules. Finally, the CH4 molecules are aggregated in the center of pore because of the extrusion effect of CO2 molecules as the adsorption pressure increases to 20 MPa. On the other hand, although CO2 molecules hold most of the adsorption sites in kaolinite surface, a small amount of CH4 molecules can still adsorb near the crystal walls under different adsorption pressures as shown in Figure 11, indicating that kaolinite can provide a small amount of adsorption sites for CH4 during the competitive adsorption process. With increasing loading, both CH4 and CO2 molecules gradually increase in proportion and distribute irregularly in the pore space. These changes in Figure 10 and Figure 11 can clearly reveal the essence for the differentially preferential adsorption amount of CO2 over CH4 in montmorillonite and kaolinite.
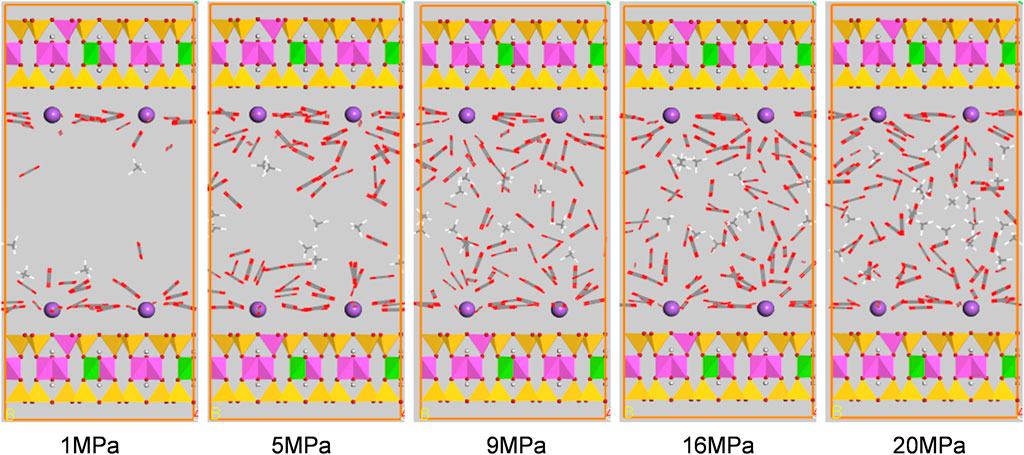
FIGURE 10. Snapshots of configurations of CO2/CH4 mixtures in 2-nm montmorillonite nanopore under different pressures.
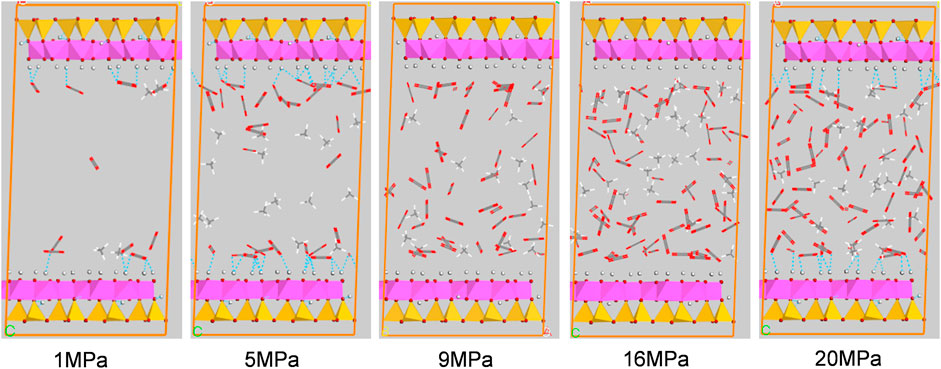
FIGURE 11. Snapshots of configurations of CO2/CH4 mixtures in 2-nm kaolinite nanopore under different pressures.
4 Conclusion
The adsorption behaviors of pure CH4/CO2 and their binary mixtures on typical clay minerals are comprehensively determined using GCMC simulation. The influence of pore size and types of clay crystals on adsorption isotherms and maximum adsorption capacity are discussed. In addition, the differences in adsorption mechanisms between CO2 and CH4 on clay minerals are investigated from the perspectives of isosteric heat and configurations of adsorbed molecules. The major findings are summarized as follows:
(1) The adsorption isotherms of both CO2 and CH4 in clay nanopores are belong to Type-I, reflecting the characteristics of microporous adsorbents. For pure gas adsorption, the maximum adsorption capacity of CO2 and CH4 on different clay minerals varies significantly due to the discrepancies in the chemical and physical properties of adsorbate molecules as well as the crystal structures. The montmorillonite exhibits the highest adsorption capacity for CO2, followed by illite and kaolinite, while the sequence in adsorption capacity of CH4 is predicted in the order of kaolinite > montmorillonite > illite.
(2) The pore size plays an important role in the maximum adsorption capacity of CH4 and CO2. Specifically, the maximum adsorption capacity of CH4 decreases with the increase of pore size, which is related to the decrease of overlapping effect caused by the two surfaces of clay crystals. Nevertheless, the clay pores with 2-nm basal spacing demonstrate the highest adsorption capacity for CO2. It is inferred that smaller pore space may limit the effect of strong electronic interactions between CO2 and charged clay structure.
(3) During the binary-component gas adsorption, the selectivity of CH4/CO2 molecules in montmorillonite and kaolinite shows various performances as the adsorption pressure increases, with the selectivity in montmorillonite being larger, especially at low pressure, which implies that the delepetd montmorillonite-domanited formations are the best candidate for the implementation of CS-EGR. The cation exchange significantly enhances the electrostatic interactcion with CO2 molecules, leading to a higher loading of CO2 as well as the larger selectivity.
Data availability statement
The original contributions presented in the study are included in the article/Supplementary material, further inquiries can be directed to the corresponding authors.
Author contributions
DH was responsible for methodology and writing. YP was responsible for conceptualization and resources. LL and YZ were responsible for data curation; TL was responsible for funding acquisition; XP and CJ were responsible for supervision and technical support. All authors contributed to the article and approved the submitted version.
Funding
All the work reported in the study was financially supported by CNPC’s major science and technology project “Research and Application of Key Technologies for the Production of 30 Billion Cubic Meters of Natural Gas in Southwest Oil and Gas Field”(No. 2016E-06).
Conflict of interest
Authors DH, LL, XP, TL, CJ, and YZ were employed by PetroChina Southwest Oil and Gasfield Company.
The remaining author declares that the research was conducted in the absence of any commercial or financial relationships that could be construed as a potential conflict of interest.
Publisher’s note
All claims expressed in this article are solely those of the authors and do not necessarily represent those of their affiliated organizations, or those of the publisher, the editors and the reviewers. Any product that may be evaluated in this article, or claim that may be made by its manufacturer, is not guaranteed or endorsed by the publisher.
References
Aranovich, G., and Donohue, M. (1998). Analysis of adsorption isotherms: lattice theory predictions, classification of isotherms for gas–solid equilibria, and similarities in gas and liquid adsorption behavior. J. Colloid Interface Sci. 200, 273–290. doi:10.1006/jcis.1997.5398
Aringhieri, R. (2004). Nanoporosity characteristics of some natural clay minerals and soils. Clays Clay Min. 52, 700–704. doi:10.1346/ccmn.2004.0520604
Biagi, J., Agarwal, R., and Zhang, Z. (2016). Simulation and optimization of enhanced gas recovery utilizing CO2. Energy 94, 78–86. doi:10.1016/j.energy.2015.10.115
Bish, D. L., and Von Dreele, R. B. (1989). Rietveld refinement of non-hydrogen atomic positions in kaolinite. Clays Clay Min. 37, 289–296. doi:10.1346/ccmn.1989.0370401
Busch, A., Alles, S., Gensterblum, Y., Prinz, D., Dewhurst, D., Raven, M., et al. (2008). Carbon dioxide storage potential of shales. Int. J. Greenh. Gas. Control 2, 297–308. doi:10.1016/j.ijggc.2008.03.003
Chen, G., Lu, S., Liu, K., Xue, Q., Han, T., Xu, C., et al. (2019). Critical factors controlling shale gas adsorption mechanisms on Different Minerals Investigated Using GCMC simulations. Mar. Pet. Geol. 100, 31–42. doi:10.1016/j.marpetgeo.2018.10.023
Chen, G., Lu, S., Zhang, J., Xue, Q., Han, T., Xue, H., et al. (2017). Keys to linking GCMC simulations and shale gas adsorption experiments. Fuel 199, 14–21. doi:10.1016/j.fuel.2017.02.063
Chong, L., and Myshakin, E. M. (2018). Molecular simulations of competitive adsorption of carbon dioxide – methane mixture on illitic clay surfaces. Fluid Phase Equilib. 472, 185–195. doi:10.1016/j.fluid.2018.05.019
Collell, J., Galliero, G., Gouth, F., Montel, F., Pujol, M., Ungerer, P., et al. (2014). Molecular simulation and modelisation of methane/ethane mixtures adsorption onto a microporous molecular model of kerogen under typical reservoir conditions. Microporous Mesoporous Mater 197, 194–203. doi:10.1016/j.micromeso.2014.06.016
Cui, F., Jin, X., Liu, H., Wu, H., and Wang, F. (2022). Molecular modeling on Gulong shale oil and wettability of reservoir matrix. Capillarity 5, 65–74. doi:10.46690/capi.2022.04.01
Cygan, R. T., Liang, J. J., and Kalinichev, A. G. (2004). Molecular models of hydroxide, oxyhydroxide, and clay phases and the development of a general force field. J. Phys. Chem. B 108, 1255–1266. doi:10.1021/jp0363287
Cygan, R. T., Romanov, V. N., and Myshakin, E. M. (2012). Molecular simulation of carbon dioxide capture by montmorillonite using an accurate and flexible force field. J. Phys. Chem. C 116, 13079–13091. doi:10.1021/jp3007574
De Silva, P. N. K., and Ranjith, P. G. (2014). Understanding and application of CO2 adsorption capacity estimation models for coal types. Fuel 121, 250–259. doi:10.1016/j.fuel.2013.11.051
Deng, J., Zhao, G., Zhang, L., Ma, H., and Rong, Y. (2023). CO2 adsorption and separation properties of M-MOF-74 materials determined by molecular simulation. Capillarity 6, 13–18. doi:10.46690/capi.2023.01.02
Drits, V. A., Zviagina, B. B., McCarty, D. K., and Salyn, A. L. (2010). Factors responsible for crystal-chemical variations in the solid solutions from illite to aluminoceladonite and from glauconite to celadonite. Am. Mineral. 95, 348–361. doi:10.2138/am.2010.3300
Duan, S., Gu, M., Du, X., and Xian, X. (2016). Adsorption equilibrium of CO2 and CH4 and their mixture on sichuan basin shale. Energy Fuels 30, 2248–2256. doi:10.1021/acs.energyfuels.5b02088
Dubinin, M. M. (1960). The potential theory of adsorption of gases and vapors for adsorbents with energetically nonuniform surfaces. Chem. Rev. 60, 235–241. doi:10.1021/cr60204a006
Fokion, K., and Alan, M. (1991). Isosteric heats of multicomponent adsorption: thermodynamics and computer simulations. Langmuir 7, 3118–3126. doi:10.1021/la00060a035
Han, J., Bogomolov, A. K., Makarova, E. Y., Yang, Z., Lu, Y., and Li, X. (2017). Molecular simulations on adsorption and diffusion of CO2 and CH4 in moisture coals. Energy Fuels 31, 13528–13535. doi:10.1021/acs.energyfuels.7b02898
Han, J. X., Lu, Y. J., Makarova, E. Y., Bogomolov, A. K., and Yang, Z. Z. (2019). Molecular simulation of CH4 and CO2 competitive adsorption in moisture coals. Solid Fuel Chem. 53, 270–279. doi:10.3103/s0361521919050057
Heller, R., and Zoback, M. (2014). Adsorption of methane and carbon dioxide on gas shale and pure mineral samples. J. Unconv. Oil Gas. Resour. 8, 14–24. doi:10.1016/j.juogr.2014.06.001
Hu, H., Xing, Y., and Li, X. (2018). Molecular modeling on transportation of CO2 in montmorillonite: diffusion and permeation. Appl. Clay Sci. 156, 20–27. doi:10.1016/j.clay.2018.01.019
Huang, L., Ning, Z., Wang, Q., Qi, R., Zeng, Y., Qin, H., et al. (2018). Molecular simulation of adsorption behaviors of methane, carbon dioxide and their mixtures on kerogen: effect of kerogen maturity and moisture content. Fuel 211, 159–172. doi:10.1016/j.fuel.2017.09.060
Jeon, P. R., Choi, J., Yun, T. S., and Lee, C.-H. (2014). Sorption equilibrium and kinetics of CO2 on clay minerals from subcritical to supercritical conditions: CO2 sequestration at nanoscale interfaces. Chem. Eng. J. 255, 705–715. doi:10.1016/j.cej.2014.06.090
Ji, L., Zhang, T., Milliken, K. L., Qu, J., and Zhang, X. (2012). Experimental investigation of main controls to methane adsorption in clay-rich rocks. Appl. Geochem. 27, 2533–2545. doi:10.1016/j.apgeochem.2012.08.027
Jiang, K., Ashworth, P., Zhang, S., Liang, X., Sun, Y., and Angus, D. (2020). China's carbon capture, utilization and storage (CCUS) policy: A critical review. Renew. Sustain. Energy Rev. 119, 109601. doi:10.1016/j.rser.2019.109601
Jin, Z., and Firoozabadi, A. (2014). Effect of water on methane and carbon dioxide sorption in clay minerals by Monte Carlo simulations. Fluid Phase Equilib. 382, 10–20. doi:10.1016/j.fluid.2014.07.035
Jin, Z., and Firoozabadi, A. (2013). Methane and carbon dioxide adsorption in clay-like slit pores by Monte Carlo simulations. Fluid Phase Equilib. 360, 456–465. doi:10.1016/j.fluid.2013.09.047
Kang, S. M., Fathi, E., Ambrose, R. J., Akkutlu, I. Y., and Sigal, R. F. (2011). Carbon dioxide storage capacity of organic-rich shales. Spe J. 16, 842–855. doi:10.2118/134583-pa
Liu, Y., and Hou, J. (2020). Selective adsorption of CO2/CH4 mixture on clay-rich shale using molecular simulations. J. CO2 Util. 39, 101143. doi:10.1016/j.jcou.2020.02.013
Liu, Y., and Wilcox, J. (2012). Molecular simulation of CO2 adsorption in micro- and mesoporous carbons with surface heterogeneity. Int. J. Coal Geol. 104, 83–95. doi:10.1016/j.coal.2012.04.007
Louk, K., Ripepi, N., Luxbacher, K., Gilliland, E., Tang, X., Keles, C., et al. (2017). Monitoring CO2 storage and enhanced gas recovery in unconventional shale reservoirs: results from the morgan county, Tennessee injection test. J. Nat. Gas. Sci. Eng. 45, 11–25. doi:10.1016/j.jngse.2017.03.025
Lu, Y., Han, J., Yang, M., Chen, X., Zhu, H., and Yang, Z. (2023). Molecular simulation of supercritical CO2 extracting organic matter from coal based on the technology of CO2-ECBM. Energy 266, 126393. doi:10.1016/j.energy.2022.126393
Martin, M. G., and Siepmann, J. I. (1998). Transferable potentials for phase equilibria 1. United-atom description of n-alkanes. J. Phys. Chem. B 102, 2569–2577. doi:10.1021/jp972543+
Mei, Y., Liu, W., Wang, J., and Bentley, Y. (2022). Shale gas development and regional economic growth: evidence from fuling, China. Energy 239, 122254. doi:10.1016/j.energy.2021.122254
Merey, S., and Sinayuc, C. (2016). Analysis of carbon dioxide sequestration in shale gas reservoirs by using experimental adsorption data and adsorption models. J. Nat. Gas. Sci. Eng. 36, 1087–1105. doi:10.1016/j.jngse.2016.02.052
Michalec, L., and Lísal, M. (2016). Molecular simulation of shale gas adsorption onto overmature type II model kerogen with control microporosity. Mol. Phys. 115, 1086–1103. doi:10.1080/00268976.2016.1243739
Nie, H., Li, D., Liu, G., Lu, Z., Hu, W., Wang, R., et al. (2020). An overview of the geology and production of the Fuling shale gas field, Sichuan Basin, China. Energy Geosci. 1, 147–164. doi:10.1016/j.engeos.2020.06.005
Ozdemir, E. (2016). Dynamic nature of supercritical CO2 adsorption on coals. Adsorption 23, 25–36. doi:10.1007/s10450-016-9814-9
Pang, W., He, Y., Yan, C., and Jin, Z. (2019). Tackling the challenges in the estimation of methane absolute adsorption in kerogen nanoporous media from molecular and analytical approaches. Fuel 242, 687–698. doi:10.1016/j.fuel.2019.01.059
Peng, D.-Y., and Robinson, D. B. (1976). A new two-constant equation of state. Ind. Eng. Chem. Fundam. 15, 59–64. doi:10.1021/i160057a011
Pini, R., Ottiger, S., Burlini, L., Storti, G., and Mazzotti, M. (2010). Sorption of carbon dioxide, methane and nitrogen in dry coals at high pressure and moderate temperature. Int. J. Greenh. Gas. Control 4, 90–101. doi:10.1016/j.ijggc.2009.10.019
Pruess, K., and Spycher, N. (2007). ECO2N – a fluid property module for the TOUGH2 code for studies of CO2 storage in saline aquifers. Energy Convers. Manage. 48, 1761–1767. doi:10.1016/j.enconman.2007.01.016
Rani, S., Padmanabhan, E., and Prusty, B. K. (2019). Review of gas adsorption in shales for enhanced methane recovery and CO2 storage. J. Pet. Sci. Eng. 175, 634–643. doi:10.1016/j.petrol.2018.12.081
Rouquerol, F., Rouqerol, J., and K, S. (1999). Adsorption by powders and porous solids. London: Academic Press.
Sakurovs, R., Day, S., Weir, S., and Duffy, G. (2007). Application of a modified dubinin-radushkevich equation to adsorption of gases by coals under supercritical conditions. Energy Fuels 21, 992–997. doi:10.1021/ef0600614
Skipper, N. T., Refson, K., and McConnell, J. D. C. (1991). Computer simulation of interlayer water in 2: 1 clays. J. Chem. Phys. 94, 7434–7445. doi:10.1063/1.460175
Song, W., Yao, J., Ma, J., Li, A., Li, Y., Sun, H., et al. (2018). Grand canonical Monte Carlo simulations of pore structure influence on methane adsorption in micro-porous carbons with applications to coal and shale systems. Fuel 215, 196–203. doi:10.1016/j.fuel.2017.11.016
Sun, H., Zhao, H., Qi, N., and Li, Y. (2017). Effects of surface composition on the microbehaviors of CH4 and CO2 in slit-nanopores: A simulation exploration. ACS Omega 2, 7600–7608. doi:10.1021/acsomega.7b01185
Tenney, C. M., and Lastoskie, C. M. (2006). Molecular simulation of carbon dioxide adsorption in chemically and structurally heterogeneous porous carbons. Environ. Prog. 25, 343–354. doi:10.1002/ep.10168
Wang, Q., and Huang, L. (2019). Molecular insight into competitive adsorption of methane and carbon dioxide in montmorillonite: effect of clay structure and water content. Fuel 239, 32–43. doi:10.1016/j.fuel.2018.10.149
Wang, T., Tian, S., Li, G., Sheng, M., Ren, W., Liu, Q., et al. (2018). Molecular simulation of CO2/CH4 competitive adsorption on shale kerogen for CO2 sequestration and enhanced gas recovery. J. Phys. Chem. C 122, 17009–17018. doi:10.1021/acs.jpcc.8b02061
Yang, N., Liu, S., and Yang, X. (2015). Molecular simulation of preferential adsorption of CO2 over CH4 in Na-montmorillonite clay material. Appl. Surf. Sci. 356, 1262–1271. doi:10.1016/j.apsusc.2015.08.101
Zhang, B., Kang, J., and Kang, T. (2018). Effect of water on methane adsorption on the kaolinite (0 0 1) surface based on molecular simulations. Appl. Surf. Sci. 439, 792–800. doi:10.1016/j.apsusc.2017.12.239
Zhang, J., Clennell, M. B., Liu, K., Pervukhina, M., Chen, G., and Dewhurst, D. N. (2016). Methane and carbon dioxide adsorption on illite. Energy Fuels 30, 10643–10652. doi:10.1021/acs.energyfuels.6b01776
Zhang, L., Nowak, W., Oladyshkin, S., Wang, Y., and Cai, J. (2023). Opportunities and challenges in CO2 geologic utilization and storage. Adv. Geo-Energy Res. 8, 141–145. doi:10.46690/ager.2023.06.01
Zhou, S., Xue, H., Ning, Y., Guo, W., and Zhang, Q. (2018). Experimental study of supercritical methane adsorption in longmaxi shale: insights into the density of adsorbed methane. Fuel 211, 140–148. doi:10.1016/j.fuel.2017.09.065
Zhou, W., Wang, H., Yan, Y., and Liu, X. (2019). Adsorption mechanism of CO2/CH4 in kaolinite clay: insight from molecular simulation. Energy Fuels 33, 6542–6551. doi:10.1021/acs.energyfuels.9b00539
Zhu, H., Huang, C., Ju, Y., Bu, H., Li, X., Yang, M., et al. (2021). Multi-scale multi-dimensional characterization of clay-hosted pore networks of shale using FIBSEM, TEM, and X-ray micro-tomography: implications for methane storage and migration. Appl. Clay Sci. 213, 106239. doi:10.1016/j.clay.2021.106239
Keywords: shale, shale gas, clay minerals, CO2 storage, molecular simulation
Citation: Hui D, Li L, Zhang Y, Peng X, Li T, Jia C and Pan Y (2023) Molecular simulation of adsorption behaviors of methane and carbon dioxide on typical clay minerals. Front. Energy Res. 11:1231338. doi: 10.3389/fenrg.2023.1231338
Received: 30 May 2023; Accepted: 05 September 2023;
Published: 20 September 2023.
Edited by:
Yi Zhang, Dalian University of Technology, ChinaReviewed by:
Shansi Tian, Northeast Petroleum University, ChinaHongjian Zhu, Yanshan University, China
Copyright © 2023 Hui, Li, Zhang, Peng, Li, Jia and Pan. This is an open-access article distributed under the terms of the Creative Commons Attribution License (CC BY). The use, distribution or reproduction in other forums is permitted, provided the original author(s) and the copyright owner(s) are credited and that the original publication in this journal is cited, in accordance with accepted academic practice. No use, distribution or reproduction is permitted which does not comply with these terms.
*Correspondence: Dong Hui, eG55cXQwMDFAMTYzLmNvbQ==; Yi Pan, cHlzdzEyM0AxNjMuY29t