 Hongwei Cui
 Jiahua Zhang3
- 1College of Mechanical and Vehicle Engineering, Taiyuan University of Technology, Taiyuan, China
- 2Shanxi Key Laboratory of Fully Mechanized Coal Mining Equipment, Taiyuan University of Technology, Taiyuan, China
- 3School of Mechanical Engineering, Beijing Institute of Technology, Beijing, China
In high-power impeller industries, valve-controlled liquid-filled hydrodynamic couplings are widely used in the soft startup of heavy-duty scraper conveyors for mining. However, the water circulation speed in internal flow fields is higher at lower speed ratios, making the hydrodynamic couplings prone to severe cavitation, which further results in severe performance degradation, noise, vibration, or even erosion failure. Meanwhile, because a hydrodynamic coupling is a piece of closed-loop multicomponent turbomachinery, internal transient cavitation flow behavior cannot be easily controlled. To reasonably predict the characteristics of cavitation and its influence on the working performance of the hydrodynamic coupling, a high-quality structured mesh model of the internal flow field for an impeller was established. Considering the periodic structural characteristics of the impeller, a scale-resolving simulation turbulence model was combined with a Rayleigh–Plesset cavitation model to establish a single-cycle hydrodynamic coupling calculation model. The cavitation distribution characteristics and torque transmission of the flow field under different working conditions were obtained, and the effect of cavitation on the soft startup performance was analyzed. The results demonstrated that cavitation in the hydrodynamic coupling mainly occurred under low speed ratios. The degree of cavitation decreased as speed ratio increased. The worst-case scenario for cavitation occurred when the speed ratio was zero. Most of the cavitation bubbles were generated at the tip of the blades, resulting in unstable variation in torque characteristics and deterioration of the working performance of the hydrodynamic coupling. The analysis reveals that the cavitation process in the impeller is highly unstable and periodic, and the cavitation development near the tip of the blades occurs in four stages: birth, growth, separation, and disintegration. The generated steam accumulates in the inner ring of the impeller. Therefore, a method for accurately predicting the cavitation characteristics of hydrodynamic couplings based on high-precision technology is proposed, and a theoretical basis for coupling design and cavitation suppression technology is provided.
1 Introduction
Efficient and safe mining equipment plays a vital role in coal mining and utilization. Scraper conveyors often encounter harsh working conditions, such as excessively hard coal walls, sudden changes in coal production, stagnation of scraper chains, and unbalanced loads. These conditions can cause unexpected shutdowns, affect production efficiency, and affect the reliability and service life of the motor and scraper conveyor. Commonly used transmission devices in mines include valve-controlled liquid-filled hydrodynamic couplings, controlled start transmission, and frequency conversion drive devices. Compared with other transmission methods, valve-controlled liquid-filled hydrodynamic couplings use water as the working medium. The amount of liquid in the hydrodynamic coupling is varied via a hydraulic valve; speed regulation and soft starting of the load are then realized. As a commonly used soft start device on conveyors, this hydrodynamic coupling exhibits the advantages of a large starting torque coefficient, flexible transmission, simple structure, reliable performance, low equipment investment, and low maintenance cost (Zhang et al., 2020).
With the rapid development of computing power and various commercial finite-element software packages, the application of computational fluid dynamics (CFD) technology has become crucial to solve the problem of fluid calculation. To study hydraulic transmission, several researchers have conducted numerical computations for various hydraulic components based on CFD technology.
At present, most scholars focus on the cavitation characteristics of torque converter flow field in various operating conditions. Liu Cheng et al. revealed the fluid field mechanism of the influence of charging oil conditions on torque converter cavitation behavior, providing practical guidelines for suppressing cavitation in torque converter (Liu et al., 2022). Ran Zilin et al. developed a cavitation suppression technique by slotting one side of the stator suction side, which was proven to be able to significantly shorten the cavitation duration (Ran et al., 2022). Guo Meng et al. developed a full flow passage geometry and a computational fluid dynamics (CFD) model with cavitation to analyze the flow behavior in the torque converter (Guo et al., 2022a). Xiong Pan et al. optimized the Joukowsky airfoil used in the design of stator blades, which greatly reduced the probability of cavitation and improved the performance and service life of the torque converter (Pan et al., 2021).
Cavitation is a transient phase change phenomenon. Vapor bubbles occur, grow, and collapse in liquids with variations in the local pressure. This is a common issue in fluid machinery. To face complex coal conditions underground, mining equipment with high power that can sustain high loads are being developed. This has increased the demand for the soft start and stable transmission capabilities of the hydrodynamic coupling. A higher power density results in a higher circulation velocity and lower local pressure in the internal flow field. Simultaneously, because the working medium of the high-power hydrodynamic coupling for mining is water, a large amount of dissolved gas and undissolved microbubbles are present in the medium. Therefore, cavitation can easily occur, particularly on the blade surface, leading to unstable transmission and reduced power, thus reducing the life of the impeller.
At present, research on the cavitation phenomenon of the hydraulic transmission device primarily entails the torque converter. Anderson et al. (Anderson et al., 2003) investigated cavitation signatures under the stall condition in an automotive torque converter using a microwave telemetry technique. Liu et al. (Liu et al., 2018a; Liu et al., 2019) studied the influence of the stator blade shape on the cavitation process of a hydraulic torque converter and found that cavitation is directly related to the internal mass flow rate. Robinette et al. (Robinette, 2007; Robinette et al., 2008a; Robinette et al., 2008b) investigated the effects of torque converter design and operating conditions on the onset of cavitation during vehicle launch using a nearfield acoustical technique. From their numerical results, Dong et al. (Yu et al., 2002) determined that the cavitation on the stator leading edge grew in size with increasing pump speed, resulting in severe performance degradation in the torque converter. Zhao (Zhao et al., 2016) used the full channel transient CFD calculation model to simulate the mechanism of bubble breakup in a hydraulic torque converter by implanting bubbles in it, and they calculated the high incidence area of bubble breakdown. Watanabe et al. (Watanabe et al., 1996; Watanabe et al., 1997; Watanabe et al., 2007) established a cavitation observation model based on a transparent plastic torque converter. A high-speed camera was used to observe the cavitation in the torque converter, which was combined with dynamic torque testing to confirm that the cavitation process produced high-frequency torsional vibration. Kang (Kang et al., 2017) and Dong (Dong et al., 2017) studied the flow structure and cavitation phenomena in a hydraulic retarder. In addition, several important results have been obtained from research on hydrofoil cavitation (Sun et al., 2019; Bai et al., 2018; Cheng et al., 2020). Chai et al. (Chai et al., 2022) revealed the three-dimensional morphological characteristics of cavitation flow under extreme working conditions through high-precision numerical simulation and analysis of the cavitation flow field of a flat torque converter. Guo et al. (Guo et al., 2021; Guo et al., 2022b) proposed full-flow CFD models with and without cavitation for torque converters, and studied the effects of different pump impeller speeds, pump turbine speed differences and cavitation parameters on the internal flow field of the torque converter. Xiong et al. (Xiong et al., 2021) modified the torque converter stator blades through Joukowsky airfoil transformation, which greatly reduced the probability of cavitation.
Because hydraulic transmission machinery is a closed multi-impeller rotating machine, the internal two-phase flow phenomenon cannot be easily observed (Timoshevski et al., 2016). The current research results are mainly on the torque characteristics and two-phase flow field under part filling conditions (Da Silva et al., 2008; Hur et al., 2016; Hur et al., 2017). However, there is still no reasonable explanation for the formation of two-phase flow in the coupling. Xuesong Li (Li et al., 2020) studied the formation of two-phase flow state and flow mechanism of the flow field in the hydraulic retarder from the point of view of cavitation phenomenon, and the object of the study is highly similar to the structure of the hydrodynamic coupling, so similar theories can be used to analyze the two-phase flow. In addition, theoretical speculations suggest that, owing to the particularity of the working medium and working conditions of the mining high-power valve-controlled liquid-filled hydrodynamic coupling, the cavitation phenomenon has a greater impact on the working characteristics of the coupling under the condition of an impeller high-speed difference. Therefore, this study aims to analyze the occurrence and development of cavitation in the flow field of high-power hydrodynamic couplings as well as to examine their external characteristics. This is of great significance for improving the accuracy of the prediction of hydrodynamic coupling characteristics and for improving performance and durability.
The research object in this study was a high-power mine-adjustable double-chamber hydrodynamic coupling with a circulation circle outer diameter of 575 mm. A single-channel calculation model of the impeller flow field on the output side was established. A SBES(Stress-Blended Eddy Simulation) calculation model was used to study the effect of cavitation on the performance of the fluid coupling. The development of the torque characteristics and cavitation distribution of the fluid coupling under closed working conditions was analyzed. The results provide a high-precision research method for the cavitation characteristics of fluid couplings; they also provide a reliable theoretical basis for the optimization of the structure of fluid couplings.
2 Numerical simulation
2.1 Geometric and mesh model
The structure and working principle of the valve-controlled liquid-filled hydrodynamic coupling are shown in Figure 1.
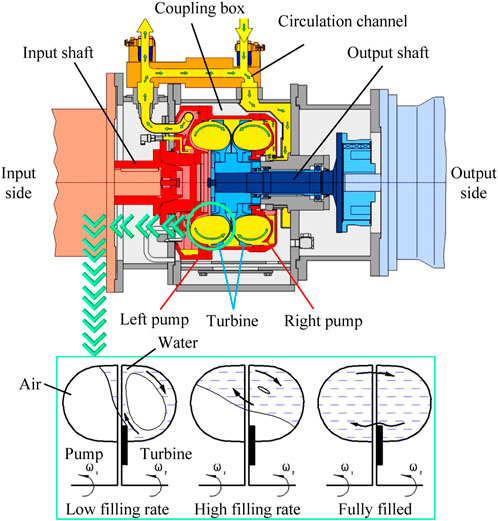
FIGURE 1. Structure and working principle of hydrodynamic coupling.
The speed-adjusting double-chamber hydrodynamic coupling with the outer diameter D = 575 mm was considered as the analysis model. The numbers of pump wheels and turbine blades were 46 and 45, respectively. Because the two pairs of impellers of this coupling had symmetrical structures, the flow field of the output impeller was used as the calculation model. The speed ratio of the hydrodynamic coupling was defined as
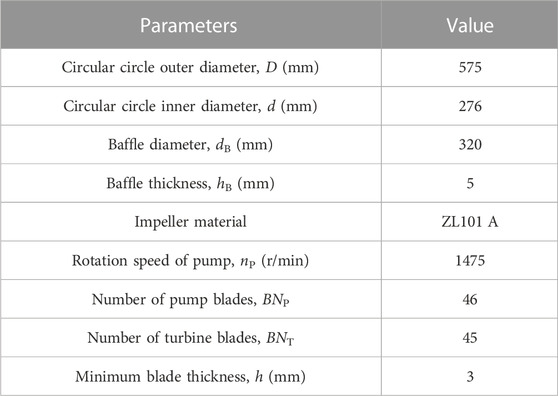
TABLE 1. Structure parameters of the coupling impeller.
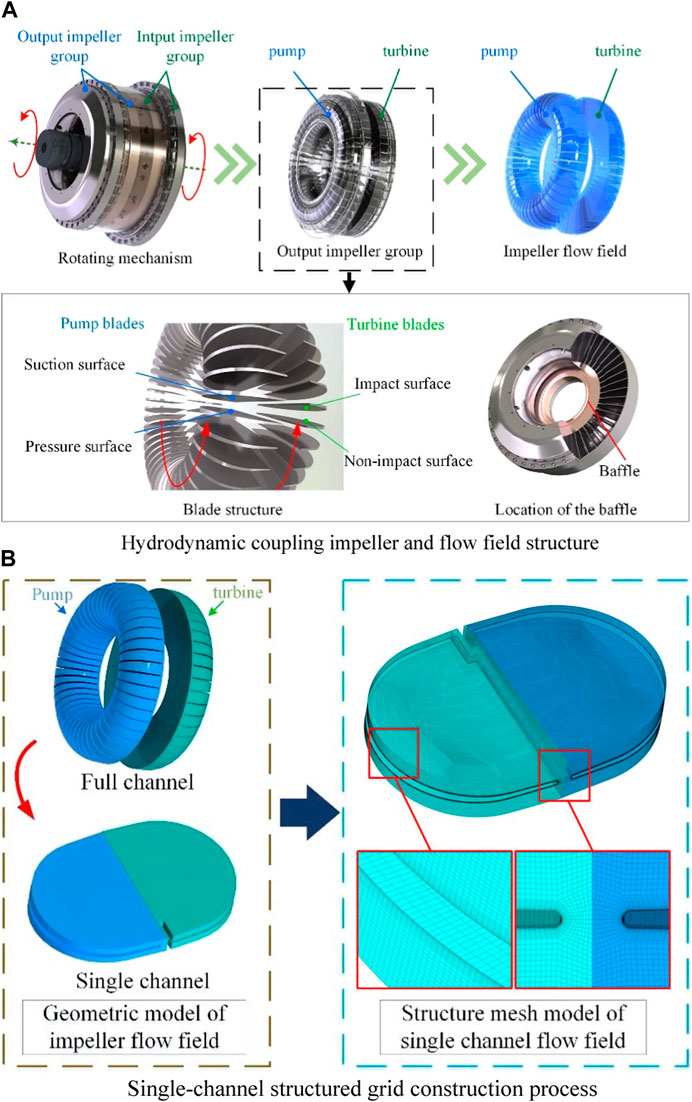
FIGURE 2. Geometric model and mesh model.
To improve the computation efficiency and obtain a high flow field mesh density, a single flow channel calculation model of 1/x (where x is the number of impeller blades) was obtained by utilizing the cyclically symmetric structural characteristics of the inner flow field. The structured hexahedral grid in ICEM CFD was used to discretize the flow field model of a single channel of a fluid coupling. Moreover, o-division and mesh refinement were performed at the circle of curvature and the blade wall surface to improve the computational efficiency and mesh quality. This was because the three-dimensional circulation of the flow field in the coupling was complicated, and the cavitation was distributed under extremely unsteady conditions. Therefore, a high-quality mesh was required to calculate the actual flow state and capture the transient cavitation flow behavior. The process of establishing the single-channel mesh model is shown in Figure 2B.
Taking the internal flow field of the pump wheel as an example, the boundary condition setting method is shown in Figure 3, which mainly includes the no-slip wall at the wall surface of the pump wheel blades and the wall surface of the flow channel, the periodic surface of the pump wheel field according to its own geometric cycle symmetry structure, and the coupling surface of the flow solving area between the pump wheel internal flow field and the turbine internal flow field. Interface). Based on the viscous qualities of the fluid, the flow field near the wall of the existence of a thin layer of flow velocity and the wall of the same speed of the fluid, the thin layer of fluid and the wall of the wall of the relative slip does not exist, so the wall of the wall of the wall of the speed of the fluid unit of the velocity of the surface layer to take the value.
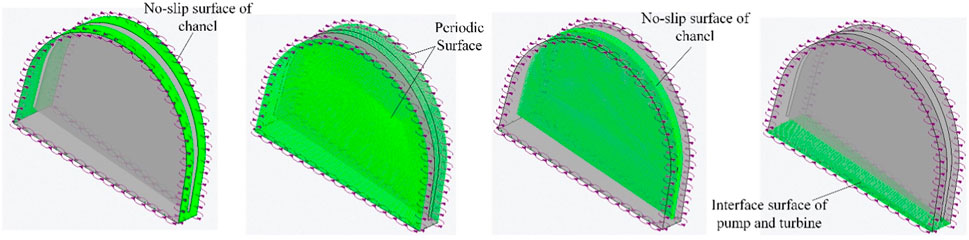
FIGURE 3. Fluid boundary.
The accuracy and efficiency of the solution are directly affected by the quality and quantity of the mesh. In theory, a higher number of grids produce better calculation accuracy, but more grids require greater computing resources. Therefore, an appropriate mesh density should be determined to achieve an appropriate balance between accuracy and computational cost. The calculated torque change rate
where
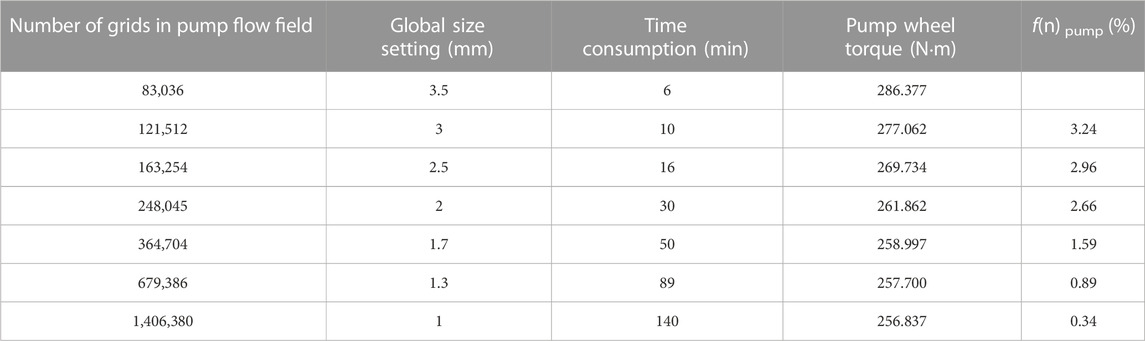
TABLE 2. Structural mesh independence analysis results.
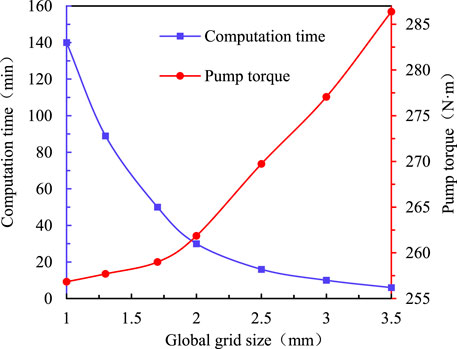
FIGURE 4. Analysis results of grid independence test.
When the global size of the mesh is less than 1.7 mm, the torque change generated by further increasing the number of grids is less than 2% and the model is considered to be mesh-independent. Considering the calculation efficiency and precision comprehensively, the global grid size is selected to be 1.7 mm. The grids number of the turbine flow field is 948,230, and the grids number of the turbine flow field is 1,157,138.
To ensure the accuracy of the boundary layer flow field computation, the minimum boundary layer size was set to 0.01 mm, which ensured that the minimum y + value around the blade was less than 10. The grid thickness growth rate was set to 1.15.
2.2 Multiphase model
In this study, the multiphase flow field caused by cavitation in the completely filled liquid flow field was obtained. In addition to the general set of mass conservation equations, the mass exchange between liquid and non-condensable vapor is governed by the following transport equation (Zhou et al., 2017):
The key to solving the cavitation problem is the determination of the interphase mass transfer rate, i.e., cavitation rate, which is driven by the difference between local pressure and vapor pressure (Wang et al., 2013). Assuming that no interphase slip or heat transfer exists between the liquid and vapor, the radius of a spherical vapor bubble can be described by the Rayleigh–Plesset equation in its first-order approximation form as follows:
Then, the cavitation rate during vaporization can be given as
Because the nucleation site density decreases when the vapor volume fraction increases, the vapor volume fraction
When the partial pressure exceeds the vapor condensation pressure, the mass transfer rate becomes
Because the condensation process is generally much slower than vaporization, different empirical factors are assumed as follows:
A homogeneous multiphase condition is also assumed to simplify the model; thus, the liquid and vapor share the same velocity and turbulence profiles. The mixture of fluid and vapor is treated as a pseudofluid whose density
2.3 Simulation settings
First, the upwind steady-state model was used to determine the flow field characteristics of the fluid coupling without cavitation. The high-resolution convection scheme was then used to perform steady-state computations to provide accurate flow field conditions. Based on the results of the noncavitation model, a high-resolution scheme was used to simulate the steady-state cavitation behavior. Finally, with the steady-state cavitation output as the initial condition, a transient CFD cavitation model was established to simulate the dynamic cavitation process in the internal flow field.
For the interface between the flow field and impeller wall surface and blade wall surface, the nonslip wall surface treatment was adopted, while the wall surface roughness was neglected. In the steady-state computation stage, the stage interface model was used to exchange data between the pump–turbine flow field interface. In the transient computation stage, the transient rotor–stator interface model was used to capture more transient flow characteristics. The corresponding CFD multistep solution model settings are listed in Table 3.
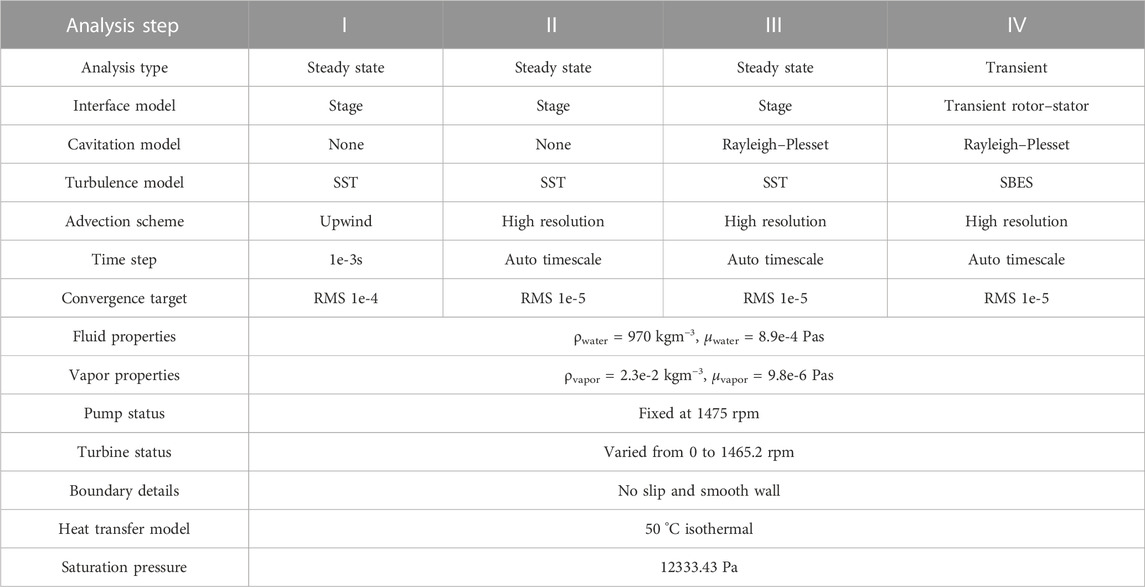
TABLE 3. CFD model settings.
To obtain accurate cavitation characteristics and corresponding flow field characteristics, the SST SBES DSL model in the scale-resolving simulation is used in transient computations. Compared with the DES, this model features a considerably improved shielding function to protect RANS boundary layers from the impact of the grid-dependent term; further, this model can automatically switch between existing RANS and LES models (Liu et al., 2018b).
The shielding function developed can be used in the following manner for achieving a blending on the stress level between RANS and LES formulations (Li, 2018):
where
3 Experimental research
A macro characteristic test was conducted, wherein a motor was used to provide power at the input end and load at the output end, to simulate the working conditions of the downhole fluid coupling. A pump station was used to control the inlet and outlet pressures of the valve control oil and working water, complete the startup of the coupling, and test the macroscopic characteristics of the hydrodynamic coupling at different speed ratios. The rotation speed and torque sensors were used to obtain the dynamic hydraulic performance of the coupling. According to the comprehensive analysis results of the torque transmission characteristic computation data and test data, the prediction accuracy of the torque characteristic was verified. The macro characteristic test plan and parameter settings of the hydrodynamic coupling are shown in Figure 5. Test device parameters mainly include that the power of power motor was set to 2500kW, rated input rotation speed of test bench and hydrodynamic coupling was set to 1475rpm, the water supply flow was greater than 240L/min, and rated power of hydrodynamic coupling was 1200 kW.
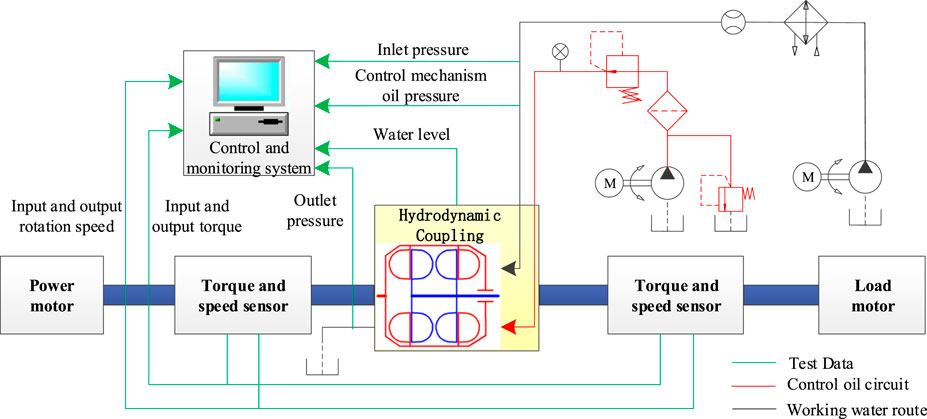
FIGURE 5. Macro characteristics test plan.
Data collection system: The test system data were collected by an efficiency meter industrial control computer. The main collection parameters were as follows: input torque, input speed, output torque, output speed, coupling liquid level pressure, coupling working chamber temperature, filling and discharging liquid valve action signal, and other data.
According to the test plan, a macro characteristic testbed was built. Carry out several repeated tests from starting and running to complete filling, draining, circulating and changing fluids. The working performance and reliability of the equipment were examined.
Test procedure: The drag motor was started at no load, drag motor was maintained at 1475 rpm, and coupling was filled with liquid. The coupling was then loaded until it reached the rated power and remained at the rated working conditions. After 8 h of operation, the coupling ran smoothly without abnormal noise. The input and output speed and torque data were collected and analyzed during the loading process.
4 Results and discussion
4.1 Cavitation distribution characteristics of steady flow field
According to the numerical analysis results of steady-state cavitation two-phase flow under fully filled working conditions, following the multicycle cavitation and steam accumulation processes in the flow field of the hydrodynamic coupling, a stable inner ring steam accumulation area was formed. The field resulted in a more stable circulation characteristic. The distribution characteristics of cavitation were analyzed at different speed ratios, combined with the liquid velocity and blade pressure distribution trends obtained before and after the cavitation computation model was opened at different speed ratios, which was required to realize complete filling. This analysis was then used to analyze the influence of cavitation on the flow field distribution characteristics.
Figure 6 and Figure 7 show the distribution characteristics of the flow field velocity streamlines when the cavitation computation model is turned off (Figure 6A) and turned on (Figure 6B), respectively. Comparative analysis shows that the water–liquid circulationSR velocity gradually decreased as the speed ratio increased. Because the steam generated in the cavitation process accumulated in the inner ring of the impeller, the water–liquid circulation state changed, and the circulation velocity was lower than that without the cavitation model. With an increase in the speed ratio, the volume of the vapor accumulation zone decreased because of the decrease in the degree of water cavitation, and its influence on the state of water circulation and flow velocity also decreased.

FIGURE 6. Velocity streamline distribution.A,B
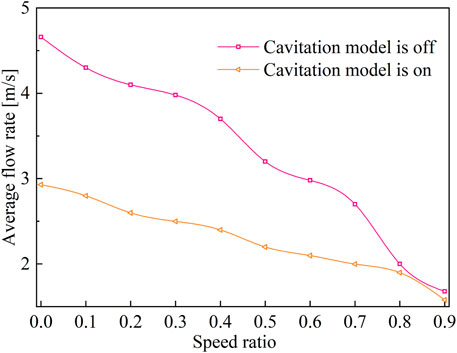
FIGURE 7. Change in mean flow velocity in the flow field.
A comparative analysis of the effects of steam accumulation on the blade pressure field distribution under different steady-state cavitation simulation conditions is shown in Figure 8. The overall pressure distribution trends at the blade wall before and after opening the cavitation computation model were the same. Owing to the change in the circulation characteristics, the overall pressure distribution of the blade after cavitation was reduced. Simultaneously, because of the existence of the vapor accumulation area, the corresponding area generates low-pressure areas A and B, and the pressure gradient of the blade was evident.
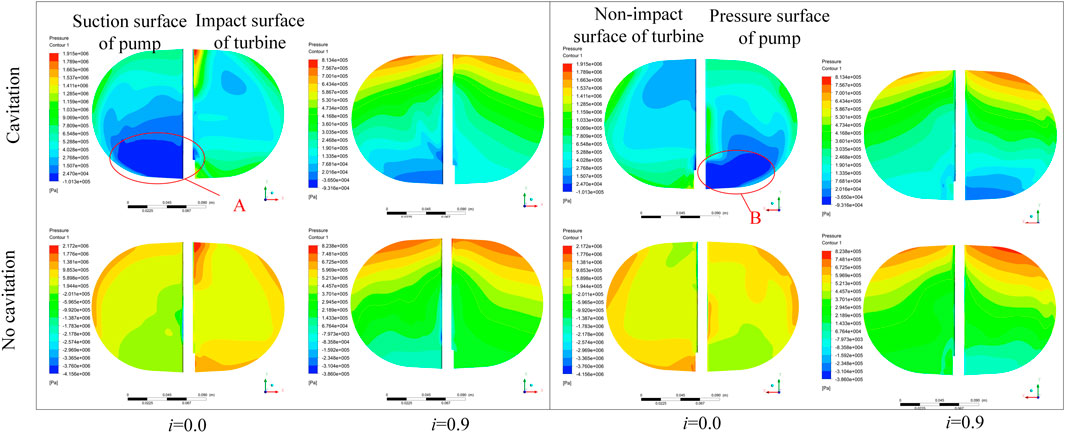
FIGURE 8. Comparison of blade pressure distribution.
4.2 Characteristics of transient cavitation
According to the distribution law of cavitation bubbles, the bubbles are mainly generated in the pump flow field. To analyze the distribution pattern and evolution law of the cavitation field in the pump flow field, a speed ratio of 0.6 was considered as an example to analyze the volume rate distribution of cavitation in different development stages.
Because the flow field in the fluid coupling is complex and three-dimensional, the cavitation bubble movement in the flow field is also complex and three-dimensional. Figure 9 shows the development of the cavitation bubble characterized by the 90% steam volume rate isosurface. The figure shows that the evolution of cavitation bubbles can be divided into four stages. In Stage 1, the banded bubble is born around the tip on the suction surface side of the pump blade; this bubble follows the steam in the cavitation bubble. Cloudy bubbles form in the accumulation of phases. In Stage 2, cavitation bubbles always adhere to the surface of the blades. As the bubbles leave the blades, some bubbles enter the flow channel and gradually form ellipsoidal bubbles. In Stage 4, when the volume of ellipsoidal bubbles increases and reaches a certain level, they break away from the surface of the blade. They then enter the flow channel and burst after covering a certain distance. Some steam condenses, and the remaining gas continues to move in the flow field, forming broken bubbles with irregular shapes and sizes and moving toward the inner ring of the pump wheel. Eventually, as cavitation continues to accumulate, a vapor concentration area is formed.
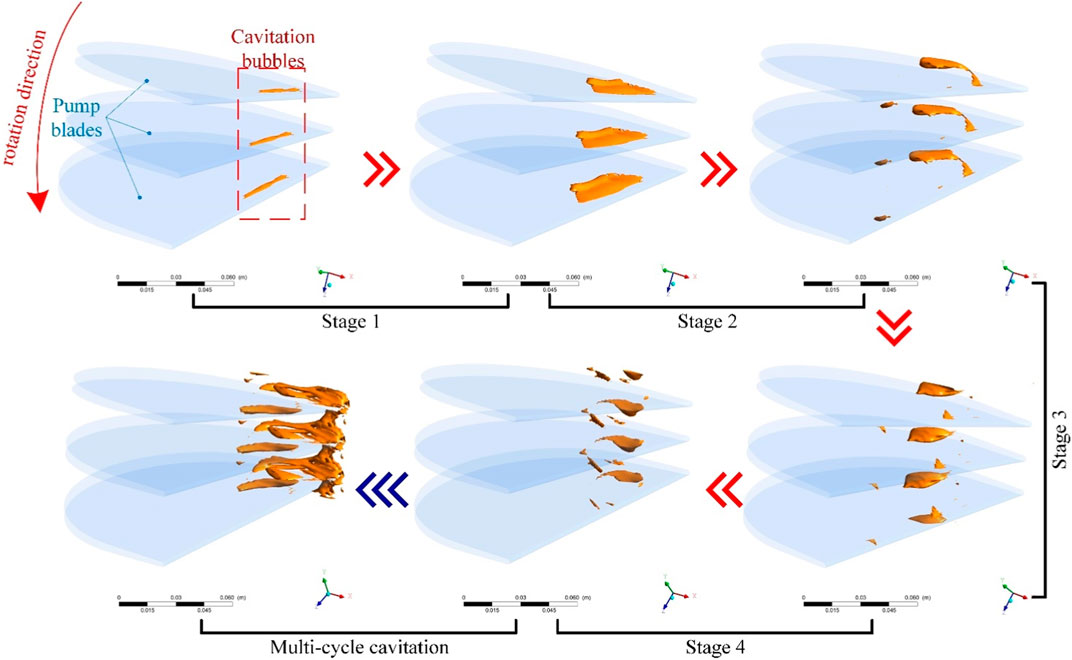
FIGURE 9. Evolution of cavitation bubbles.
To obtain the volume rate, pressure, and speed distribution data of the cavitation observed near the blade tip of the pump wheel, located near the inner ring, at a speed ratio of 0.6, a circular data analysis cross section with a diameter of da = 180 mm was established, as shown in Figure 10.
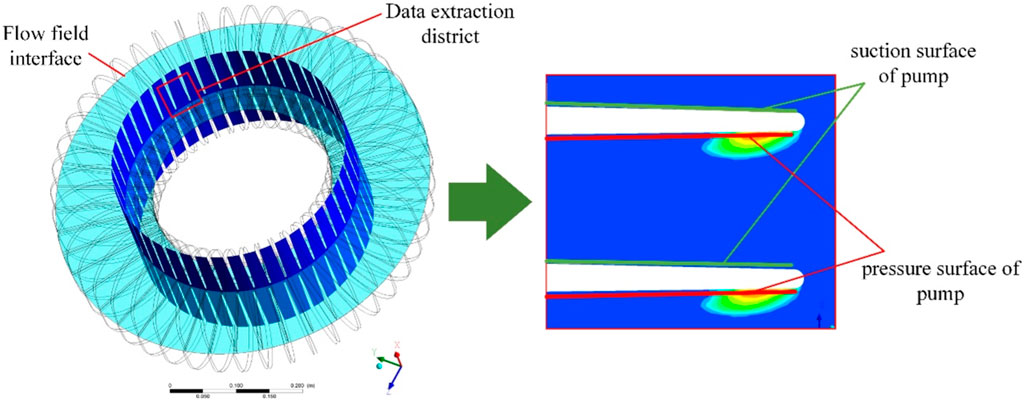
FIGURE 10. Schematic of cross-sectional position.
Figure 11A shows the distribution of the steam volume fraction at the cross section. Figure 11B shows the distribution of water speed streamline. The evolution of cavitation from birth, growth, separation, and disintegration is evident. According to the transient changes in cross-sectional pressure and velocity, combined with the volume fraction distribution characteristics, part of the high-speed water from the turbine inner ring outlet enters the pump wheel and hits the blade tip; the flow rate then decreases rapidly and a local high pressure forms at the blade tip area. After passing through the tip area, the flow is affected by the local high pressure. Simultaneously, this flow is driven by other incoming flows to form a high-speed jet close to the blade surface as well as an angle with the surface. Therefore, on the pressure surface side of the impeller blades, a low-pressure region, wherein the pressure is below the vapor pressure, is formed near the tip of the blade; a severe cavitation phenomenon occurs in this region. As the cavitation bubble grows, the flow into the pump wheel is hindered by the bubble, and the jet angle increases. When the growth of cavitation is large, reverse flow can be found near the blade wall, and strong vortices are observed in the corresponding areas. This causes the internal pressure to decrease and promotes the formation of bubbles. As the cavitation bubble moves toward the inner circle of the circulation circle and breaks up, the jet angle decreases and promotes the birth of new cavitation bubbles.
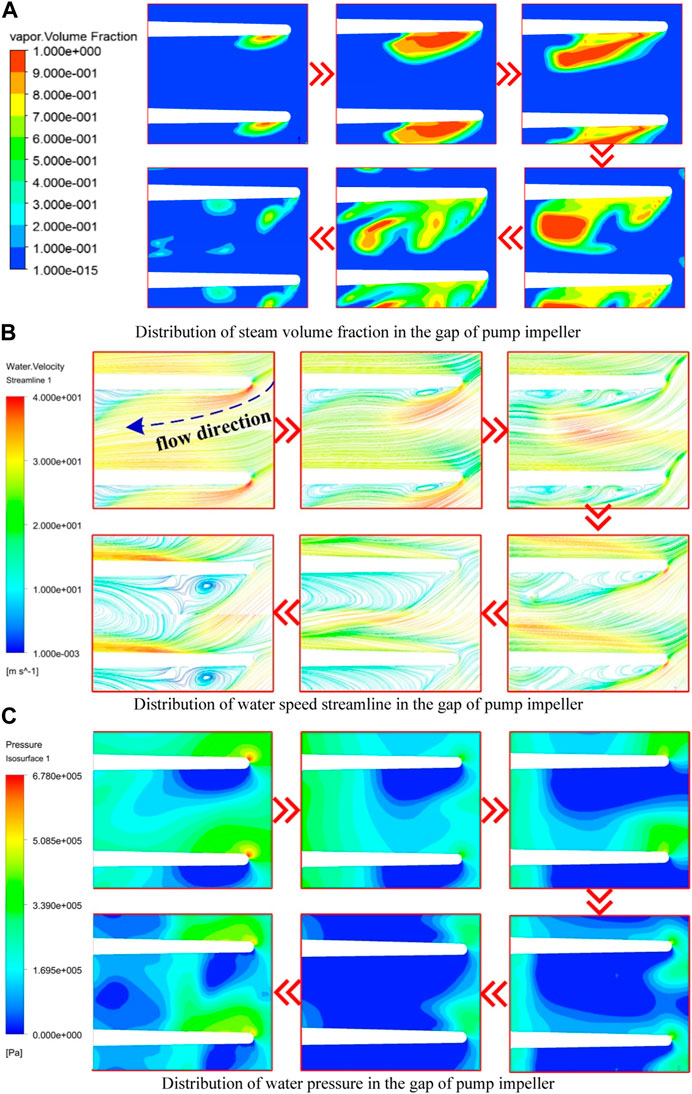
FIGURE 11. Simulated cloud image.
The pressure distribution in Figure 11C shows that, owing to the increase in the jet angle and the appearance of strong vortices near the blade, the range of the low-pressure area near the tip area of the blade pressure surface becomes large, which promotes the growth of cavitation.
As the cavitation bubble grows further, under the influence of the bubble surface tension and the surrounding high-pressure water flow, the shape of the cavitation bubble gradually becomes irregular. As the bubble volume increases, the surface tension is insufficient to maintain the growth of the bubble, the bubble ruptures under the surrounding high pressure, and a small range of low-pressure fragmented bubble areas and new cavitation bubble birth areas form in the flow channel.
4.3 Torque characteristics
Figure 12 shows a characteristic diagram of torque transmission in a fluid coupling considering cavitation and noncavitation. Without cavitation computation, the overall output torque tends to decrease. As the speed ratio increases, the rate of decline continues to increase. The overall trend remains unchanged when the cavitation model is considered. Further, the transmission torque under cavitation is lower than that under noncavitation.
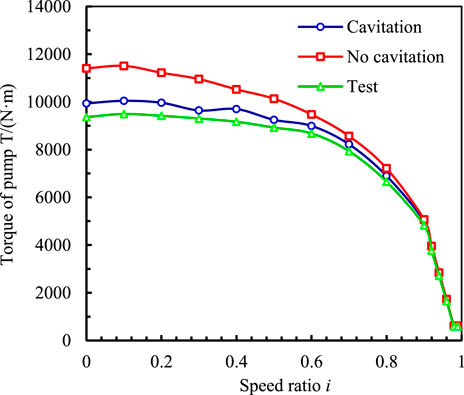
FIGURE 12. Transmission torque of flow field in impeller.
At low speed ratios, owing to the large rotational speed difference between the pump and turbine, the water–liquid circulation speed was rapid, and the cavitation phenomenon was severe. At this time, the torque transmission characteristic also severely deteriorated, and the output torque dropped significantly. As the speed ratio increased, the degree of cavitation in the flow field continued to decrease. At a speed ratio of approximately 0.9, cavitation had little effect on the flow state. Therefore, the occurrence of the cavitation phenomenon considerably affected the overload starting and working ability of the coupling. This phenomenon had relatively little influence on the torque transmission ability under rated working conditions.
To analyze the degree of influence of cavitation on the torque transmission characteristics accurately,
The characteristic difference is
The torque characteristic prediction correction is
A comparative analysis of the correction of the torque transfer value of the flow field at different speed ratios is shown in Figure 13. The
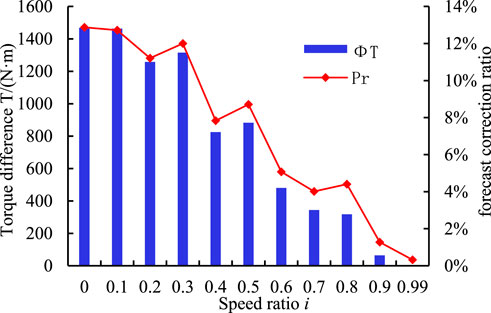
FIGURE 13. Torque correction distribution of cavitation model.
5 Conclusion
In this study, CFD technology and experiments were used to investigate the unsteady flow field affected by the cavitation characteristics of fluid coupling. Based on the numerical simulation data, the cavitation distribution, evolution characteristics, and their effects on the torque transmission characteristics were analyzed. The study clarified the following:
1) The flow field results demonstrate that the severity of cavitation in the internal flow field of the coupling decreases with increasing SR, and the generated steam mainly accumulates at the inner ring of the pump wheel. The formation of a stable steam accumulation area reduces the circulation velocity and flow state of the flow field. Compared with the pressure distribution gradient obtained in the region not affected by cavitation, that on the blade surface affected by cavitation is larger, forming a low-pressure region near the inner ring.
2) Transient cavitation simulation demonstrates that cavitation bubbles are generated near the tip of the blade pressure surface of the internal flow field. Affected by the flow characteristics of water, the evolution process has four stages: birth, growth, separation, and disintegration. This is a periodic cyclic process. The generated steam is finally concentrated inside the circulation circle of the pump wheel. The flow velocity and pressure at the blade surface are both reduced.
3) An analysis of the torque transmission characteristics revealed that the torque drop is considerably affected by severe cavitation at a low speed ratio. The computation results demonstrate that the introduction of the cavitation calculation model can improve the accuracy of torque prediction by approximately 13% under a low speed ratio. The effect of cavitation is smaller at high speeds.
Data availability statement
The raw data supporting the conclusion of this article will be made available by the authors, without undue reservation.
Author contributions
The author contributions are as follows: HC was in charge of the whole trial; JZ wrote the manuscript; LL and GW assisted with sampling and laboratory analyses. All authors contributed to the article and approved the submitted version.
Funding
Supported by the Fund for Shanxi “1331 Project”. Supported by Key Project of Key Research Programs of Shanxi Province (Grant No. 03012015002).
Acknowledgments
The authors would like to acknowledge their appreciation for the continuous assistance with the experiment from Prof. Teng Wang at China Coal Science and Technology Group.
Conflict of interest
The authors declare that the research was conducted in the absence of any commercial or financial relationships that could be construed as a potential conflict of interest.
Publisher’s note
All claims expressed in this article are solely those of the authors and do not necessarily represent those of their affiliated organizations, or those of the publisher, the editors and the reviewers. Any product that may be evaluated in this article, or claim that may be made by its manufacturer, is not guaranteed or endorsed by the publisher.
References
Anderson, C. L., Zeng, L., Sweger, P. O., Narain, A., and Blough, J. R. (2003). Experimental investigation of cavitation signatures in an automotive torque converter using a microwave telemetry technique. Int. J. Rotating Mach. 9, 403–410. doi:10.1155/s1023621x03000381
Bai, X. R., Cheng, H. Y., Ji, B., and Long, X. p. (2018). Large eddy simulation of tip leakage cavitating flow focusing on cavitation-vortex interaction with Cartesian cut-cell mesh method. J. Hydrodynamics 30 (4), 750–753. doi:10.1007/s42241-018-0068-8
Chai, B. S., Wang, G. Y., and Yan, D., (2022). Numerical simulation of cavitation in torque converter and analysis of its influence on performance. J. Jilin Univ. Eng. Technol. Ed., 1–9.
Cheng, H. Y., Bai, X. R., Long, X. P., Ji, B., Peng, X., and Farhat, M. (2020). Large Eddy Simulation of the Tip-leakage Cavitating flow with an insight on how cavitation influences vorticity and turbulence. Appl. Math. Model. 77, 788–809. doi:10.1016/j.apm.2019.08.005
Da Silva, M. J., Lu, Y., Sühnel, T., Schleicher, E., Thiele, S., Kernchen, R., et al. (2008). Autonomous planar conductivity array sensor for fast liquid distribution imaging in a fluid coupling. Sensors Actuators A Phys. 147 (2), 508–515. doi:10.1016/j.sna.2008.06.019
Dong, L., Xiao, J. W., and Ming, J. Y., (2017). Numerical simulation and experimental study on cavitation behavior of hydraulic retarder model. J. Drainage Irrigation Mach. Eng. 35 (1), 1–5. doi:10.3969/j.issn.1674-8530.15.0287
Guo, M., Liu, C., Yan, Q. D., Ke, Z., Wei, W., and Li, J. (2021). Evaluation and validation of viscous oil cavitation model used in torque converter. Appl. Sci. 11 (8), 3643. doi:10.3390/app11083643
Guo, M., Liu, C., Yan, Q. D., Wei, W., and Khoo, B. C. (2022b). The effect of rotating speeds on the cavitation characteristics in hydraulic torque converter. Machines 10 (2), 80. doi:10.3390/machines10020080
Guo, M., Liu, C., Yan, Q., Wei, W., and Khoo, B. C. (2022a). The effect of rotating speeds on the cavitation characteristics in hydraulic torque converter. Machines 10 (2), 80. doi:10.3390/machines10020080
Hur, N., Kwak, M., Moshfeghi, M., Chang, C. S., and Kang, N. W. (2017). Numerical flow analyses of a two-phase hydraulic coupling. J. Mech. Sci. Technol. 31 (5), 2307–2317. doi:10.1007/s12206-017-0427-3
Hur, N., Moshfeghi, M., and Lee, W. (2016). Flow and performance analyses of a partially-charged water retarder. Comput. Fluids 164, 18–26. doi:10.1016/j.compfluid.2016.10.033
Jin, W., Xu, X., Tang, Y., Zhou, H., Zhou, H., and Ren, X. (2018). Coefficient adaptation method for the Zwart model. J. Appl. Fluid Mech.(JAFM) 11, 1665–1678. doi:10.29252/jafm.11.06.28784
Kang, C., Mao, N., and Zhang, G. F. (2017). Highly confined floes and cavitation phenomenon in a hydraulic retarder. J. Eng. Thermophys. 38 (10), 2151–2158.
Li, X., Wu, Q., Miao, L., Yak, Y., and Liu, C. (2020). Scale-resolving simulations and investigations of the flow in a hydraulic retarder considering cavitation. J. Zhejiang University-Science A 21 (10), 817–833. doi:10.1631/jzus.a1900466
Li, Y. (2018). Scale-resolving simulation and experimental verification of different working media flow based on stator/rotor. Changchun, China: Jilin University.
Liu, C. B., Li, J., Bu, W. Y., Xu, Z. x., Xu, D., and Ma, W. x. (2018b). Application of scale-resolving simulation to a hydraulic coupling, a hydraulic retarder, and a hydraulic torque converter. J. Zhejiang Univ. Sci. 19 (12), 904–925. doi:10.1631/jzus.a1700508
Liu, C., Guo, M., and Yan, Q. D., “Numerical investigation on the transient cavitating flow inside a torque converter,” in Proceedings of the 2019 IEEE 8th International Conference on Fluid Power and Mechatronics (FPM), Wuhan, China, April 2019, 208–216. doi:10.1109/FPM45753.2019.9035838
Liu, C., Guo, M., Yan, Q., and Wei, W. (2022). Influence of charging oil condition on torque converter cavitation characteristics. Chin. J. Mech. Eng. 35 (1), 49. doi:10.1186/s10033-022-00727-y
Liu, C., Wei, W., Yan, Q. D., Weaver, B. K., and Wood, H. G. (2018a). Influence of stator blade geometry on torque converter cavitation. ASME J. Fluids Eng. 4 (4), 0411021–04110210. doi:10.1115/1.4038115
Pan, X., Xinyuan, C., Hongjun, S., Jiping, Z., Lin, W., and Huichao, G. (2021). Effect of the blade shaped by Joukowsky airfoil transformation on the characteristics of the torque converter. Proc. Institution Mech. Eng. Part D J. Automob. Eng. 235 (14), 3314–3321. doi:10.1177/09544070211014291
Ran, Z., Ma, W., and Liu, C. (2022). Design approach and mechanism analysis for cavitation-tolerant torque converter blades. Appl. Sci. 12 (7), 3405. doi:10.3390/app12073405
Robinette, D. L. (2007). Detecting and predicting the onset of cavitation in automotive torque converters. Michigan, United States: Michigan Technological University.
Robinette, D. L., Schweitzer, J. M., Maddock, D. G., Anderson, C. L., Blough, J. R., and Johnson, M. A. (2008a). Predicting the onset of cavitation in automotive torque converters—Part I: Designs with geometric similitude. Int. J. Rotating Mach. 2008, 1–8. doi:10.1155/2008/803940
Robinette, D. L., Schweitzer, J. M., Maddock, D. G., Anderson, C. L., Blough, J. R., and Johnson, M. A. (2008b). Predicting the onset of cavitation in automotive torque converters—Part II: A generalized model. Int. J. Rotating Mach. 2008, 1–8. doi:10.1155/2008/312753
Sun, T. Z., Wei, Y. J., Zou, L., Jiang, Y., Xu, C., and Zong, Z. (2019). Numerical investigation on the unsteady cavitation shedding dynamics over a hydrofoil in thermo-sensitive fluid. Int. J. Multiph. Flow 111, 82–100. doi:10.1016/j.ijmultiphaseflow.2018.11.014
Timoshevski, M. V., Zapryagaev, L. L., and Peryunin, K. S., (2016). Cavitation control on a 2D hydrofoil through a continuous tangential injection of liquid: Experimental study. AIP Conf. Proc. 1770 (1), 030026. doi:10.1063/1.4963968
Wang, C., Guo, H. P., and Zhang, L. X., (2013). Influence of leading-edge suction on hydrodynamic and cavitation performance of hydrofoil. J. Ship Mech. 17 (12), 1361–1370. doi:10.3969/j.issn.1007-7294.2013.12.001
Watanabe, H., Yoshida, K., and Yamada, M., (1996). Flow visualization and measurement in the stator of a torque converter. JSAE Rev. 17 (1), 25–30. doi:10.1016/0389-4304(95)00058-5
Watanabe, H., Yoshida, K., and Yamada, M., (1997).Flow visualization and measurement of torque converter stator blades using a laser sheet lighting method and a laser Doppler velocimeter Warrendale, Pennsylvania, United States: SAE Transaction, 1196–1206.
Watanabe, M., Sasaki, K., and Miyamoto, K., (2007). Toyota's new six-speed automatic transmission AB60E for RWD vehicles. Warrendale, Pennsylvania, United States: SAE Technical Paper.
Xiong, P., Chen, X. Y., Sun, H. J., Jiping, Z., Lin, W., and Huichao, G. (2021). Effect of the blade shaped by Joukowsky airfoil transformation on the characteristics of the torque converter. Proc. Institution Mech. Eng. Part D J. Automob. Eng. 235 (14), 3314–3321. doi:10.1177/09544070211014291
Yu, D., Vamshi, K., and Pradeep, A., (2002). Torque converter CFD engineering part 2: Performance improvement through core leakage flow and cavitation control. Warrendale, Pennsylvania, United States: SAE Transaction, 1272–1285.
Zhang, J. H., Cui, H. W., and Wang, T.,(2020). Two-phase circulation characteristics prediction of variable speed hydrodynamic coupling. Chin. Hydraulics Pneumatics (4), 73–81.
Zhao, L. L., Dong, Z. Q., and Lian, J. Y.,(2016). Fast steerable principal component analysis. Hydraulics Pneumatics Seals 9, 1–12. doi:10.1109/TCI.2016.2514700
Zhou, H. C., Xiang, M., and Wu, Z. P., “Analysis and optimization of the effect of cavitation model parameters on calculation of cavitation flow field,” in Proceedings of the 14th National Congress on Hydrodynamics and the 28th National Hydrodynamics Symposium, Pasadena, California, USA, September, 2017, 337–335.
Nomenclature

Keywords: valve-controlled liquid-filled hydrodynamic coupling, cavitation, scale-resolving simulation, CFX, torque characteristic
Citation: Cui H, Zhang J, Li L and Wang G (2023) Numerical simulation of transient cavitation characteristics of valve-controlled liquid-filled hydrodynamic coupling. Front. Energy Res. 11:1235277. doi: 10.3389/fenrg.2023.1235277
Received: 06 June 2023; Accepted: 31 July 2023;
Published: 29 August 2023.
Edited by:
Kan Kan, College of Energy and Electrical Engineering, ChinaReviewed by:
Boshen Liu, University of Science and Technology Beijing, ChinaGangfeng Tan, Wuhan University of Technology, China
Copyright © 2023 Cui, Zhang, Li and Wang. This is an open-access article distributed under the terms of the Creative Commons Attribution License (CC BY). The use, distribution or reproduction in other forums is permitted, provided the original author(s) and the copyright owner(s) are credited and that the original publication in this journal is cited, in accordance with accepted academic practice. No use, distribution or reproduction is permitted which does not comply with these terms.
*Correspondence: Hongwei Cui, Y3VpaG9uZ3dlaUB0eXV0LmVkdS5jbg==