 Rong Li1
 Pingfeng Ye
 Chenhao Sun
- 1Lu’an Vocational and Technical College, Changzhi, China
- 2College of Electrical Engineering and Automation, Shandong University of Science and Technology, Qingdao, China
The penetration rate of intermittent renewable energy in power system is gradually increasing, which brings challenges to the optimal dispatch of power system. To solve these problems, a multi-regional interconnected transmission network optimization method based on analytical target cascading is proposed. Firstly, the reactive power regulation characteristics of renewable energy is investigated, and the models of wind turbine and photovoltaic generation are established. Secondly, the power system is decomposed into multiple sub-systems using bus tearing method, and an optimal transmission switching (OTS) model with renewable energies is established. Then, the analytical target cascading (ATC) approach is employed to decompose the model into the main problem and several sub-problems for parallel computation to achieve coordinated optimization of the complex transmission network. Finally, the IEEE 14-bus system and the IEEE 118-bus system are used to verify the proposed model. The results show that the proposed method can deal with the coupling nonlinear problem well and promote the consumption of renewable energy.
1 Introduction
In the context of the Energy Internet, the interconnections of the power grid facilitate the long-distance transmission of electrical energy and the improvement of energy utilization efficiency, which in turn supports the optimal management of high-capacity and high-efficiency units. However, the increasing contradiction of source–load imbalance and various intermittent renewable energy sources account for an increasing proportion of power generation, which makes it difficult to predict the uncertainties at the grid side and the contradictions of the source network become prominent (Gao et al., 2023). In addition, information transmission between dispatching centers of different transmission networks is often inaccurate and untimely, which brings some difficulties to the development of the power transmission plan of boundary nodes, network blockage, and other problems that often occur during transmission grid operation (Ostrowski et al., 2014). Therefore, it is of great significance to enhance interconnection and non-homology effects between regions of the power system.
The non-synchronous phenomenon in the power transmission network can be alleviated to a certain extent by optimal transmission switching (OTS) through line cut-off and open-loop operation of the electromagnetic loop network on the strength of the practical working conditions of the power network, without additional investment in power transmission network construction. This can eliminate network congestion, alleviate conflicts between sources, networks, and loads, and improve the flexibility and economy of the system. Based on this, OTS has become an effective method to change the tide distribution by changing the opening and closing states of some lines in the power system (Khanabadi et al., 2013). Some scholars have studied the OTS, and in Huang et al. (2020), the OTS based on the generalized short-circuit ratio sensitivity analysis was proposed, which helps reconcile the conflict between system strength and short-circuit current levels. In Li et al. (2021), an SSDS system framework of the UHV power grid considering the risk of the communication system was proposed, which is profitable in improving the stability of the UHV system. The economic scheduling model considering OTS involves mixed-integer programing, which introduces a significant number of discrete variables into the model, resulting in increased complexity when solving the model. While previous studies have demonstrated the effectiveness of OTS in improving system economy, there is a lack of research on optimizing the solving speed of the model.
In order to improve the efficiency of solving, many scholars have carried out thorough research around the solving algorithm. In Eresghs et al. (2014), the distributed optimal power flow (OPF) calculation for alternating current systems was achieved by using the alternating direction method of multipliers (ADMM). The ADMM is cannot eliminate the drawbacks of the first-order algorithm because it is based on the augmented Lagrange multiplier and the proximal point algorithm (Bai et al., 2015). The distributed interior point algorithm was applied in Wei et al. (2011) to decentralize the solution of the OPF of the grid and to achieve simultaneous iterations in each region. In Wang et al. (2022), the synchronous ADMM was used to solve the coordinated optimization of numerous sub-systems, and then the overall optimization was determined. In Liu et al. (2017), based on the research of vulnerability analysis of critical nodes in the complex network, a cascading fault model was established. In Li et al. (2023), an energy trading model based on stochastic programing (SP) was established, and it used distributed alternating search procedures to accelerate the calculation process of the Nash equilibrium. The aforementioned research optimization algorithms can effectively improve the speed of the model solution but do not consider the complexity of the power system network, which is affected by zonal management and non-sharing of information, thus making it hard to set up a general solution of multi-regional interconnected transmission.
Analytical target cascading (ATC) is a distributed algorithm suitable for solving interconnection and coupling problems. It does not depend on additional information input, can be solved efficiently and accurately only by decoupling variables of the initial problem, and can be used to handle the large-scale renewable energy grid of entropy increase, accelerating the use of centralized ways to work out the majorization of the large-scale optimization process. In Zhai et al. (2021), ATC is applied to seek the optimal plan for day-ahead scheduling. During iteration, only the voltage and phase angle of the boundary are shared between the main problem and sub-problems. As a result, the amount of data exchanged per iteration is reduced. In Li et al. (2019), a double-deck scheduling solution was established by ATC, and then, a linearized optimization model for active distribution networks is established due to existence of interaction variables between the upper and lower layers. The aforementioned research provides a good reference for this work to conduct OTS.
In addition, the large-scale grid integration of renewable energy gradually changes the balance pattern of load generation in the traditional grid, and its related research discusses methods of optimizing the consumption rate of renewable energy in the power system (Sahri et al., 2021; Srivastava et al., 2021; Dashtdar et al., 2022). A large number of studies on OTS that consider renewable energy sources have been conducted. In Liu et al. (2022), an OTS model with renewable energy considering structural optimization was proposed, which reduces the system operation cost and cost of loss due to network blockage after failure by OTS. In Ogundairo et al. (2022), a two-stage stochastic optimization model that considers OTS and energy storage allocation was constructed to improve the economy of the power grid by incorporating renewable energy sources. In Ahmed et al. (2021), to reduce the fluctuation influence of large-scale wind power in the grid, an OTS model for integration of large-scale renewable energy based on probabilistic power flow was proposed, and the superiority of which has been verified by numerical examples. However, the aforementioned studies do not consider the reactive voltage characteristics of wind and photovoltaic generators, cannot realize the deep excavation of renewable energy consumption capacity of the power system, and have certain limitations. As fossil energy generation gradually gives way to renewable energy generation, on the one hand, the active power balance gets worse regularly and absorption capacity of the renewable energy becomes insufficient. On the other hand, the proportion of synchronous generators with active excitation regulation in the system decreases, while the asynchronous power generation forms such as wind power and photovoltaic that consist of voltage support increase. Therefore, reactive power voltage regulation resources in the system should be fully tapped to support the consumption of renewable energy. In Naga Sai Kalyan et al. (2023), an optimization model based on the fruit fly optimization technique (FFOT) is established, which solves the coupling problem of output adjustment of multi-area and multi-renewable energy power. The advantages of ATC over the aforementioned research are that it allows for a systematic step-by-step approach to address the interdependencies between different components or sub-systems. By breaking down the problem into smaller and more manageable goals, it becomes easier to identify and address the specific coupling issues. This method also promotes modularity and flexibility, as changes or updates in an area can be made without affecting the entire system. Ultimately, the goal-oriented cascade method helps to reduce complexity and improve overall system performance.
To tap the renewable energy consumption potential of multi-regional interconnected power systems and design a model that conforms to the dispatching mode, an OTS model with renewable energy based on ATC is established. The main contributions are as follows:
1) The ATC-based model can effectively enhance the economic efficiency of operating interconnected grids, fully leverage the system’s flexible operational capabilities, and optimize resource utilization across the entire network.
2) An OTS model considering wind and photovoltaic energy is proposed, and the reactive voltage regulation characteristics of wind and photovoltaic are considered to measure uncertainty caused by the change of entropy, and then the renewable energy generation component model is established. By incorporating binary variables that indicate the status of the lines into the decision variables, the operation economy of power system with wind and photovoltaic generations can be improved by optimizing the power transmission network structure and the power output of the generators.
3) For the model of multi-regional interconnected transmission, the bus-tearing method is used to divide the electrical grids into separate zones, and independent economic dispatch is performed within each zone. ATC is used to solve the proposed model, which can partly reduce the difficulty of calculation. The applicability of the proposed model is verified based on numerical studies.
2 Renewable energy generation model
To deal with the uncertainty caused by the entropy increase of the interconnected grid such as renewable energy, it is crucial to take the development status and output characteristics of renewable energy generator components into account, mainly wind generators and photovoltaic, and realize their fine modeling, so as to provide effective guarantee for the resource allocation of OTS. Section 2 considers the characteristics of the current power system application technology development to build renewable energy generator models.
2.1 Doubly fed induction wind turbine
One of the key advantages of the doubly fed wind turbine is that its rotor winding has an additional power supply that can adjust the amplitude and phase angle, which can carry out the regulation of reactive power and emit reactive power. At the same time, the control of active and reactive power can be separated by regulating the excitation current of the rotor. The operating limit of the doubly fed induction wind generator is shown in Figure 1, where
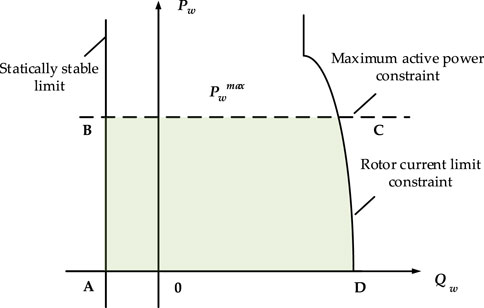
FIGURE 1. Safe operating limit of the doubly fed induction wind generator.
The doubly fed induction wind turbine is a popular model, as it uses a double PWM fully controlled converter to regulate the excitation current, allowing for variable speed and constant frequency operation. This type of wind turbine can adjust its active and reactive power output by modifying the amplitude and phase of the excitation current. Its power characteristics can be summarized as follows:
2.2 Photovoltaic generation
Photovoltaic generation output limits are shown in Figure 2. OA and OB correspond to the power factor constraint, and the photovoltaic generation can operate safely in the area surrounded by OABC within the condition of satisfying the maximum active output constraint. Under a certain active output, the reactive power regulation capability depends on the system maximum capacity. The grid-connected photovoltaic generator system has a poor reactive voltage support capacity, and the system has a higher possibility of voltage crossing limits and voltage instability.
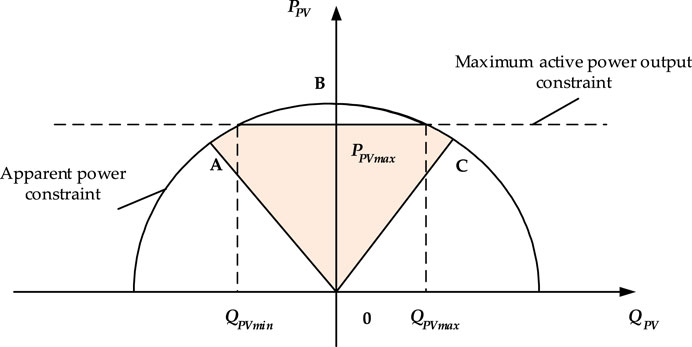
FIGURE 2. Safe operating limit of photovoltaic generation.
The output limits of photovoltaic generation can be described as
3 Analytical target cascading
In ATC, the coupled information in the upper system is first passed to the sub-systems, and then each sub-system is solved separately to acquire the optimal solution (Shayesteh et al., 2015). Similar to the ADMM and auxiliary problem principle (APP) (Li et al., 2022), APP and ADMM methods utilize duality and penalty functions to decompose the primary optimization problem into multiple sub-problems. While the entire system is decomposed into multiple sub-systems by ATC, the constraint relaxation is utilized to enable information interconnection between sub-systems, and each problem is solved in parallel (Kargarian et al., 2017).
To ensure the effectiveness of the amount of information shared between interconnected regions, in this work, the inter-regional tie line exchange power and voltage phase angle are selected as the shared information variables, and the shared information between adjacent layers is modeled by setting the target and response variables to form the objective function and constraints associated with each independent region. The objective variable is the shared information transmitted from the upper layer (main problem layer) to the lower layer (sub-problem layer), and response variables are the shared information transmitted from the lower layer to upper layer.
4 OPF model with renewable energy based on ATC
Considering that the economic dispatch of renewable energy and OPF is a non-linear optimization of complex networks, for this reason, the OTS model is established based on the bus-tearing method and ATC. Without loss of generality, this work divides the system into three parts by the bus-tearing method and builds a corresponding OPF model. This section takes region A as an example to construct a multi-regional economic dispatch model of the transmission grid based on ATC, and similarly, the models of region B and region C can be established.
4.1 Objective function
The objective function is to minimize the operation cost of the generators.
4.2 Constraints
(1) Power flow constraints
(2) Transmission line current constraints
(3) Generator output constraints
(4) Branch power constraints
(5) Voltage phase angle constraints
(6) Node power balance constraints
(7) Region-coupled constraints
In addition, constraints (1)–(8) related to wind and photovoltaic generations are also included in the proposed OPF model.
4.3 Model simplification
The proposed model is decomposed by taking the upper and lower systems shown in Figure 3. As seen in Figure 3A, to pursue the minimization of the total system operation cost, the upper–lower system information transfer variables are optimized iteratively. As shown in Figure 3, to illustrate the solution process of the proposed model, the relationship of each area in ATC is depicted with area A as the upper system.
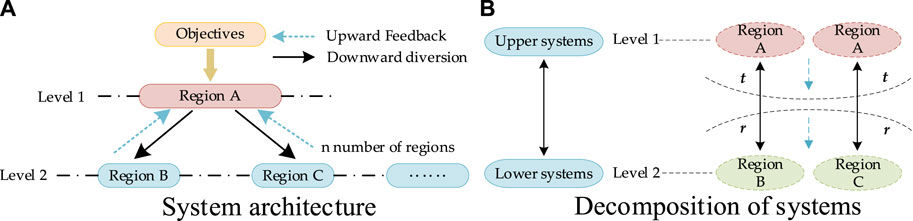
FIGURE 3. Decomposition of upper and lower systems.
To facilitate the description of ATC, the matrix function of the model is established as follows:
5 Model transformation and solution
5.1 Objective function
To facilitate the formation of objective functions and constraints about each region, two sets of variables were set. According to the structural characteristics of ATC, constraint (29) is solved in the upper and lower system models.
The optimization model of the upper–lower system can be described as follows:
By relaxing the coupling constraints through (30)–(32), to ensure the convergence of the upper and lower layer problems, the penalty term which includes the augmented Lagrangian function is added to the relevant objective function, by which, only the regional constraints and regional decision variables that have to be satisfied in the regional variables remain in the whole system, thus realizing the decoupling process.
5.2 Decoupled model
The objective function in optimal scheduling of the interconnected grid based on ATC can be described as follows:
When region A of the upper layer solves its own model, it transfers the optimized value
It can be seen from (30) that similar to the upper system, when the lower system is independently optimized, it is necessary to combine virtual generator
By updating multipliers, the objective function meets the convergence condition and tends to be optimal. At this point, the upper and lower systems can be updated and solved independently.
5.3 Convergence criterion
The convergence criterion of the proposed model based on ATC is as follows:
If both (35) and (36) cannot be satisfied, the multipliers are updated according to (37).
5.4 Optimization process of ATC
The optimization processes of the transmission network structure based on ATC are shown in Figure 4. The approach steps are as follows:
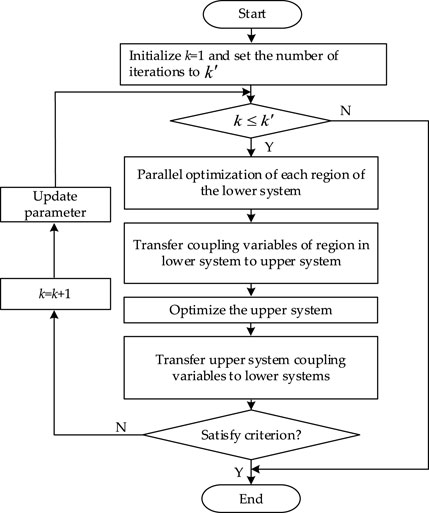
FIGURE 4. Optimization solution flow of OTS based on ATC.
Step 1. Set the iteration limit of the ATC model as
Step 2. Solve the lower system variables. According to (28) and (34), parallel optimization is conducted for each region, and the power obtained from the solution is transferred to the upper system.
Step 3. Solve the upper layer system variables. Optimization is conducted according to (27) and (33), and the power obtained is transferred to the lower system.
Step 4. Determine whether (35) and (36) are satisfied. If not, evolve according to the update policy with regard to (37), set the number of iterations
6 Numerical studies
The improved IEEE 14-bus and IEEE 118-bus systems are used to simulate the model, and optimization of the results are analyzed. The computer is configured with Intel i7-6300 processor and 8 G memory. The GAMS software is used for programing, and the CPLEX tool is used to solve the model. The detailed line parameters are shown in Tables 1–5.
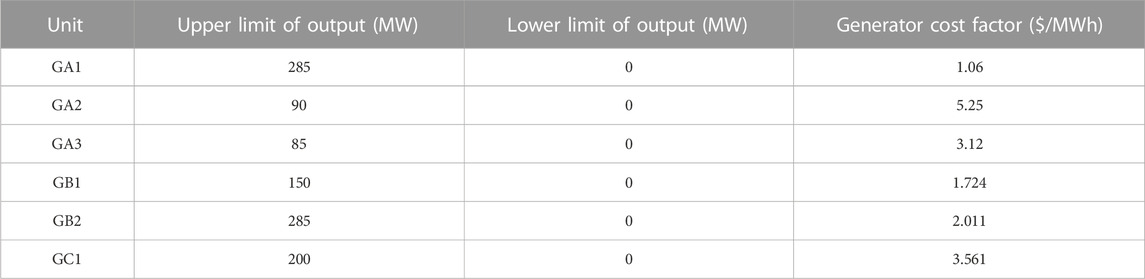
TABLE 1. IEEE 14-bus generator parameters.
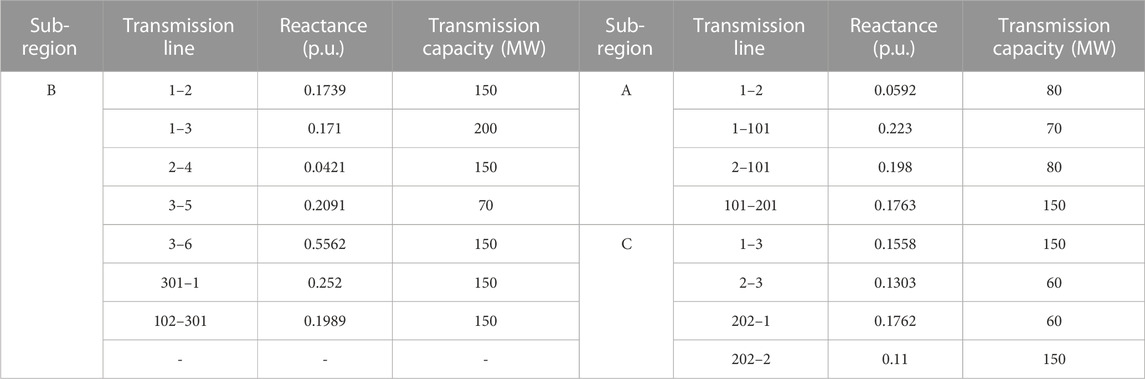
TABLE 2. IEEE 14-bus line parameters.
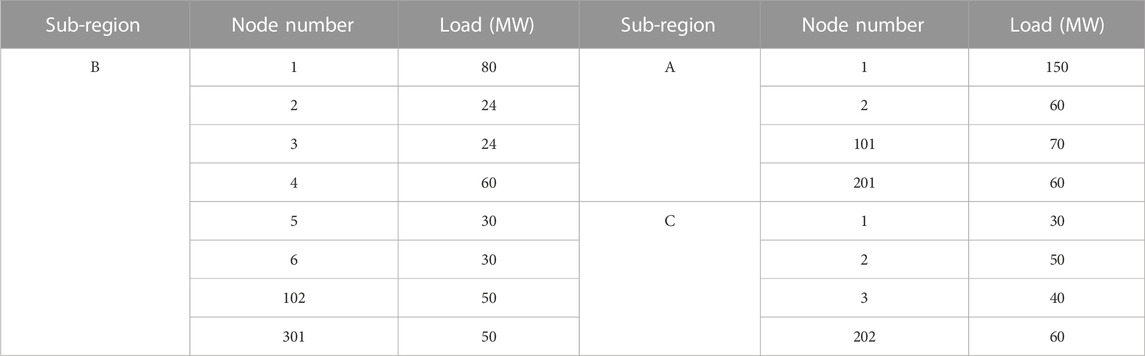
TABLE 3. IEEE 14-bus load parameters.

TABLE 4. Wind generator parameters.

TABLE 5. Photovoltaic power generator parameters.
6.1 IEEE 14-bus system
There are five generators and 20 lines in the IEEE 14-bus system, and the other parameters are given in Appendix A. Considering the randomness of photovoltaic and wind power generation, the random variables in the upper and lower limits of their output are selected for testing. The system is decomposed into a three-zone system by the busbar-tearing method, as shown in Figure 5. In addition, the number of open power lines in region A and region B is 1.
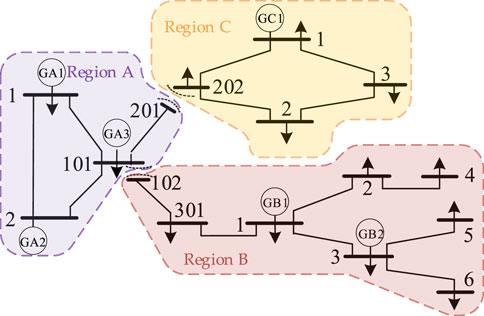
FIGURE 5. Three-regional interconnection system.
6.1.1 Algorithm effectiveness
The results obtained aim to verify the solving advantages of the adopted ATC algorithm in comparison with the APP algorithm and augmented Lagrange relaxation (ALR) algorithm, as shown in Table 2 and Figure 6.
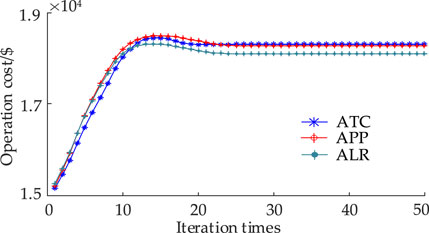
FIGURE 6. Comparison of algorithm results.
As shown in Table 6 and Figure 6, the operating costs of the solution using the APP algorithm and ALR algorithm are $18,212.23 and $18,103.25, respectively, while the operating cost obtained by the ATC algorithm is $18,394.46. The reason for the operating cost of the ATC algorithm being a little higher than that of the APP algorithm and ALR algorithm is because of the setting of the initial parameters and the change in the network topology. The number of iterations and convergence time of the ATC algorithm are less than that of the APP algorithm and ALR algorithm, which are 34 times and 7.71 s, respectively, indicating that the ATC algorithm has a better convergence performance. In addition, the complexity of the OTS problem itself makes it difficult for the APP algorithm and ALR algorithm to obtain a high-precision solution. It is evident that the ATC algorithm is highly scalable and can be well adapted to the OTS optimization problem of the system.

TABLE 6. Results of different algorithms.
6.1.2 OTS and renewable energy access impact analysis
In this study, the following four cases are set up and compared for analysis in order to demonstrate the effect of OTS and the impact of wind power and photovoltaic power generation on system operation.
Case 1. No consideration of OTS and renewable energy generation.
Case 2. Without considering OTS and considering renewable energy generation.
Case 3. Considering OTS without considering renewable energy generation.
Case 4. Considering both OTS and renewable energy generation.
1) Analysis of the impact of not considering OTS
When OTS is not considered, case 1 and case 2 are compared in order to certify the impact of renewable energy access on transmission grid operation, and the generator output and operating costs for each region are shown in Table 7.From Table 7, due to the consideration of renewable energy generation access, case 2 greatly releases the generation capacity of GA1, which increases the output of GA1 with a better economy and reduces the output of GA2 with the worst economy. The cost of each region in case 1 is $8,476.62, $7,363.38, and $4,363.69. The operating cost of each region in case 2 is reduced by 19.97%, 1.39%, and −0.13% when compared with case 1, where the cost of region A is reduced more, while the cost of region B and region C remain less changed. This indicates that the lower region B and region C can achieve distribution autonomy by virtue of their own generation resources, thus greatly reducing the power relief of the upper region A and making the economy of region A significantly improved.2) Impact analysis of OTS
To prove the effect of considering the OTS when accessing renewable energy, the operating results of case 2 and case 4 are shown in Table 8 and Table 9.As shown in Table 8, when compared with case 2 without considering OTS, the output of GA1 in case 4 increases by 43.27% and the output of GA2, which has the worst economy, decreases by 35.27%, which indicates that considering OTS can realize the interplay of source output pattern and grid structure, making the generation resources reasonably allocated. In terms of the economics, the operating costs of each region in case 4 are $5,814.34, $6,086.17, and $4,261.58, which are 14.29%, 16.18%, and 2.47%, respectively, lower than that in case 2. The aforementioned results show that considering OTS economic scheduling mode can alleviate network congestion and improve system operation economy.As shown in Table 9, when OTS is considered, the system can optimally regulate the transmission line status through the load pattern. During the regulation process, the branch 1-101 in region A undergoes outage state, reducing the transmission blockage and resulting in a significant increase in the transmission power of transmission line 1-2. The results further demonstrate that the simultaneous application of renewable energy access and operating transmission line measures to grid dispatch can increase the system’s operating economy with effect and thus achieve greater synergistic source–grid dispatch. The operating lines for case 3 and case 4 are 2-101, 202-2 and 1-101, 2022, which indicate that the status of the transmission lines can make several rectifications according to the corresponding load patterns after considering OTS, thus effectively improving the flexibility of the grid operation.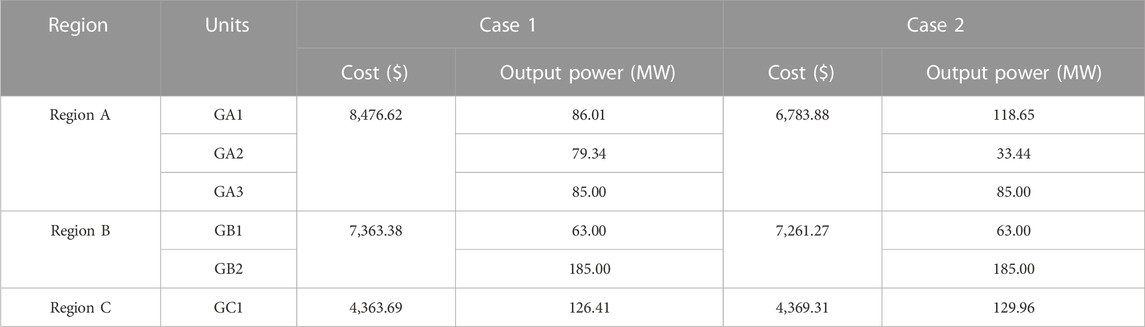
TABLE 7. Operating results of case 1 and case 2.
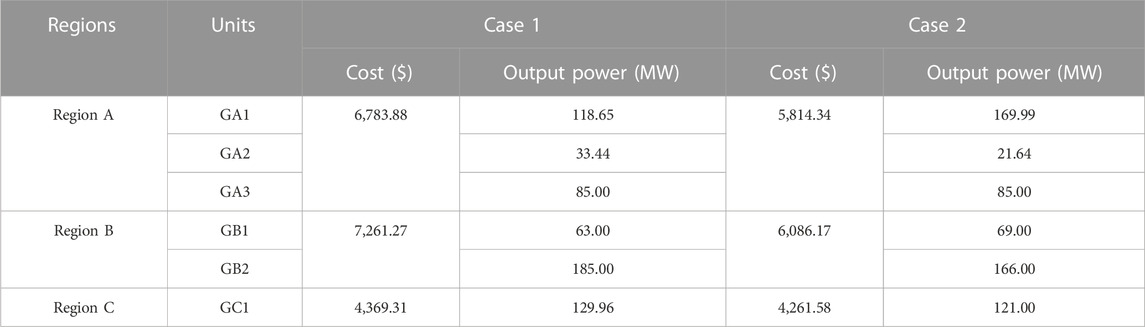
TABLE 8. Operating results of case 2 and case 4.
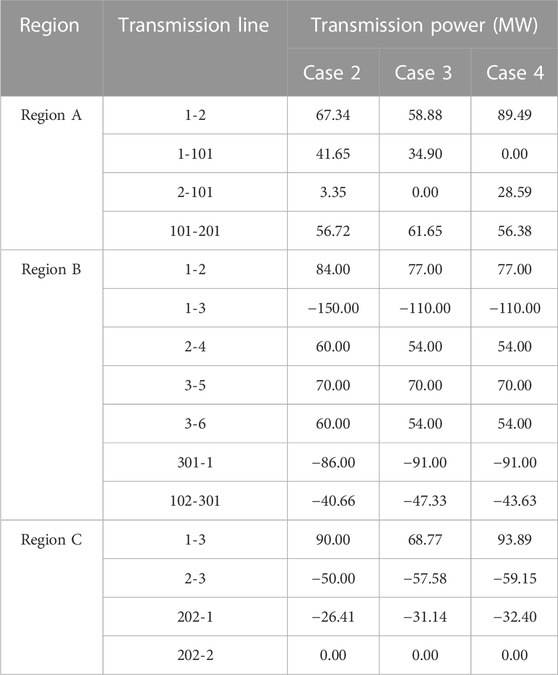
TABLE 9. Transmission line operation considering OTS.
6.2 IEEE 118-bus system
The IEEE 118-bus system structure diagram and partitions are shown in Figure 7 in the Appendix, and the system generator set characteristics data, transmission line data, and system load data are shown in Ji et al. (2021).
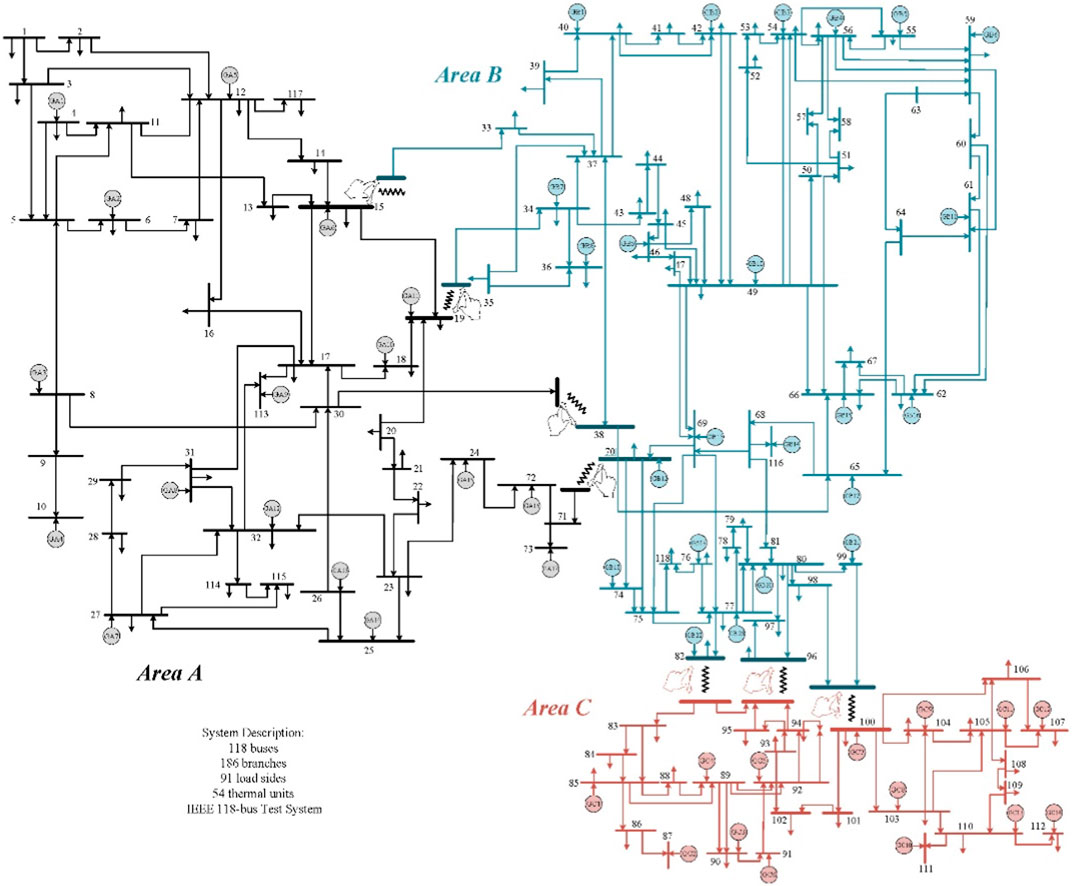
FIGURE 7. IEEE 118-bus structure diagram.
6.2.1 Algorithm performance comparison
In the IEEE 118-bus system, ATC, APP, and ALR are compared in order to testify ATC in the large-scale system. The results are shown in Figure 8.
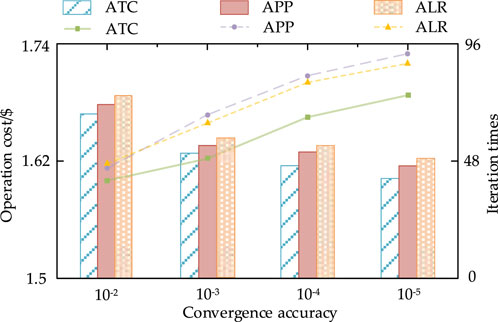
FIGURE 8. Optimization results of algorithms with different convergence accuracies.
As shown in Figure 8, in the wake of improvement in convergence accuracy, ATC tends to the optimum at the fastest speed, showing good convergence performance. In addition, the number of iterations increases with increase of convergence accuracy. When compared with APP and ALR, ATC always maintains a good convergence performance and optimization results under any accuracy requirement. This shows that the ATC still has good applicability to large-scale systems.
6.2.2 Comparison of optimization results
For the IEEE 118-bus system, the aforementioned four schemes are used to test the proposed model, and the results are shown as follows:
Table 10 shows that the total cost of case 4 decreases by 18.99%, 17.65%, and 2.50% when compared with cases 1–3, respectively, and the operating costs of the three regions are $47,311.34, $63,384.13, and $52,117.87, all of which have different degrees of reduction when compared to cases 1–3. This shows that OTS can not only ensure the safe operation of the system but also improve the acceptance level of renewable energy and economy of system operation. The operating cost of region A and region B in case 4 decreases more than that of region C when compared with cases 1–3, which is due to the more serious blockage in region A and region B, so the cost saving accounts for the more obvious. In summary, the simultaneous application of renewable energy and open transmission lines in the grid to realize the cooperation between system regions can reduce the cost of power generation and heighten the utilization efficiency of electric energy, thus enhancing flexibility and economy of overall system operation.
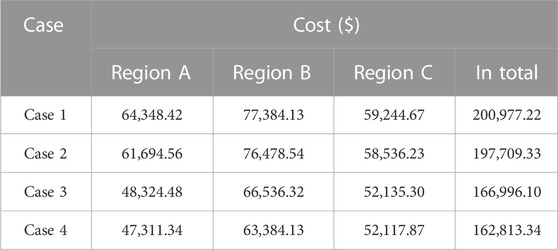
TABLE 10. Results of different cases.
7 Conclusion
In this study, research was conducted on the optimization problem of multi-regional complex network system dispatching, and an OTS model based on the ATC that was proposed to account for renewable energy. The conclusions are as follows:
1) The ATC adopted in this study has a fast convergence speed, which has notable efficiency advantages when applied to the distributed solution of multi-regional interconnected transmission. It can also realize the decoupling of interconnected information, which not only ensures the privacy requirement of multi-agent operation mode but also has good adaptability to large-scale systems. The ATC-based model can effectively improve the economy of the operation of the interconnected grid, bring the flexible operation capability of the system into full play, and efficiently utilize the resources of the whole network.
2) The proposed model adopts OTS in the system containing renewable energy generation, improves the distribution of power flow in transmission networks to optimize the entropies of complex networks, and actively cooperates with renewable energy generators that do not have controllability to realize source–grid co-optimization, which is a proven solution to improve renewable energy consumption capacity and system voltage level.
3) The proposed model adds discrete variables, indicating whether the transmission lines are operating or not, which can be transferred to the dispatch center as decidable information, making it possible to reasonably decide the required transmission grid architecture of the system. The combination of grid structure optimization, renewable energy, and ATC greatly frees up the transmission capacity of the grid and improves the generality of the model.
Future research can focus on enhancing the computational efficiency and accuracy of the model.
Data availability statement
The original contributions presented in the study are included in the article/Supplementary Material, further inquiries can be directed to the corresponding author.
Author contributions
All authors listed have made a substantial, direct, and intellectual contribution to the work and approved it for publication.
Conflict of interest
The authors declare that the research was conducted in the absence of any commercial or financial relationships that could be construed as a potential conflict of interest.
Publisher’s note
All claims expressed in this article are solely those of the authors and do not necessarily represent those of their affiliated organizations, or those of the publisher, editors, and reviewers. Any product that may be evaluated in this article, or claim that may be made by its manufacturer, is not guaranteed or endorsed by the publisher.
References
Ahmed Nawa, Z., and Shah Valare, R. A. Z. M. A. O. (2021). Optimal transmission switching based on probabilistic load flow in power system with large-scale renewable energy integration. Electr. Eng. 104, 883–898. doi:10.1007/s00202-021-01344-z
Bai, Y., Zhong, H. W., Xia, Q., Kang, C., and Xie, L. (2015). A decomposition method for network-constrained unit commitment with ac power flow con-straints. Energy, Aug. 88, 595–603. doi:10.1016/j.energy.2015.05.082
Dashtdar, M., Belkhier, Y., and Baiai, M. “Protection of DC microgrids based on frequency domain analysis using fourier transform,” in Proceedings of the 2022 IEEE 3rd KhPI Week on Advanced Technology (KhPIWeek), Kharkiv, Ukraine, October 2022, 1–6.
Eresghs, T. (2014). Distributed optimal power flow using ADMM. IEEE Trans. Power Syst. 29 (5), 2370–2380. doi:10.1109/tpwrs.2014.2306495
Gao, X., Peng, M. F., and Tse, C. K. (2023). Cascading Failure analysis of cyber–physical power systems considering routing strategy. IEEE Trans. Circuits Syst. II Express Briefs 70 (1), 136–140. doi:10.1109/tcsii.2021.3071920
Huang, L. B., Xin, H. H., Li, Z. Y., Li, Z., Ju, P., Yuan, H., et al. (2020). Identification of generalized short-circuit ratio for on-line stability monitoring of wind farms. IEEE Trans. Power Syst. 35 (4), 3282–3285. doi:10.1109/tpwrs.2020.2975413
Ji, X. Q., Zhang, Y. M., Han, X. S., Ye, P., Xu, B., and Yu, Y. (2021). Multi-level interactive unit commitment of regional power system. Int. J. Electr. Power and Energy Syst. 125, 106464. doi:10.1016/j.ijepes.2020.106464
Kargarian, A., and MehrtashFalahati, M. B. (2017). Decentralized implementation of unit commitment with analytical target cascading: A parallel approach. IEEE Trans. Power Syst. 33 (4), 3981–3993. doi:10.1109/tpwrs.2017.2787645
Khanabadi, M., Ghasemi, H., and Doostizadeh, M. (2013). Optimal transmission switching considering voltage security and n-1 contingency analysis. IEEE Trans. Power Syst. 28 (1), 542–550. doi:10.1109/tpwrs.2012.2207464
Li, H. X., Hao, G. F., Mao, M. X., and Zhou, L. (2022). Decentralized communication based two-tier voltvar control strategy for largescale cen-tralized photovoltaic power plant. IEEE Trans. Sustain. Energy 13 (1), 592–606. doi:10.1109/tste.2021.3121536
Li, Z. M., Wu, L., and Xu, Y. (2021). Risk-averse coordinated operation of a multi-energy microgrid considering voltage/var control and thermal flow: An adaptive stochastic approach. IEEE Trans. Smart Grid. Early access 12 (5), 3914–3927. doi:10.1109/tsg.2021.3080312
Li, Z., Wu, L., and Xu, Y. (2023). Distributed tri-layer risk-averse stochastic game approach for energy trading among multi-energy microgrids. Appl. Energy 331. doi:10.1016/j.apenergy.2022.120282
Li, Z., Xu, Y., Fang, S., Wang, Y., and Zheng, X. (2019). Multiobjective coordinated energy dispatch and voyage scheduling for a multi-energy ship microgrid. IEEE Trans. Industrial Appl. 56 (2), 989–999. doi:10.1109/tia.2019.2956720
Liu, B., Li, Z., Chen, X., Huang, Y., Liu, X., Chen, X., et al. (2017). Recognition and vulnerability analysis of key nodes in power grid based on complex network centrality. IEEE Trans. Circuits Syst. II Express Briefs 65 (3), 346–350. doi:10.1109/tcsii.2017.2705482
Liu, Y. M., and WangGu, T. X. P. (2022). Robust optimal transmission switching for wind farm-integrated power systems from a perspective of steady-state security region. IET Renew. Power Gener. 16 (5), 945–955. doi:10.1049/rpg2.12404
Naga Sai Kalyan, C. H., Srikanth Goud, B., and Nagendra, M. “Performance enhancement of combined LFC and AVR system with the integration of HVDC line,” in Proceedings of the 2023 IEEE IAS Global Conference on Renewable Energy and Hydrogen Technologies (GlobConHT), Male, Maldives, March 2023, 1–6.
Ogundairo, O., Kamalasadan, S., Nair, A. R., and Smith, M. (2022). Oscillation damping of integrated transmission and distribution power grid with re-newables based on novel measurement-based optimal controller. IEEE Trans. Industry Appl. 58 (3), 4181–4191. doi:10.1109/tia.2022.3162565
Ostrowski, J., Wang, J., Liu, C., and Liu, C. (2014). Transmission switching with connectivity-ensuring constraints. IEEE Trans. Power Syst. 29 (6), 2621–2627. doi:10.1109/tpwrs.2014.2315434
Sahri, Y., Belkhier, Y., Tamalouzt, S., Ullah, N., Shaw, R. N., and Chowdhury, M. S. (2021). Energy management system for hybrid PV/wind/battery/fuel cell in microgrid-based hydrogen and economical hybrid battery/super capacitor energy storage. Energies 14 (18), 5722. doi:10.3390/en14185722
Shayesteh, E., Hobbs, B., Söder, L., and Amelin, M. (2015). ATC-based system reduction for planning power systems with correlated wind and loads. IEEE Trans. Power Syst. 30 (1), 429–438. doi:10.1109/tpwrs.2014.2326615
Srivastava, P., Bajaj, M., and Belkhier, Y. “Power quality issues with penetration of wind energy and the role of ldc: A mini review,” in Proceedings of the International Conference on Computational Intelligence and Sustainable Technologies: ICoCIST 2021, Singapore, June 2022 Springer Nature Singapore, 625–635.
Wang, P., Wu, Q., Huang, S., and Zhou, B. (2022). ADMM-based distributed active and reactive power control for regional ac power grid with wind farms. J. Mod. Power Syst. Clean Energy 10 (3), 588–596. doi:10.35833/mpce.2020.000918
Wei, Y., Wen, L. L., Li, W., Chung, C., and Wong, K. (2011). Decomposition–coordination interior point method and its application to multi-area optimal re-active power flow. Int. J. Electr. Power and Energy Syst. 33 (1), 55–60. doi:10.1016/j.ijepes.2010.08.004
Zhai, J. Y., Zhou, M., Li, J. N., Zhang, X. P., and Zhang, W. (2021). Decentralised and distributed day-ahead robust scheduling frameworks for bulk AC/DC hybrid interconnected systems with a high share of wind power. Electr. Power Syst. Res. 201. doi:10.1016/j.epsr.2021.107492doi:107492
Nomenclature

Keywords: multi-regional interconnected transmission, analytical target cascading, renewable energy, optimal transmission switching, optimal power flow
Citation: Li R, Ye P, Jiang D, Ma L and Sun C (2023) Optimal transmission switching for power system integrating renewable energy based on analytical target cascading. Front. Energy Res. 11:1239232. doi: 10.3389/fenrg.2023.1239232
Received: 13 June 2023; Accepted: 17 July 2023;
Published: 27 July 2023.
Edited by:
Yuqing Dong, The University of Tennessee, United StatesReviewed by:
Lili Hao, Nanjing Tech University, ChinaXiangjun Zeng, China Three Gorges University, China
Xingxu Zhu, Northeast Electric Power University, China
Youcef Belkhier, Maynooth University, Ireland
Copyright © 2023 Li, Ye, Jiang, Ma and Sun. This is an open-access article distributed under the terms of the Creative Commons Attribution License (CC BY). The use, distribution or reproduction in other forums is permitted, provided the original author(s) and the copyright owner(s) are credited and that the original publication in this journal is cited, in accordance with accepted academic practice. No use, distribution or reproduction is permitted which does not comply with these terms.
*Correspondence: Pingfeng Ye, eXBmQHNkdXN0LmVkdS5jbg==