 Shun Ma
 Shiyan Mei1
- 1Guangdong Power Grid Co., Ltd., Guangzhou, China
- 2Dongguan Power Supply Bureau of Guangdong Power Grid Co., Ltd., Dongguan, China
Against the backdrop of increasingly prominent environmental issues, new energy consumption issues, and energy supply and demand balance issues, the optimization of multi time scale operation of distributed electro hydrogen coupling systems has become a research focus. Based on this, this article optimizes the multi time scale operation of a distributed electric hydrogen coupling system that takes into account grid interaction. By designing a system framework for distributed electro hydrogen coupling systems, operational strategies for each system were proposed. Analyzed the uncertainty and response characteristics of wind and solar power generation units and load demand, and constructed a multiple uncertainty model for distributed electric hydrogen coupling system. At the same time, a three stage, multi time scale operation optimization model of the electric hydrogen coupling system was constructed based on the response characteristics of the distributed electric hydrogen coupling system. The construction of these models reduced scheduling costs by 12.55% and increased clean energy consumption rate by 13.50%.
1 Introduction
Under the “dual carbon” goal, environmental issues and energy supply and demand balance are becoming increasingly prominent (Ren et al., 2022). In this context, the production of clean wind and solar new energy has developed on a large scale, but problems such as uncertainty, volatility, and inability to fully absorb remain unresolved (Li et al., 2022). Utilizing uncontrollable wind and solar new energy to generate hydrogen and locally supply regional hydrogen load demand can reduce transportation costs. At the same time, hydrogen energy, as a secondary energy source, has advantages such as flexible conversion and long-term energy storage (Gorre et al., 2020; Zhang et al., 2022). Therefore, coupling the electric energy network with the hydrogen energy network into an electric hydrogen system has significant economic value (Zhang et al., 2022). Optimizing the operation of the coupling system lays the foundation for the development of distributed electric hydrogen coupling systems. However, at different timescales, the accuracy of wind, photovoltaic, and load prediction in the electric hydrogen coupling system is inconsistent (Li et al., 2022). It is necessary to conduct research on the multi-timescale operation of the electric hydrogen system.
Regarding research on multiple timescales, most of the existing research focuses on integrated energy systems. Based on the differences in energy characteristics in integrated energy systems, Li et al. (2020) optimized the scheduling time resolution of cooling, heating, and electricity and constructed a mixed day-to-day timescale scheduling optimization model for integrated energy systems. Xu et al. (2019) designed a comprehensive response architecture that considers multiple timescales to achieve orderly scheduling of user demand responses, which can reduce overall operating costs. Wang et al. (2022) proposed a two-stage scheduling optimization plan with the objective function of minimizing operating costs, taking the combined cooling, heating, and power system as the research object. Jin et al. (2019) focused on microgrid systems and also proposed a two-stage scheduling optimization plan. On the basis of the two-stage rolling optimization of “day-ahead–day-in,” Yuan et al. (2019) (Bao et al., 2016) proposed a multi-timescale scheduling optimization method that considers “day-ahead–day-in–real-time,” where day-ahead takes 1 h as the scheduling response time, the day-in response time is 15 min, and the real-time response time is 5 min. Furthermore, based on the optimization of “day-ahead–day-in–real-time,” Zhao et al. (2020) proposed a long-term optimization model with an annual cycle, with the objective function of minimizing annual investment cost, to optimize the capacity allocation and investment decision-making of the comprehensive energy system. From the existing multi-timescale optimization research, on the one hand, there is a lack of operational optimization research focusing on distributed electro-hydrogen coupling systems in the research object. On the other hand, in terms of multi-timescale research, the growth of scheduling response time is mostly 1 h in the day-ahead, 15 min in the day-in, and 5 min in the real-time, without in-depth consideration of equipment and energy characteristics.
In the operation process of distributed electric hydrogen coupling systems, due to the existence of multiple uncertainties in wind power, photovoltaic, and load, the study of uncertainty is also crucial for distributed electric hydrogen coupling systems. Pan et al. (2022) used robust coefficients to characterize the uncertainty of renewable energy sources and other sources. Hou et al. (2021) described the uncertainty of wind and solar output based on the typical scenario method. Lu et al. (2022) used the interval method to describe the uncertainty of user-end load. In addition to considering the unilateral uncertainty of the source and load ends, Cui et al. (2022) (Zhai et al., 2020) also considered the uncertainty of new energy generation and comprehensive demand response and verified through examples that considering multiple uncertainties can improve the risk resistance ability of the comprehensive energy system. The existing research on uncertainty can consider the uncertainty of source-side output and load-side demand response. However, in distributed electro-hydrogen coupling systems, demand response is an important resource for its invocation, and the accuracy of resource invocation will also affect the uncertainty of the system. Existing research has little consideration for the uncertainty of load-side demand response.
Based on the aforementioned research, this paper conducts a multi-timescale operation optimization study of a distributed electric hydrogen coupling system that takes into account grid interaction. Compared with the existing research, this work incorporated the following innovations:
(1) In terms of uncertainty analysis, not only the uncertainty of the source and load ends is considered, but also the uncertainty of the load demand response in the coupled system is innovatively considered.
(2) In terms of operational optimization, based on the response characteristics of the equipment, a three-stage multi-timescale operational optimization model of “day-ahead–day-in–real-time” is proposed. Considering the adjustment and response level of equipment in the day-in and real-time stages, a “day-in–real-time” two-stage adjustment plan is developed, which differs from traditional overall adjustment.
(3) In terms of scheduling time, the traditional response scheduling time of 1 h in the day-ahead, 15 min in the day-in, and 5 min in the real-time is optimized based on system equipment and various energy characteristics.
The remainder of this paper is arranged as follows: in Section 2, the framework of the electric hydrogen coupling system is designed, and the operation strategy of the coupling system unit is proposed. In Section 3, based on the system unit modeling, the uncertainty and response characteristics of the coupled system are analyzed. In Section 4, a coupled system operation optimization model with three timescales of day before day, day within day, and real time is constructed. In Section 5, taking a coupled system as an example for empirical analysis, the effectiveness of the model was verified.
2 Design of the electric hydrogen coupling system
2.1 System framework
The electric hydrogen coupling system includes three networks: electric energy network, hydrogen network, and thermal network. The distributed power supply network consists of wind turbines, photovoltaic panels, external networks, and electrical loads. The hydrogen network consists of an electrolytic cell, hydrogen fuel cell, hydrogen storage tank, and hydrogen load. The thermal energy network is composed of electric to heat equipment, electrolytic cell, and cooling water circulating device inside the hydrogen fuel cell. Distributed power supply, hydrogen network, and thermal network are coupled together and coordinated and dispatched by the control center of the electric hydrogen coupling system. When there is a shortage demand in the coupling system, energy is purchased from external networks. If the system exceeds supply, energy is sold to external networks (Figure 1).

FIGURE 1. Framework diagram of the electric hydrogen coupling system.
2.2 System unit operation strategy
2.2.1 Electric energy network
In order to reduce wind and solar power abandonment rates and achieve the consumption of wind and photovoltaic power generation, the control center of the electric hydrogen coupling system conducts full scheduling of wind and photovoltaic power generation. On the one hand, when wind power and photovoltaic power cannot meet the electricity load demand, electricity is purchased from the external grid to meet the electricity load demand shortage. On the other hand, the hydrogen is released from the hydrogen storage tank and generated by the hydrogen fuel cell. When wind and photovoltaic power generation exceeds the electricity load demand, the electrolysis cells use the excess electricity to produce hydrogen, and the generated hydrogen is stored in hydrogen storage tanks to supply the local hydrogen load demand.
2.2.2 Hydrogen energy network
When wind and photovoltaic power generation exceeds the electricity load demand, the electrolytic cell uses excess electricity to produce hydrogen, and combined with the electricity price situation, the generated hydrogen is stored in the hydrogen storage tank. If the power load of the system is insufficient and the electricity price is high, the hydrogen in the storage tank will be supplied to the hydrogen fuel cell to generate electric energy and heat energy to obtain benefits. If the system’s electricity load is insufficient, the electricity price is low, and the purchased electricity meets the system’s electricity load demand with higher efficiency, the generated hydrogen will be stored in hydrogen storage tanks to supply the regional hydrogen load demand.
2.2.3 Thermal network
The heat load demand of the thermal energy network is met by the electric-to-heat equipment, hydrogen fuel cell, and electrolytic cell. Among them, the heating efficiency of hydrogen fuel cells is higher than the power supply efficiency. In hydrogen fuel cells, we first consider the heat load demand to control the hydrogen consumption of hydrogen fuel cells and then consider the power load demand. Therefore, hydrogen fuel cells and electrolytic cells are first used to meet the heat load demand in the heat energy network. If hydrogen fuel cells and electrolytic cells cannot meet the heat load demand, then the power is purchased from the external network or the excess power from wind and solar power generation is used to supply heat through the electric-to-heat equipment.
3 Unit modeling and uncertainty analysis of the electro-hydrogen coupling system
3.1 System unit modeling
This section considers the characteristics of each unit equipment and constructs corresponding models.
3.1.1 Wind turbines
The output of wind power at each moment is the product of the installed capacity and output coefficient of the wind power plant, as shown in Eq. 1:
where
3.1.2 Photovoltaic unit
Photovoltaic power generation is influenced by regional light intensity, and the beta distribution is used to fit the radiation pattern of light. The output of photovoltaic power generation is shown in Eq. 2:
where
3.1.3 Electric tank
Electrolytic cells include an alkaline electrolyzer, a high-temperature steam electrolyzer, and a proton-exchange membrane electrolyzer. Due to their advantages of easy maintenance and wide application (Liu et al., 2022), alkaline electrolyzers are suitable for the electric hydrogen coupling system constructed in this paper for park scenarios. Based on this, an alkaline electrolytic cell is used in this section. The real-time balance between the electrical energy consumed and the energy generated during the operation of an alkaline electrolytic cell is shown in Eq. 3:
where
Under constant temperature and pressure conditions, the hydrogen production efficiency of the electrolytic cell is related to the current efficiency and voltage efficiency, as shown in Eq. 4:
where
Under certain temperature and pressure conditions, the electrolysis of water voltage of the electrolytic cell depends on the current density, as shown in Eq. 5:
where
Referring to the relevant parameters of the electrolytic cell in Liu et al. (2022), the non-linear relationship between the input power of the electrolytic cell and the hydrogen production efficiency of the electrolytic cell is shown in Figure 2. The electrolysis cell has the highest hydrogen production efficiency when the input power accounts for approximately 20% of the rated power; however, the hydrogen production amount is small. The optimal operating range is (50%, 100%) of the rated power.
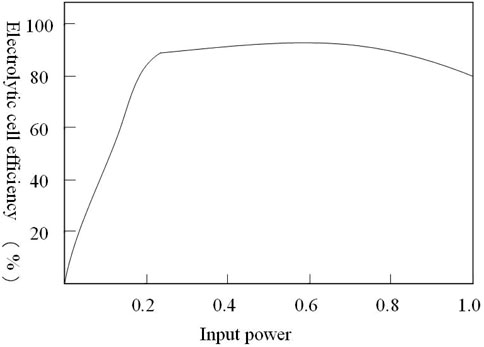
FIGURE 2. Relationship between the input power of the electrolytic cell and hydrogen production efficiency of the electrolytic cell.
3.1.4 Hydrogen storage tank
Based on different pressure requirements, hydrogen storage tanks mainly involve three types of hydrogen storage methods: solid, liquid, and gaseous. Among them, high-pressure hydrogen storage in the gaseous state has been the most widely used, mature, and low-cost method, with a pressure of up to 20 MPa. When the pressure is less than 10 MPa, the ideal equation of state can be used to build the relationship between the mass and pressure of the hydrogen storage tank. However, due to the small relative molecular weight of hydrogen, when the pressure exceeds 10 MPa, it is easy to lead to explosion. At this time, the ideal equation of state does not accurately describe the relationship between mass and pressure. Fan’s equation can characterize the mass and pressure of hydrogen storage tanks by considering the repulsive and gravitational forces between molecules, as shown in Eq. 6:
where
According to Eq. 5, the relationship between the pressure and mass of the hydrogen storage tank is shown in Eq. 7:
The capacity of the hydrogen storage tank is shown in Eq. 8:
where
3.1.5 Hydrogen fuel cell
The hydrogen fuel cell can be regarded as the reverse reaction of electrolyzed water, and its energy model is shown in Eq. 9:
where
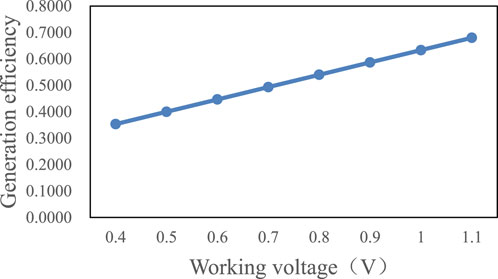
FIGURE 3. Relationship between fuel cell power generation and voltage.
3.1.6 Electric heat transfer equipment
Electric heat transfer equipment converts electrical energy into thermal energy through consumption, and its conversion model is specifically shown in Eq. 10:
where
3.2 Analysis of system uncertainty and response characteristics
This section analyzes the uncertainties faced by distributed hydrogen systems and the response characteristics of various pieces of equipment in the system, laying the foundation for constructing a multi-timescale operation optimization model in Section 4.
3.2.1 Wind and photovoltaic power generation units
In terms of response characteristics, wind and photovoltaic power generation units can quickly abandon wind and light when they exceed the maximum output value, and their adjustability is strong. The response time of the distributed electric hydrogen coupling system for wind and solar power generation units is short, and the response timescale is set to
where
3.2.2 Wind and photovoltaic power generation units
The coupling unit mainly includes electrolytic cell, hydrogen fuel cell, electric heat transfer equipment, and hydrogen storage tank equipment. In terms of response characteristics, the response time of coupling equipment such as electrolytic cells and electric heat-transfer equipment is longer than that of wind and solar power generation units. The alkaline electrolytic cell has a fast start and stop speed, with a dynamic response time of approximately 10 min, which is slower than that of wind and solar power generation units. The dynamic response timescale is set to
3.2.3 Wind and photovoltaic power generation units
The distributed electric hydrogen coupling system constructed in this article mainly includes three types: electrical load, thermal load, and hydrogen load. In terms of response characteristics, it is mainly scheduled through demand response. It is divided into three categories based on the length of the response timescale: the first type is a long-term demand response, including food processing industry and long-term electric heating, which is not flexible enough and requires scheduling and planning 1 day in advance. The dynamic response timescale is set to
The uncertainty analysis of load demand is mainly influenced by user subjectivity and energy prices, and its uncertainty is characterized by the load deviation rate, as shown in Eqs 13–15:
where
The response timescales of different call outputs and loads are summarized in Eq. 16:
4 Optimization model for multi-timescale operation of the electric hydrogen coupling system
4.1 Operational optimization ideas
Based on the analysis results of response characteristics of different pieces of equipment in Section 3.2 of the system, it can be seen that due to the coupling of distributed power supply, hydrogen network, and thermal network, the output characteristics of each type of energy unit are different, resulting in different scheduling response times for each part. Therefore, this paper depends on day-ahead–day-in–real-time rolling optimization for optimization design. In the day-ahead stage, determine the start and stop operation plans for each unit, and in the day-in stage, determine the adjustment plans for each unit based on the errors between the wind and solar output and load demand in the day ahead and day in stages. In the real-time stage, the adjustment plan for each unit is determined based on the error between the daily and real-time stages of wind and solar output and load demand. The optimization design concept is shown in Figure 4:

FIGURE 4. Design ideas for multi-timescale optimization of coupled systems.
Plan development should be carried out 1 day in advance, i.e., 24 h in advance, with a scheduling timescale of
In the day-in rolling optimization stage, the scheduling period is 4 h. In order to coordinate the response timescale between the hydrogen storage tank and other coupling equipment, the scheduling timescale is selected as the least common multiples of
In the real-time rolling optimization stage, the scheduling cycle is 15 min, and the scheduling timescale is
4.2 Day-ahead optimization model
4.2.1 Objective function
In the current optimization stage, the distributed electric hydrogen coupling system aims to minimize the total operating cost of the coupling system as the objective function. The operating costs of the previous stage include the start-up and shutdown costs of the unit, the operating costs of the unit, the demand response call costs, the external network interaction costs, and the uncertainty costs caused by multiple uncertainties in the system, as shown in Eq. 17:
where
4.2.2 Constraint condition
The constraints of the distributed electric hydrogen coupling system in the early stage include power balance constraints and equipment operation constraints. The power balance constraints mainly include electrical energy balance, thermal energy balance, and hydrogen energy balance, as shown in Eq. 18:
Equipment operation constraints mainly include wind and solar power unit operation constraints, coupled unit operation constraints, and demand response constraints, as shown in Eq. 19:
where
4.3 Day-in rolling optimization model
4.3.1 Objective function
In the day-in rolling optimization stage, based on the day-ahead scheduling plan, the scheduling of the second type of demand response and the output adjustment of coupled units are carried out. The optimization goal of the day-in rolling stage is to minimize the adjustment cost, as shown in Eq. 20:
where
4.3.2 Constraint condition
The constraints in the day-in stage also include power balance constraints and equipment operation constraints. The power balance constraints are shown in Eq. 21, and the equipment operation constraints are in the same form as Eq. 19.
4.4 Real-time optimization model
4.4.1 Objective function
In the real-time optimization stage, based on the daily rolling optimization plan, the third type of demand response and hydrogen fuel cell output adjustment are carried out. The optimization goal of the real-time rolling stage is to minimize the adjustment cost
where
4.4.2 Constraint condition
The system balance constraints in the real-time phase are the same as Eq. 18, and the equipment operation constraints are shown in Eq. 23:
4.5 Model solution
The multi-timescale optimization model of the distributed electro-hydrogen coupling system is a complex uncertain mixed integer non-linear programming problem, and the methods for solving uncertainty mainly include approximation and decomposition methods. The decomposition method includes the Benders decomposition algorithm and column-and-constraint-generation algorithm (C&CG). Due to the fact that the C&CG algorithm considers the constraints and variables of the subproblem compared to the Benders decomposition algorithm, which can accelerate convergence, this section adopts the C&CG algorithm for solution. The C&CG algorithm iteratively converges the main problem and subproblems to solve. The main problem is the optimal solution that satisfies the conditions under a known finite distribution, providing a lower bound (LB) value for the robust optimization model. The subproblem is to seek the worst-case distribution and provide an upper bound (UB) value for the robust optimization model under the given conditions of the decision variables in the first stage. The specific model of the C&CG algorithm is referenced in Song et al. (2023), and Cplex is further used for solution.
5 Example analysis
5.1 Basic data
Multiple demonstration projects for electric hydrogen coupling have been put into operation in a certain province of China, with rich experience in electric hydrogen coupling systems. Therefore, in order to verify the effectiveness of the model, a distributed electric hydrogen coupling system for parks in this province was selected as an example for simulation analysis. The deviation rates for wind power generation, photovoltaic power generation, and demand response in the day-ahead, day-in, and real-time stages are set to 5%, 3%, and 1%, respectively. The unit scheduling costs for the first type of load demand response, the second type of load demand response, and the third type of load demand response are 0.6, 0.85, and 1.00 yuan/kWh, respectively. According to the characteristics of each device, the response time for daily, intraday, and real-time scheduling is determined to be 30, 10, and 5 min, respectively. A distributed electric hydrogen coupling system was set up to connect to the external network at 10 kV and interact with the external network using the peak-to-valley electricity prices of general industrial and commercial industries from 1 to 10 kV in the province. At the same time, the specific purchase and sale electricity prices are shown in Table 1 (Tan et al., 2021; Han et al., 2022):

TABLE 1. Electricity prices during peak and valley periods.
The operating parameters of various units are shown in Table 2 (Jiang et al., 2022):
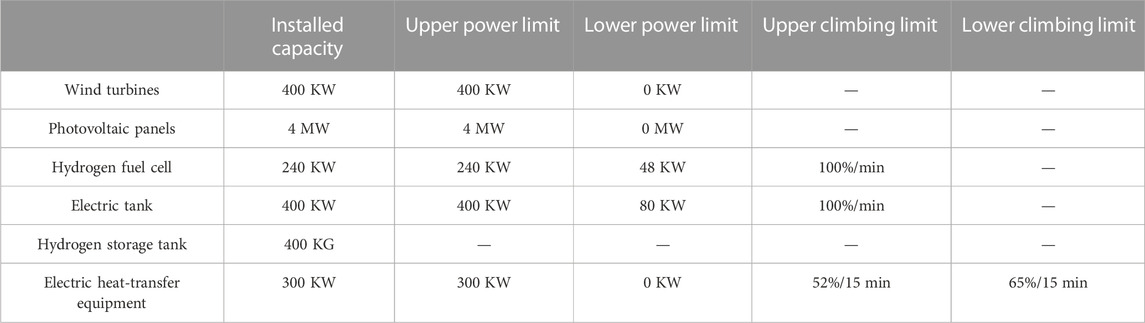
TABLE 2. Operating parameters of various units.
The day-ahead, day-in, and real-time predicted values for wind and photovoltaic power generation are shown in Figures 5, 6 (Tan et al., 2021):
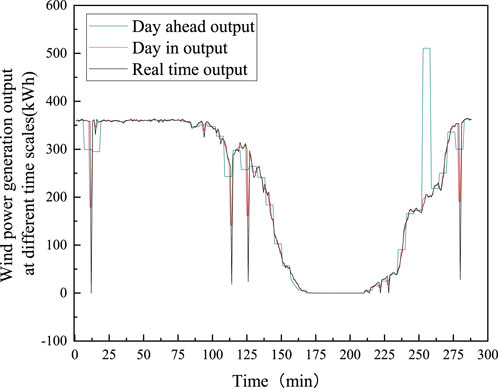
FIGURE 5. Wind power output at different time periods.
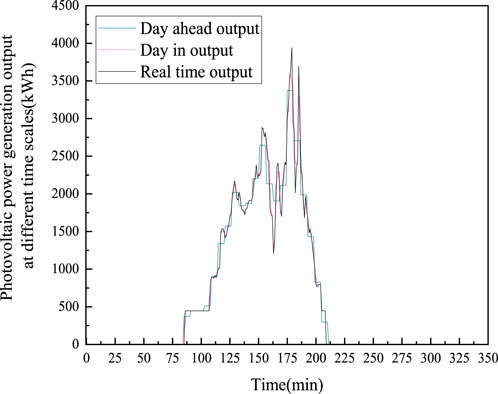
FIGURE 6. Photovoltaic power output at different time periods.
5.2 Example results
5.2.1 Scheduling optimization results for multiple timescales
Based on the predicted values of wind power generation, photovoltaic power generation, and various loads in real-time, in order to minimize the system operating cost, the scheduling optimization results at different timescales are obtained and analyzed. The optimization results of day-ahead, day-in, and real-time scheduling for each unit are shown in Figures 7–9, respectively. Due to the large amount of data under the 5-min scheduling time, the readability of the graph is poor. This paper selects one data at every 12 scheduling points to display day-ahead, day-in, and real-time stages in the graph.
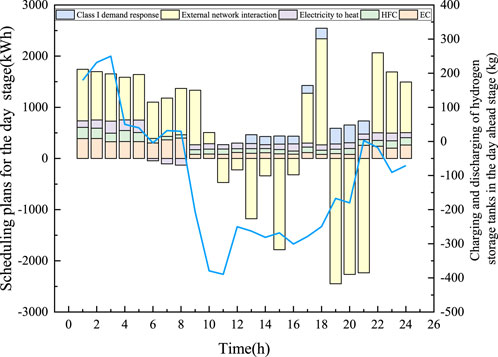
FIGURE 7. Scheduling results in the day-ahead stage.
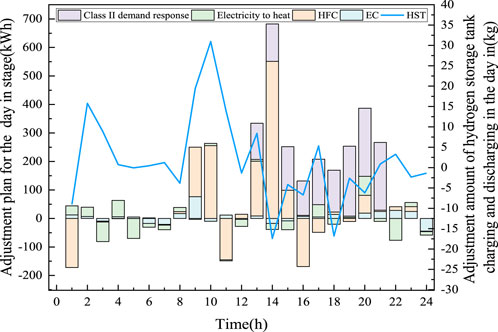
FIGURE 8. Scheduling results in the day-in stage.
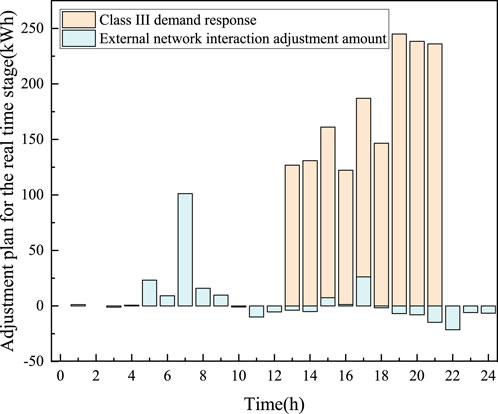
FIGURE 9. Scheduling results in the real-time stage.
From Figures 7–9, it can be seen that the scheduling time for the first, second, and third types of demand response in the day-ahead, day-in, and real-time stages is approximately 19:00–22:00, overlapping with the peak load period. In order to maintain the balance between supply and demand in the recent stage, there are many challenges with the external network. Among them, the electricity purchase is carried out at 22:00–8:00 during the low-price period, and the low-price electricity is converted into hydrogen and stored in the hydrogen storage tank through the electrolytic cell equipment. During the peak power period, the hydrogen fuel cell consumes the hydrogen in the hydrogen storage tank to generate electricity. In the day-in stage, deviation adjustment is mainly carried out by adjusting the hydrogen storage tank and the second type of demand response. The adjustment amount of electric heat-transfer equipment and electrolytic cells is relatively small, and only minor adjustments are made. In the real-time stage, compared to the day-ahead stage, the amount of interaction with the external network is significantly reduced. This is because the deviation in the real-time stage is reduced after adjustment in the day-in stage, and most of the deviation adjustment needs can be met through the third type of demand response.
5.2.2 Effectiveness analysis of uncertainty
In order to analyze and consider the effectiveness of system uncertainty, this paper sets up the following four scenarios for analysis:
Scenario 1: Set the wind and solar power output and load demand of the distributed electric hydrogen coupling system to be determined in three stages: day ahead, day in, and real time;
Scenario 2: Set the wind and solar output of the distributed electric hydrogen coupling system to be determined in three stages: day ahead, day in, and real time, taking into account the uncertainty of load demand in these three stages;
Scenario 3: Set the load demand of the distributed electric hydrogen coupling system to be determined in three stages: day ahead, day in, and real time, taking into account the uncertainty of wind and solar output in these three stages;
Scenario 4: Considering the wind power output and load demand of the distributed electric hydrogen coupling system simultaneously, uncertainty is determined in the three stages of day ahead, day in, and real time.
The scheduling costs of the distributed electric hydrogen coupling system in three stages under four scenarios are shown in Table 3.

TABLE 3. Scheduling cost of the distributed electric hydrogen coupling system.
From Table 3, it can be seen that among the four scenarios, scenario 1 under the deterministic scenario has the highest scheduling cost in the three stages of day ahead, day in, and real time, with a total scheduling cost of 40,289.79 yuan. Scenario 4, which simultaneously considers multiple uncertainties, has the lowest scheduling cost among the three stages, with a total scheduling cost of 35,231.9 yuan. Compared with Scenario 1, the total scheduling cost of Scenario 4 decreases by 12.55%. This is because uncertainty costs are not considered in deterministic scenarios. When there is a significant deviation between wind and solar power output and load demand, it will cause significant adjustments to the output of each unit in the day-in and real-time stages and even significantly increase the interaction cost with the external network, resulting in an increase in the overall adjustment cost. Although Scenario 2 considers the uncertainty of load, it does not consider the deviation of wind and solar output. On the one hand, when there is a significant deviation in wind and solar output, the accuracy of the unit output plan developed in the day-ahead stage is low. On the other hand, in the day-in and real-time stages, in addition to affecting the supply of electricity load, wind and solar power, as the supply end of electrolytic cells and electricity to heat transfer, will have an impact on the heat load and hydrogen load, increasing scheduling costs. Scenario 3 shows that the accuracy of load forecasting affects the scheduling of demand response. In the real-time stage, the third type of load demand invocation is mainly used. When the load deviation is large, the cost of daily adjustment increases. This indicates the necessity of considering the deviation between wind and solar output and load demand in distributed electric hydrogen coupling systems.
Furthermore, in order to explore the impact of wind and solar output deviation and load demand deviation on wind and solar consumption rate, taking the day-ahead stage as an example, the wind and solar output deviation and load demand deviation rates were set to vary in the range (−5%, 5%). The wind and solar consumption rate under different deviation rates is shown in Figure 10.
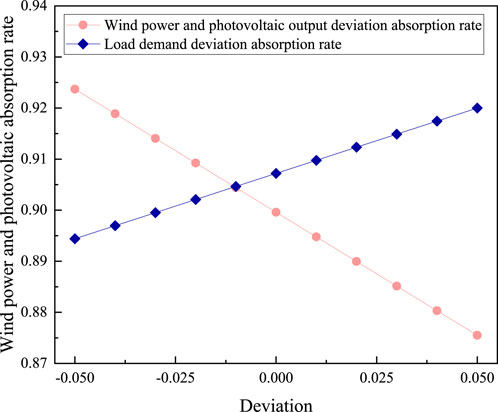
FIGURE 10. Wind power and photovoltaic absorption rates under different deviation rates.
As shown in Figure 10, when the negative deviation of wind and solar output increases in the opposite direction, the absorption rate of wind and solar energy increases. This is because when the load demand is constant and the reverse deviation rate of wind and solar energy increases, the system will fully absorb the wind and solar output, resulting in an increase in the absorption rate of wind and solar energy. When the load deviation rate increases positively, due to the increase in load demand, in order to ensure the balance of supply and demand and reduce other unit adjustments, the wind and solar output increases, resulting in an increase in the wind and solar consumption rate.
5.2.3 Effectiveness analysis of multi-timescale scheduling strategies
In order to evaluate the effectiveness of the multi-timescale optimization model proposed in this paper, effectiveness analysis that involves planning in the day-ahead stage and adjusting based on device priority in the day-in and real-time stages is demonstrated. On the one hand, it is compared with the key technologies proposed in Jin et al. (2019) in the two stages of “day-before-day–within-day”. On the other hand, it is compared with Liao et al. (2022), in which the model operates on a three-stage multi-timescale of “day-ahead–day-in–real-time” but does not consider the priority of device adjustment and the response characteristics of the device. The key technologies in Jin et al. (2019) and Liao et al. (2022) were applied to the distributed electro-hydrogen coupling system constructed in this paper. The cost and overall clean energy consumption rate of the system at different stages are shown in Table 4:
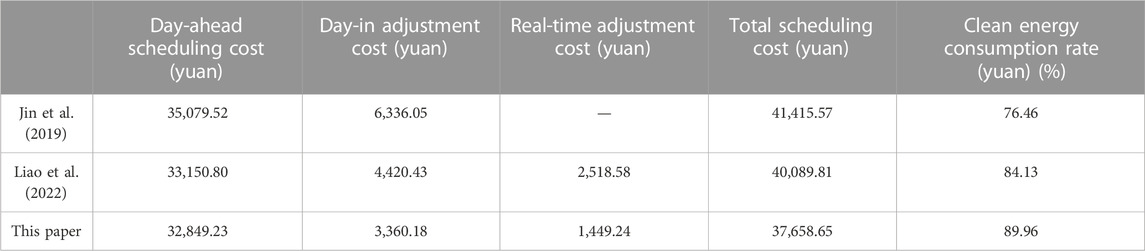
TABLE 4. Cost and overall clean energy consumption rate of the system at different stages.
It can be seen from Table 4 that although there is no real-time stage cost in Jin et al. (2019), its day-ahead scheduling cost and day-in scheduling cost are far higher than Liao et al. (2022) and the proposed method. This is because in the current stage, Jin et al. (2019) did not make further adjustments and error correction in the real-time stage, which will lead to an increase in uncertainty and deviation costs. At the same time, the clean energy consumption rate of Jin et al. (2019) is lower than that of Liao et al. (2022) and the method proposed in this article. This is because from Figure 10, it can be seen that when the wind and solar deviation reaches 5% in the positive direction, the wind and solar consumption rate decreases, and there is no real-time adjustment, which cannot fully carry out new energy consumption, resulting in a decrease in the clean energy consumption rate. From this, it can be seen that it is necessary to conduct a three-stage scheduling of “day-ahead–day-in–real time.” Compared with the method proposed in this paper, the cost difference in the day-to-day stage is not significant, but the cost in the day-in stage and the real-time stage is higher than that of the method proposed in this paper. This is because Liao et al. (2022) did not consider the level of equipment adjustment and response characteristics, which cannot achieve efficient coordination and optimization among various devices and resource allocation, resulting in an increase in cost.
5.2.4 Effectiveness analysis of scheduling timescale optimization
In order to analyze the effectiveness of scheduling timescale optimization proposed in this paper, the evaluation indicators in Li et al. (2023) were compared with those in Yuan et al. (2019) and Bao et al. (2016). The comparison indicators are the supply and demand imbalance rate
where
The supply and demand imbalance rate a, daily real-time adjustment frequency b, and adjustment proportion c of Yuan et al. (2019), Bao et al. (2016), and this paper are shown in Table 5.

TABLE 5. Evaluation indicators for scheduling timescale optimization.
From Table 5, it can be seen that compared with Bao et al. (2016), using the method proposed in this paper for scheduling time optimization can reduce the supply–demand imbalance rate and ensure the stability of energy supply in the distributed electric hydrogen coupling system. On the other hand, compared with Jin et al. (2019) and Yuan et al. (2019), the method proposed in this paper has lower frequency and proportion of adjustments in these two indicators. This is because this article considers the response characteristics of heterogeneous energy sources such as electricity and heat loads and coupled equipment, which can coordinate the slow response time of heat loads and coupled equipment, as well as the fast response characteristics of wind, electricity loads, and hydrogen storage tanks. Therefore, the scheduling duration optimization method proposed in this article can simultaneously balance the dual optimization strategy of adjusting costs and energy supply stability.
6 Conclusion
This paper conducts a study on the optimization of multi-timescale operation of distributed electro-hydrogen coupling systems considering multiple uncertainties. Through case analysis, the following conclusions are drawn:
(1) It is necessary to consider the deviation between wind and solar output and load demand in a distributed electric hydrogen coupling system, and it can reduce the total scheduling cost by 12.55% compared to deterministic scenarios.
(2) The three-stage scheduling optimization strategy proposed in this article, which considers the level of equipment adjustment and response characteristics, can achieve efficient coordination and optimization among various devices, optimize resource allocation, and improve the consumption rate of clean energy.
(3) The scheduling duration optimization method proposed in this article is a dual optimization strategy that simultaneously considers adjustment costs and energy supply stability.
Data availability statement
The original contributions presented in the study are included in the article/Supplementary Material; further inquiries can be directed to the corresponding author.
Author contributions
SMa: visualization and writing—review and editing; SMe: validation; LY: supervision and project administration. All authors contributed to the article and approved the submitted version.
Acknowledgments
The authors would like to express their gratitude to the Technology Project of Guangdong Power Grid Co., Ltd., for their support.
Conflict of interest
Authors SMa and SMe were employed by Guangdong Power Grid Co., Ltd. LY was employed by Dongguan Power Supply Bureau of Guangdong Power Grid Co., Ltd.
Publisher’s note
All claims expressed in this article are solely those of the authors and do not necessarily represent those of their affiliated organizations, or those of the publisher, the editors, and the reviewers. Any product that may be evaluated in this article, or claim that may be made by its manufacturer, is not guaranteed or endorsed by the publisher.
References
Bai, B., Han, M. L., and Lin, J., (2021). Renewable energy scenario reduction method including wind power and photovoltaic. Power Syst. Prot. Control 49 (15), 141–149.
Bao, Y. Q., Wang, B. B., and Li, Y., (2016). Rolling scheduling model considering large-scale wind power access and considering multi time scale demand response resource coordination and optimization. Proc. CSEE 36 (17), 4589–4600.
Cui, Y., Guo, F. Y., and Zhong, W. Z., (2022). Interval multi-objective optimal scheduling of integrated energy system under multiple uncertainties. Power Syst. Technol. 46 (8), 2964–2975.
Gorre, J., Ruoss, F., Karjunen, H., Schaffert, J., and Tynjälä, T. (2020). Cost benefits of optimizing hydrogen storage and methanation capacities for Power-to-Gas plants in dynamic operation. Appl. Energy 257 (257), 113967. doi:10.1016/j.apenergy.2019.113967
Han, L., Lu, P. P., and Wang, X. J., (2022). Intra day optimal dispatch of Power Grid Considering the response delay characteristics of hydrogen fuel cells. Acta Energiae Solaris Sin. 43 (6), 373–381.
Hou, H., Liu, P., Huang, L., Zhou, J., and Qian, G. (2021). A review on fabricating functional materials by heavy metal-containing sludges. Trans. China Electrotech. Soc. 36 (S1), 133–155. doi:10.1007/s11356-020-10990-y
Jiang, T., Zhou, H. J., and Zhou, W. R., (2022). Study on Optimization of regional integrated energy system considering the configuration and operation of gas-fired heat pump. Zhejiang Electr. Power 41 (3), 42–53.
Jin, X. L., Mu, Y. F., and Jia, H. J., (2019). Multi time scale model predictive scheduling method for micro network system integrating intelligent buildings. Automation Electr. Power Syst. 43 (16), 25–33.
Li, P., Jiang, Z. W., Deng, Y. F., Zhan, X., Fu, Y., Gui, G., et al. (2022a). Edaravone activates the GDNF/RET neurotrophic signaling pathway and protects mRNA-induced motor neurons from iPS cells. Zhejiang Electr. Power 41 (6), 8–14. doi:10.1186/s13024-021-00510-y
Li, R., Sun, F., and Li, H. L., (2020). Hybrid time scale economic scheduling of user level integrated energy systems considering differences in energy characteristics. Power Syst. Technol. 44 (10), 3615–3624.
Li, R. Z., Yan, X. H., and Liu, N. (2022b). Hybrid energy sharing considering network cost for prosumers in integrated energy systems. Appl. Energy 323, 119627. doi:10.1016/j.apenergy.2022.119627
Li, T. G., Hu, Z. J., and Chen, Z., (2023). Multi time scale low carbon operation optimization strategy of integrated energy system considering the demand response of electricity gas heat hydrogen. Electr. Power Autom. Equipmen 43 (1), 16–24.
Liao, Y. H., Chen, J., and Yang, Y. F., (2022). Optimal scheduling of virtual power plants with p2g and optical thermal power stations considering the comprehensive and flexible operation of carbon capture power plants. Electr. Power Constr. 43 (4), 20–27.
Liu, Y. J., Fan, Y. F., and Hao, J. W., (2022). Capacity allocation and scheduling optimization of wind solar hydrogen thermal virtual power plant based on wide power adaptation model of alkaline electrolyzer. Power Syst. Prot. Control 50 (10), 48–60.
Lu, B. W., Wei, Z. B., and Wei, P. A., (2022). Bi level optimal allocation of user side integrated energy system considering multiple interval uncertainties. Electr. Power 55 (3), 193–202.
Pan, C. C., Hou, X. W., and Jin, T., (2022). Low carbon research on integrated energy system taking into account stepped carbon trading and renewable energy uncertainty. Electr. Meas. Instrum., 1–12.
Ren, D. W., Xiao, J. Y., and Hou, J. M., (2022). Research on the construction and evolution of China's new power system under the dual carbon goal. Power Syst. Technol. 46 (10), 3831–3839.
Song, Y. G., Xia, M. C., Yang, L., Chen, Q., and Su, S. (2023). Multi-granularity source-load-storage cooperative dispatch based on combined robust optimization and stochastic optimization for a highway service area micro-energy grid. Renew. Energy 205, 747–762. doi:10.1016/j.renene.2023.02.006
Tan, C. X., Wang, J., Geng, S. P., and Tan, Z. (2021). Three-level market optimization model of virtual power plant with carbon capture equipment considering copula–CVaR theory. Energy 237, 121620. doi:10.1016/j.energy.2021.121620
Wang, Z., Tao, H. J., and Zhang, L. (2022). Research on multi time scale rolling optimal operation method of CCHP system. J. Chin. Soc. Power Eng. 42 (03), 276–285.
Xu, Y. Y., Liao, Q. F., and Liu, D. C., (2019). Multi agent intra day optimal scheduling of regional integrated energy system based on comprehensive demand response and game. Power Syst. Technol. 43 (07), 2506–2518.
Yuan, Q., Wu, Y. L., and Li, B., (2019). Multi time scale rolling scheduling model and method considering source load uncertainty. Power Syst. Prot. Control 47 (16), 8–16.
Zhai, J. J., Wu, X. B., and Fu, Z. X., (2020). Robust optimization of integrated energy system considering demand response and photovoltaic uncertainty. Electr. Power 53 (8), 9–18.
Zhang, C., Tan, Z. Y., and Chao, H. P. (2022a). Feasibility study on hydrogen energy application in data center under the background of "double carbon". Acta Energiae Solaris Sin. 43 (6), 327–334.
Zhang, X., Pei, W., and Mei, C. X., (2022b). Fuzzy power allocation strategy and coordinated control method for island DC microgrid with electric/hydrogen composite energy storage system. High. Volt. Eng. 48 (3), 958–968.
Zhao, J., Yong, J., and Xun, J. J., (2020). Stochastic planning of park integrated energy system based on long time scale. Electr. Power Autom. Equip. 40 (03), 62–67.
Nomenclature
Keywords: multiple uncertainties, electro-hydrogen coupling, multi-timescale, operational optimization, grid interaction
Citation: Ma S, Mei S and Yu L (2023) Research on multi-timescale operation optimization of a distributed electro-hydrogen coupling system considering grid interaction. Front. Energy Res. 11:1251231. doi: 10.3389/fenrg.2023.1251231
Received: 01 July 2023; Accepted: 28 August 2023;
Published: 14 September 2023.
Edited by:
Shenbo Yang, Beijing University of Technology, ChinaReviewed by:
Xiaobao Yu, Shanghai University of Electric Power, ChinaShiping Geng, North China Electric Power University, China
Copyright © 2023 Ma, Mei and Yu. This is an open-access article distributed under the terms of the Creative Commons Attribution License (CC BY). The use, distribution or reproduction in other forums is permitted, provided the original author(s) and the copyright owner(s) are credited and that the original publication in this journal is cited, in accordance with accepted academic practice. No use, distribution or reproduction is permitted which does not comply with these terms.
*Correspondence: Shun Ma, MTU1NzM4MDU5NDlAMTYzLmNvbQ==