 Jing Bian
 Liqiang Duan*
- Key Laboratory of Power Station Energy Transfer Conversion and System, School of Energy, Power and Mechanical Engineering, North China Electric Power University, Beijing, China
In this paper, two new molten carbonate fuel cell (MCFC)-integrated gas–steam combined cycle (GSCC) systems with selective exhaust gas recirculation (SEGR) and CO2 capture are proposed and analyzed. The CO2 concentration in the gas turbine emission is increased because CO2 is selectively recycled with the help of SEGR. Molten carbonate fuel cells (MCFCs) are another way to increase CO2 concentration in the gas turbine flue gas by translating only CO2 from the cathode to the anode. In these two new gas–steam combined cycle systems, SEGR connected with MCFC, either in parallel or series, increases CO2 concentration beyond 11%. A gas–steam combined cycle system combined with MCFC and CO2 capture without SEGR is used as the reference system. Aspen Plus software is adopted to build the system models, and the performances of different systems are discussed and compared. The research results reveal that for the MCFC-integrated gas–steam combined cycle system with SEGR in series and CO2 capture, the CO2 concentration of gas turbine exhaust increases to 11.72% and the thermal efficiency is 56.29% when the overall CO2 capture rate is 88.16%, which is 1.13% higher than that of the reference system; for the MCFC-integrated gas–steam combined cycle system with SEGR in parallel and CO2 capture, the CO2 concentration of gas turbine exhaust increases to 14.15% and the thermal efficiency is 56.62%, which is 1.46% higher than that of the reference system. Furthermore, the economic analysis results show that the economic performances of new systems are mainly influenced by MCFC cost and will be gradually improved with the decrease in the MCFC cost.
1 Introduction
The topic of CO2 emission is attracting considerable attention with the rise in global warming, which poses a severe hazard to human health and survival. Total CO2 discharge in China has increased from 9.122 billion tons (2011) to 9.912 billion tons (2020) (Miao et al., 2022). CO2 emissions are mainly generated from fossil fuel-fired power systems, such as coal-fired power generation systems and gas–steam combined cycle (GSCC) systems. Although the gas–steam combined cycle has high efficiency, capturing CO2 from the GSCC system is still a focus of attention in various countries since natural gas is usually applied as a fuel and still emits a large amount of CO2. The F-class gas turbine (GT) is widely applied (Tsukagoshi et al., 2007), and its turbine inlet temperature can reach up to 1,400°C (ElKady et al., 2009). Choi et al. (2014) found that using the F-class GT, for the GSCC system integrated with a solid oxide fuel cell (SOFC), without carbon capture, the efficiency reaches almost 70%.
Conventional CO2 capture methods usually result in a significant decrease in efficiency and output power. Compared with the conventional CO2 capture techniques, MCFC has special advantages of increasing the efficiency of the entire system. CO2 and O2 from the GT exhaust gas can form carbonate ions in the cathode of MCFC, which are carried to the anode by the molten electrolyte of MCFC. After the carbonate ions react with fuels such as CH4 or H2, H2O and CO2 are generated at the anode; therefore, after the combustion of anode flue gas and pure O2 in the afterburner, only CO2 and H2O are left. The MCFC has higher efficiency and lower cost than the phosphoric acid fuel cell (PAFC) and a more simple structure than the SOFC (Zhao and Hou, 2022). Carapellucci et al. (2019) compared the systems of the steam power plant (SPP) combined with MCFC and the SPP combined with the monoethanolamine (MEA) method. The results showed that the system of SPP combined with MCFC had a higher overall efficiency and CO2 removal capacity.
Selective exhaust gas recirculation (SEGR) is a type of technique to recycle CO2 from GT flue gas with membranes to increase the CO2 concentration
Even though both the methods of MCFC and SEGR can enrich CO2 with less energy consumption compared with the conventional CO2 capture methods, there are still limitations to using either MCFC or SEGR alone. When MCFC is adopted alone, Milewski et al. (2013) verified with experiments that the performance of MCFC was deeply limited by the
To reduce CO2 emission with less energy consumption and increase the whole system performance, two GSCC systems combined with MCFC, SEGR, and CO2 capture are proposed in this work. The SEGR operating in parallel with the GSCC system combined with MCFC is investigated in the first system; in the second system, the SEGR operating in series with the GSCC system integrated into MCFC is investigated. The thermal and economic performances of different systems are discussed and compared. The effects of the SEGR ratio and the CO2 capture rate on the thermal efficiency and economic performance of new systems are examined.
2 Description of different systems
2.1 GSCC system integrated into MCFC and CO2 capture (reference system)
In this study, the GSCC system combined with MCFC and CO2 capture without SEGR is selected as the reference system, and the system flowchart is shown in Figure 1. After passing through compressor 1, the fuel (2) is supplied to the combustor. After passing through compressor 2, the air (3) is separated into compressed air (4) and (6). Compressed air (4) is supplied into the combustor; compressed air (6) is transferred into the GT as the coolant gas. The combustion chamber emission expands in the gas turbine to produce electricity, and the gas turbine flue gas is then transferred to the MCFC cathode. A portion of the anode flue gas (15) is sent to the pre-reformer to convert the fuel into H2 and CO in order to prevent the carbon deposition problem (Duan et al., 2014). After being transported from the cathode, the carbonate ions react with H2 in the anode and produce H2O and CO2 (Milewski et al., 2013). The cathode flue gas (9) has low
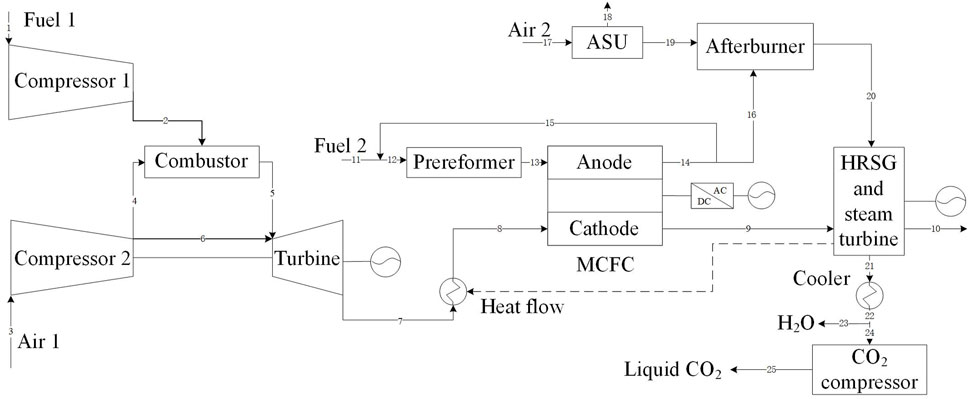
FIGURE 1. Flowchart of the GSCC system combined with MCFC and CO2 capture without flue gas recirculation.
2.2 MCFC-integrated GSCC system with SEGR in parallel and CO2 capture
The simplified flowchart of the MCFC-integrated GSCC system with SEGR in parallel and CO2 capture is shown in Figure 2. The GT exhaust gas (8) is separated into two parts: (9) and (13). After being heated by the afterburner flue gas to 923.15 K (Duan et al., 2014), the flue gas (9) is transferred to the MCFC cathode. After being cooled in the HRSG and further cooled in cooler 1 to 353.15 K, exhaust gas (13) is supplied into the condenser to remove H2O (15). Then, the water-excluded flue gas (17) is blown into the selective CO2 transfer system. The air mixed with CO2 selected by the membranes is then compressed in compressor 2.
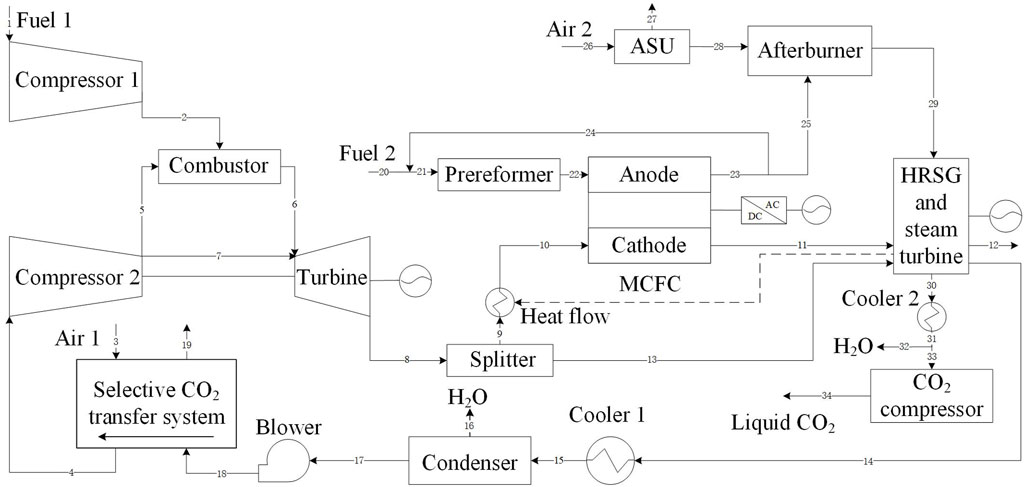
FIGURE 2. Flowchart of the MCFC-integrated GSCC system with SEGR in parallel and CO2 capture.
2.3 MCFC-integrated GSCC system with SEGR in series and CO2 capture
Figure 3 shows a simplified flowchart of the MCFC-integrated GSCC system with SEGR in series and CO2 capture. The GT flue gas (11) is cooled in HRSG and further cooled in cooler 1 to a temperature of 303.15 K. Then, the water-excluded flue gas (14) is blown into the selective CO2 transfer system. The sweep air 1 (3) is transferred to the selective CO2 transfer system.
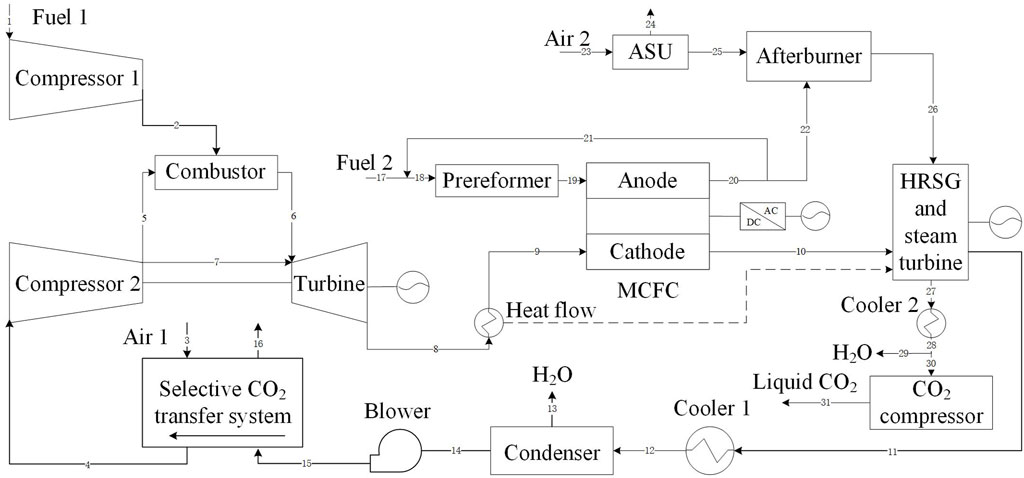
FIGURE 3. Flowchart of the MCFC-integrated GSCC system with SEGR in series and CO2 capture.
3 System modeling
Aspen Plus software is adopted to establish the simulation models. In brief, the MCFC is simulated using a Fortran code, and the selective CO2 transfer system is modeled using Aspen Custom Modeler. The new system parameters are obtained as shown in Table 1. During the establishment of the models, the suppositions to be considered are as follows (Bian et al., 2022):
1) Thermally insulated MCFC, and no entropy flow to the outside environment.
2) Constant membrane permeability, and the coupling impact is ignored.
3) Kinetic or potential energy effects are ignored.
4) Incompressible ideal gas and steady-state conditions are supposed.
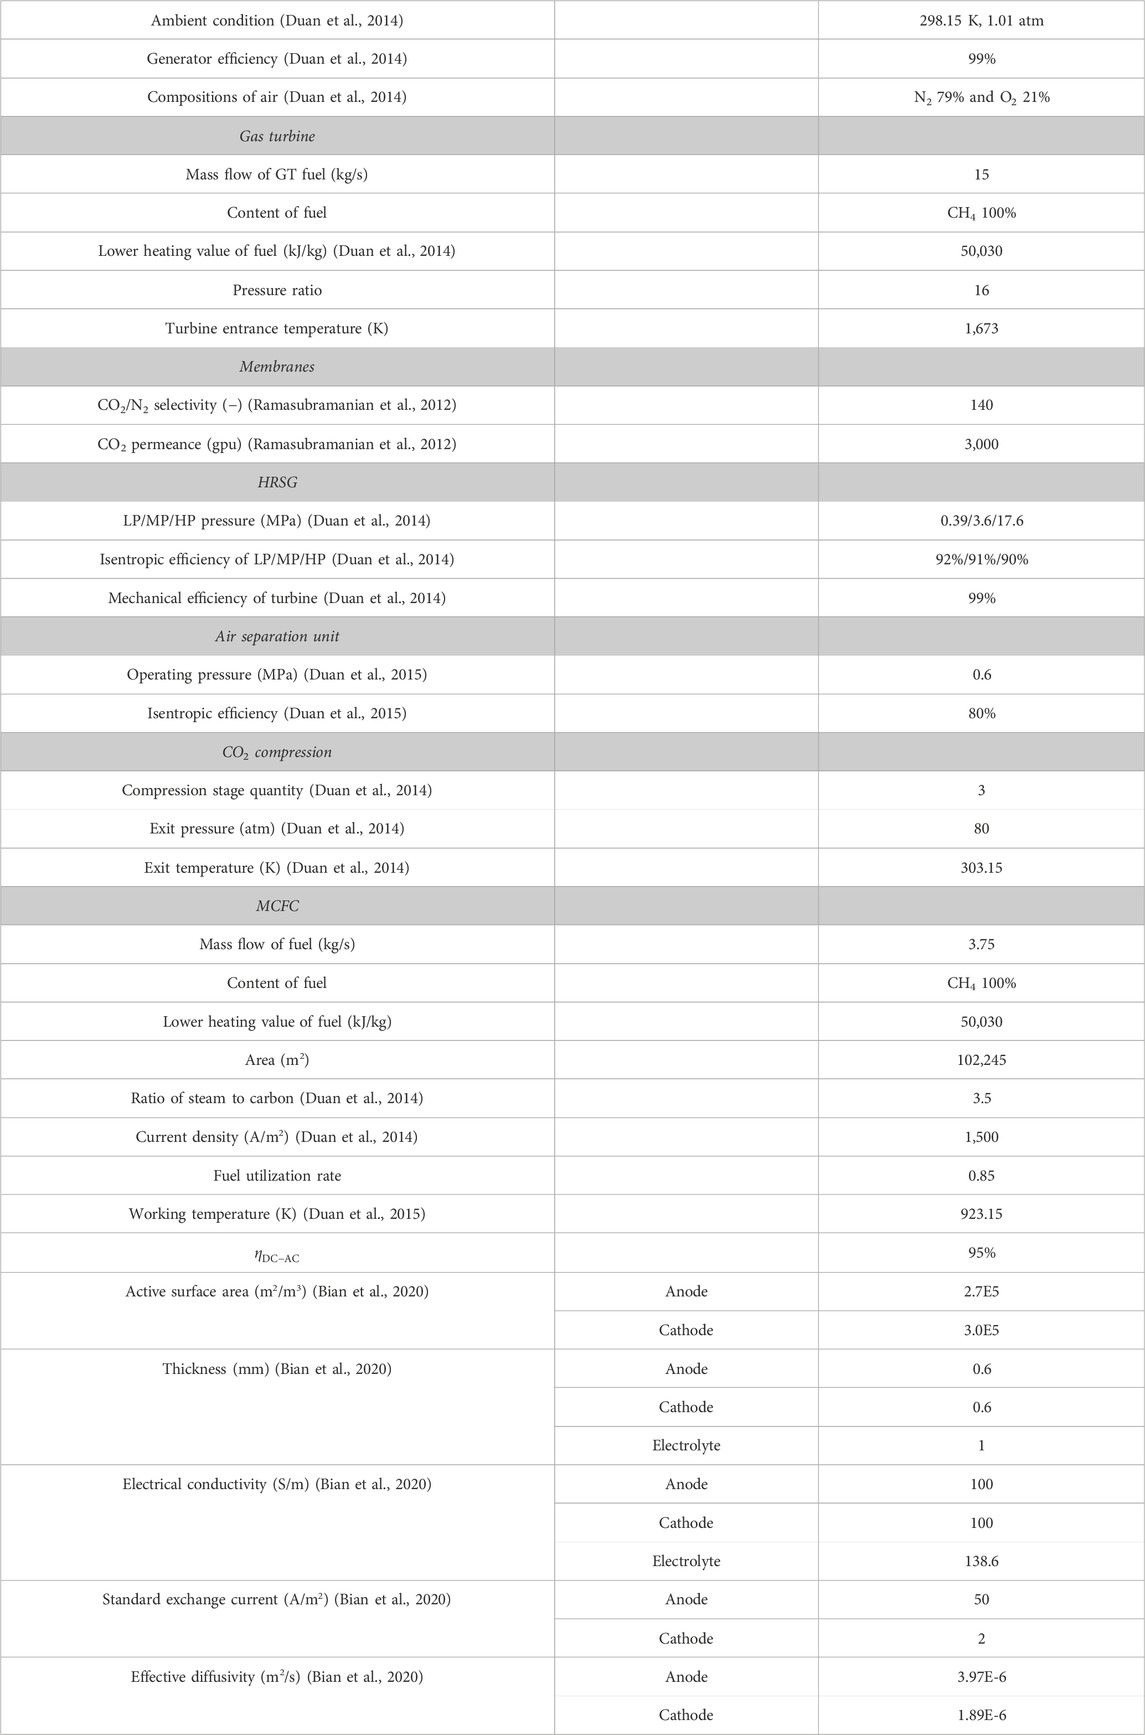
TABLE 1. System simulation parameters.
The main equations of the MCFC model used in the Fortran code are listed in Table 2 (Eqs 1–25). To guarantee that the afterburner combustion gas contains only CO2 and H2O, the MCFC anode is supplied with pure CH4. In Eq. 5,
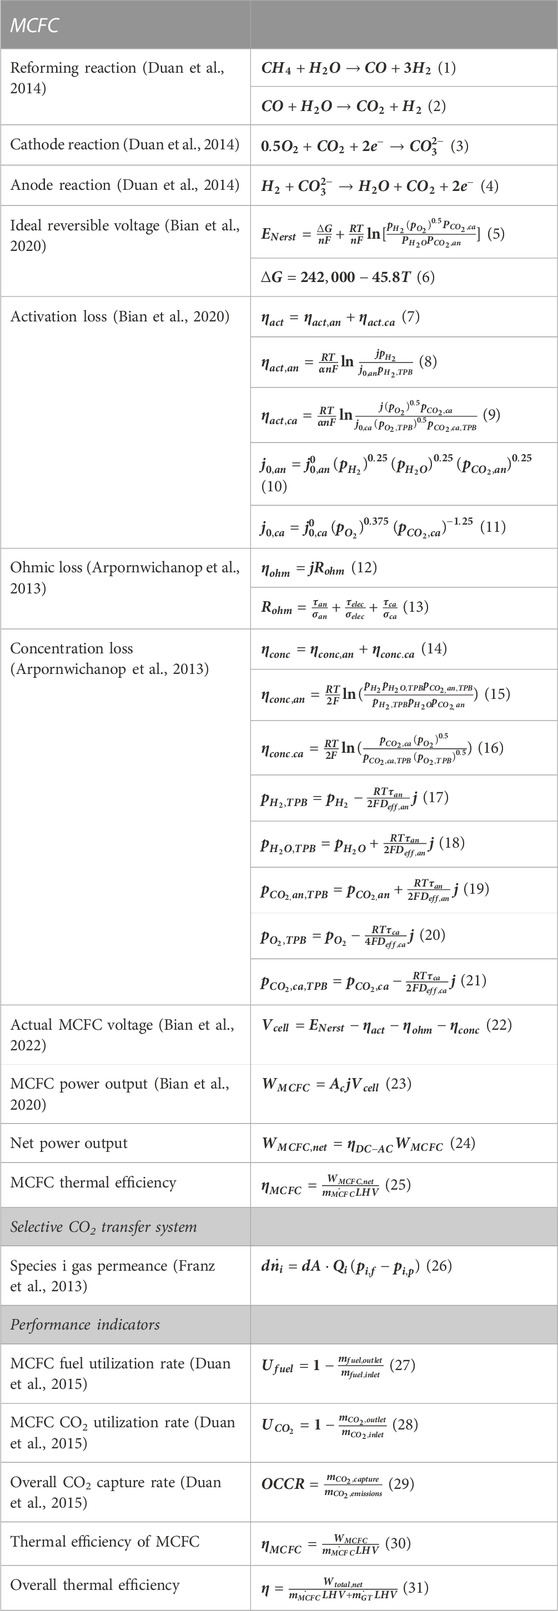
TABLE 2. Main reaction equations.
The gas permeance equations are listed in Table 2 (Eq. 26). The selective CO2 transfer system is arranged as counter-current.
4 Model validation with experimentation
4.1 Gas turbine system model validation with literature data
The GT system model is validated with the data from Choi et al. (2014). In the literature, an F-class GSCC system with SOFC is studied. The specifications of the two GSCC systems are shown in Table 3. The simulated data are in excellent agreement with the literature data.
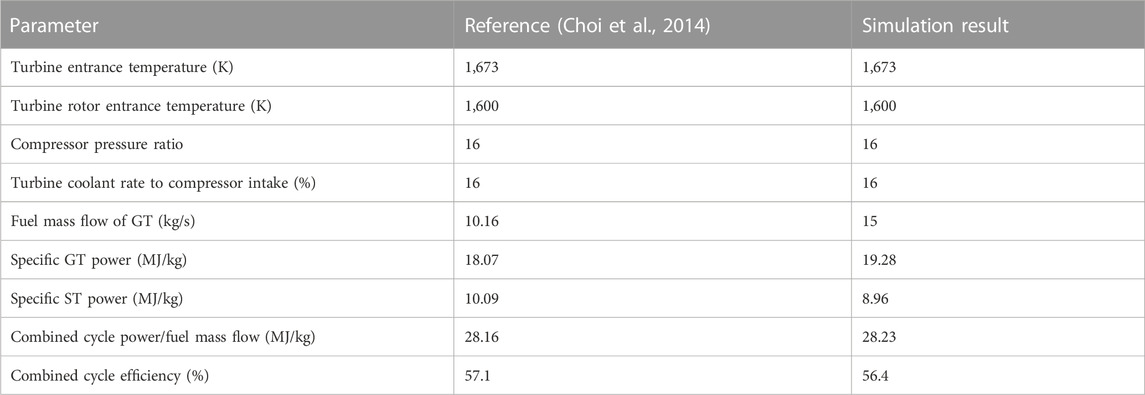
TABLE 3. GSCC specifications.
4.2 MCFC model validation using experiments
The model accuracy is validated using unit MCFC cell equipment, as shown in Figure 4A. The unit fuel cell includes a porous anode of Ni/Cr alloy, a porous cathode of NiO, and an electrolyte matrix filled with the combination of 62% Li2CO3 and 38% K2CO3. The experimental device consists of a temperature control facility, a gas flow control facility, and the unit fuel cell. The operating temperature is 650°C under atmospheric conditions. The electrochemical workstation is applied to set and measure the current density and voltage. The simulation and actual voltage values at different
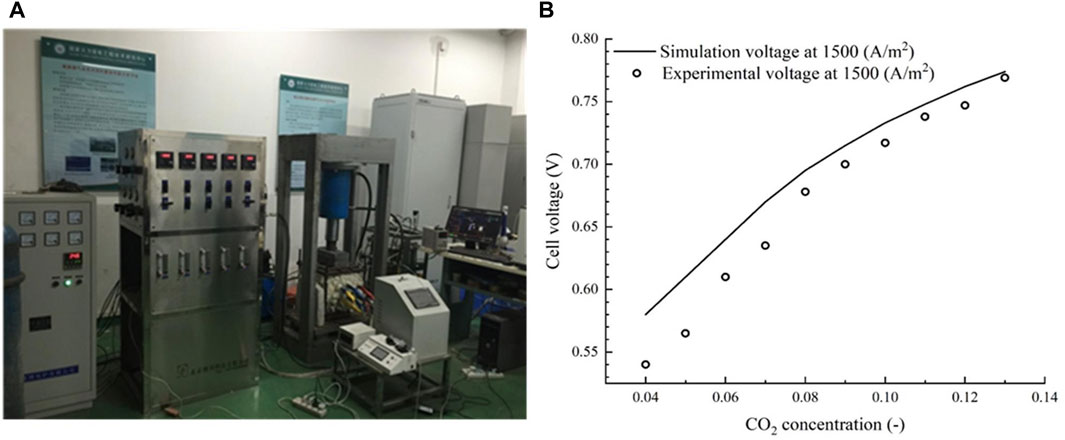
FIGURE 4. (A) Unit MCFC cell facility and (B) simulation and test voltages under various
5 Results and discussion
In this section, results of the models with SEGR in parallel and series are discussed and compared with the reference system.
5.1 MCFC-integrated GSCC system with SEGR in parallel and CO2 capture
The flowchart of an MCFC-integrated GSCC system with SEGR in parallel and CO2 capture is shown in Figure 2. One part of the exhaust gas regenerated by the HRSG is supplied to the selective CO2 transfer system. CO2 is passed through membranes selectively and then supplied to the compressor with the sweep air.
Figure 5A shows the variations in the MCFC CO2 utilization rate that is demanded to capture 88.16% of CO2 produced by the combustion as a function of the SEGR for different selective CO2 transfer rates (SCTRs). For a constant SCTR, the MCFC CO2 utilization rate rises at a higher recirculation rate. This is because the CO2 discharged by the selective CO2 transfer system increases with the increase in the recirculation rate since the
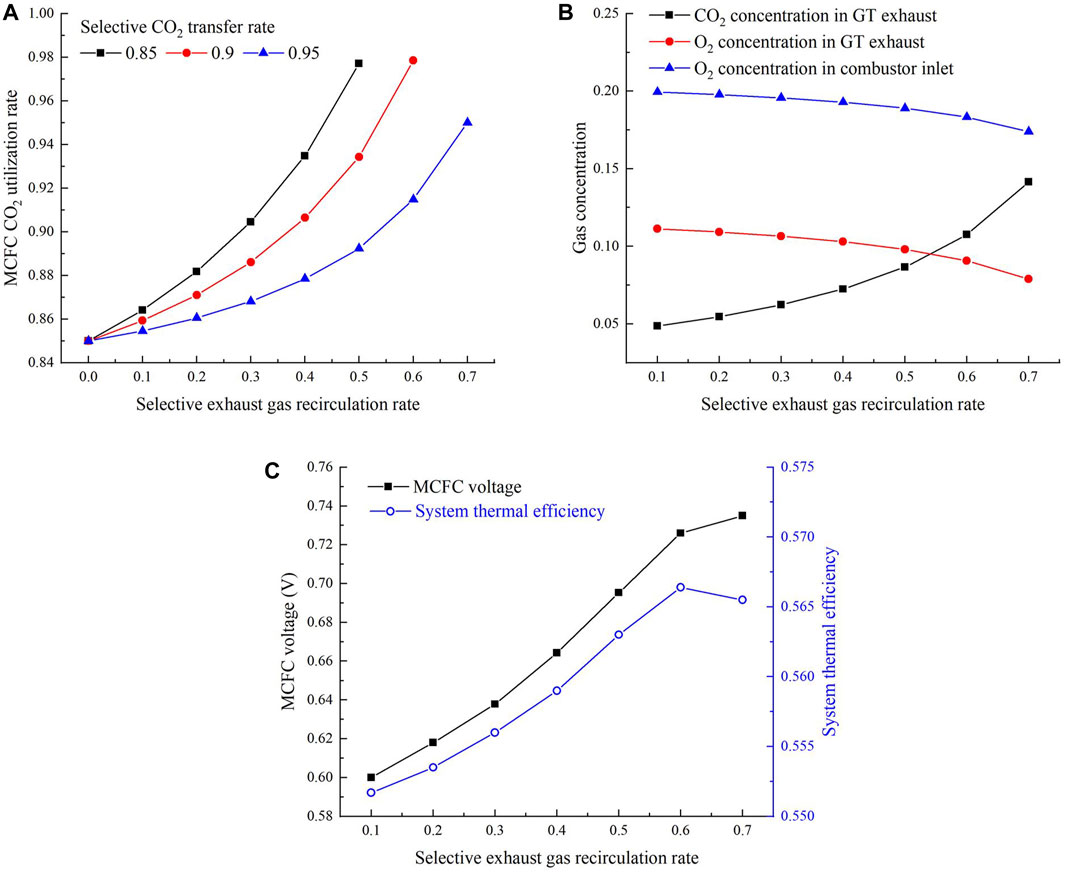
FIGURE 5. Impact of the SEGR on (A)
When the SCTR is held constant at 0.95 and the selective exhaust gas recirculation rate is increased from 0 to 0.7, the mass flow rate of sweep air decreases. The reason is that the turbine entrance temperature should be kept invariable. Therefore, the
When the SCTR is held constant at 0.95 and the selective exhaust gas recirculation rate is raised from 0 to 0.7, the
5.2 MCFC-integrated GSCC system with SEGR in series and CO2 capture
The flowchart of the MCFC-integrated GSCC system with SEGR in series and CO2 capture is illustrated in Figure 3. After CO2 is excluded by MCFC, the emission of GT is supplied to the selective CO2 transfer system.
Figure 6A shows the changes in the MCFC CO2 utilization rate required to capture 88.16% of CO2 as a function of SCTRs. The more the CO2 conveyed to the combustion air, the less the CO2 utilization rate demanded by the MCFC.
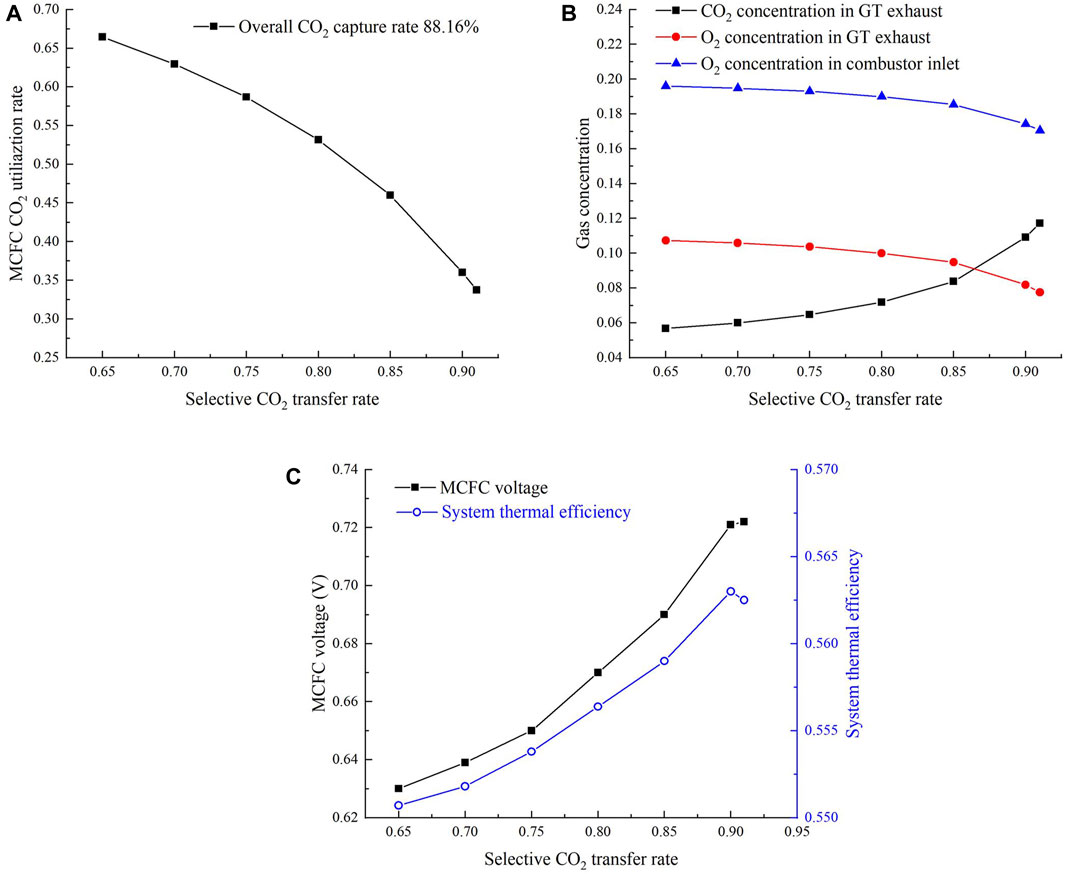
FIGURE 6. Impact of SCTR on (A)
When the SCTR increases from 0.65 to 0.91, the mass flow of sweep air (air 1) decreases to maintain the turbine entrance temperature constant; therefore, the
When the SCTR increases from 0.65 to 0.91, the MCFC voltage is mainly regulated by the
5.3 Comparison of the results for different systems
The major operating parameters of the MCFC voltage and GSCC system for SEGR in series and parallel with MCFC are shown in Table 4. Parallel 96/90 denotes that the new system with SEGR in parallel operates with a 0.96 CO2 utilization rate of MCFC and 0.9 SCTR of the membrane. Series 91/28, 90/36, and 85/46 denote that the new system with SEGR in series operates with MCFC CO2 utilization rates of 0.91, 0.9, and 0.85 and membrane SCTRs of 0.28, 0.36, and 0.46, respectively. An MCFC-integrated GSCC system with CO2 capture and without SEGR is considered the reference system. The current density and the area of MCFC are held constant. The key stream data of different systems are shown in Table 4. The data on the streams from parallel 96/90 and series 90/36 are shown in detail in the Supplementary Material. The power and thermal efficiency of different systems are listed in Table 4. Compared with the reference system, there is an increase in the entire thermal efficiencies of the systems with SEGR in parallel and series. The efficiency of the parallel 96/90 system is greater than that of the series 90/36 system.
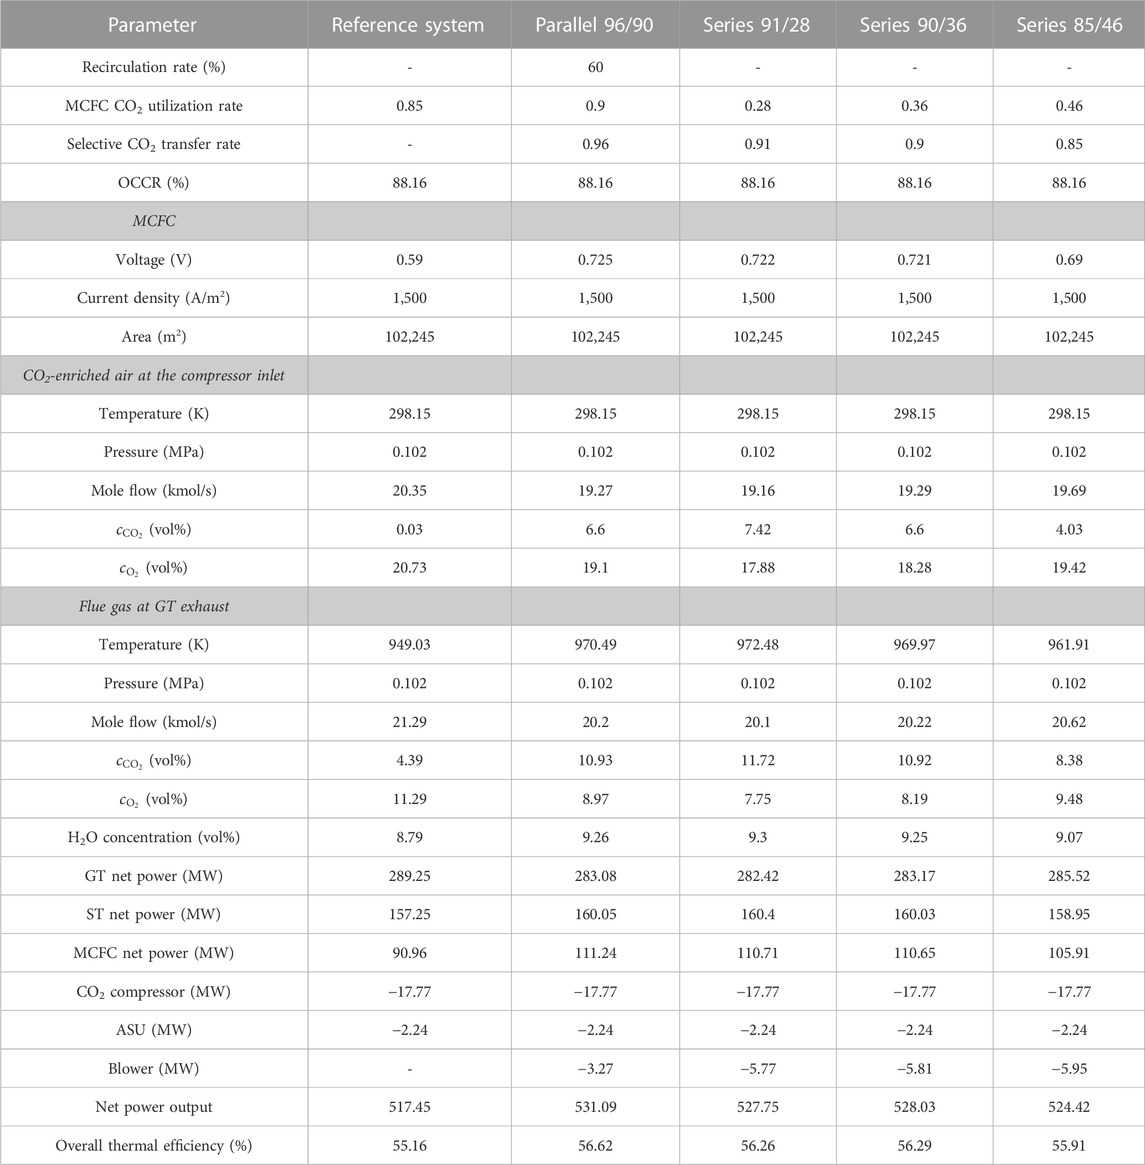
TABLE 4. Parameters of the investigated configurations.
Figure 7A indicates the air mole flow rate at the compressor entrance and the GT net output. In contrast to the reference system, with the increase in the selective flue gas recirculation, to keep the GT inlet temperature constant at 1400°C, the air into the selective CO2 transfer system decreases. Therefore, the air mole flow rate at the compressor inlet decreases, which results in the decrease in the GT output power, which is in contrast to the reference case. When the SCTR of the GSCC system with SEGR in series is reduced from 0.91 to 0.85, the air mole flow rate at the compressor entrance increases and so is the GT net power. The GT exhaust gas mole flow rate is regulated by the air mole flow rate at the compressor entrance, and the net power consumed by the blower is affected by the GT exhaust gas mole flow rate, as shown in Figure 7B.
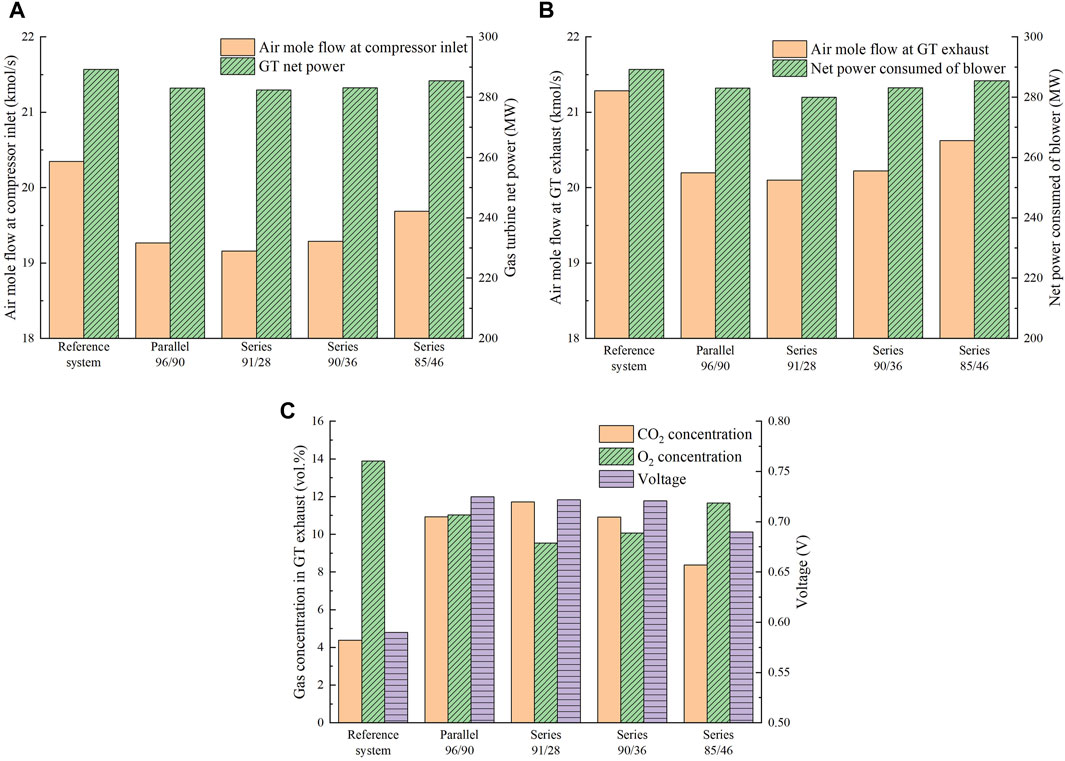
FIGURE 7. (A) Air mole flow at the compressor inlet and GT net power output. (B) GT exhaust gas mole flow and net power consumed by the blower. (C) CO2/O2 concentration in the GT exhaust and MCFC voltage for the GSCC system with SEGR in parallel and in series, which is in contrast to the reference system.
Figure 7C shows the comparison of
6 Economic and environmental performance evaluation
In this section, the economic and environmental performances of new systems are compared with those of the reference system.
The principal economic criteria used to assess various CO2 capture methods are the specific primary energy consumption for CO2 avoided (SPECCA) and the cost of CO2 avoided (CCA). The equations for cost estimation are listed in Table 5. For the power section,
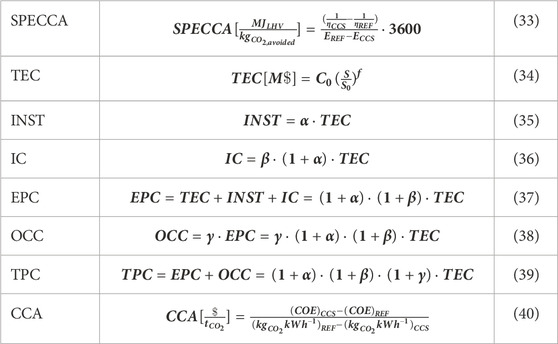
TABLE 5. Equations for cost estimation.
Table 6 shows the comparison results of the economic evaluation. Contrast to the CCA of the conventional MEA technique for CO2 capture (Leto et al., 2011), the overall thermal efficiency of the parallel 96/90 system in this paper is higher, which results in a negative SPECCA index. Figure 8A shows the thermodynamic performance (SPECCA) of the systems investigated. The cost per kW MCFC is fixed at 555 $/kW (Gatti et al., 2020). Over the last 20 years, the MCFC cost has been reduced significantly (Campanari et al., 2014), and further decrease exists according to DOE targets (Spendelow et al., 2012). The investment lifetime is 25 years, the fuel cost is 4.5$/GJ, and the equivalent hours at full load is 7880 h per year (Gatti et al., 2020). In Figure 8B, CCA is displayed as a function of the specific TPC ($/kW). The closer the system is to the bottom left corner, the more attractive it is because it represents lower operating and specific investment costs.
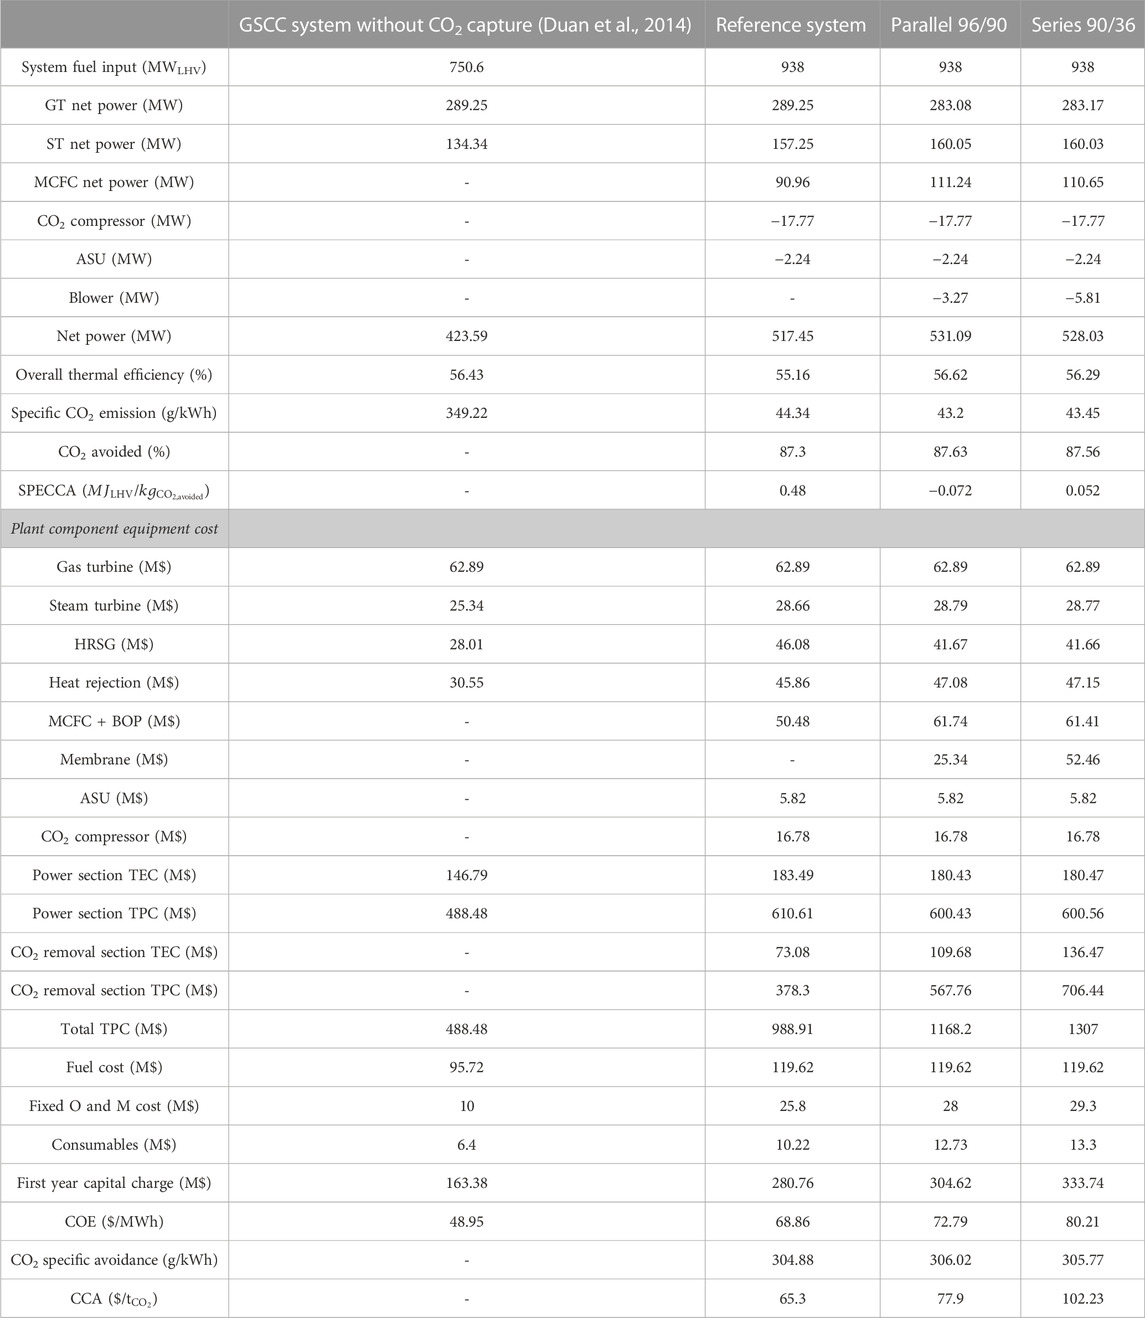
TABLE 6. Economic performance evaluation results of investigated systems.
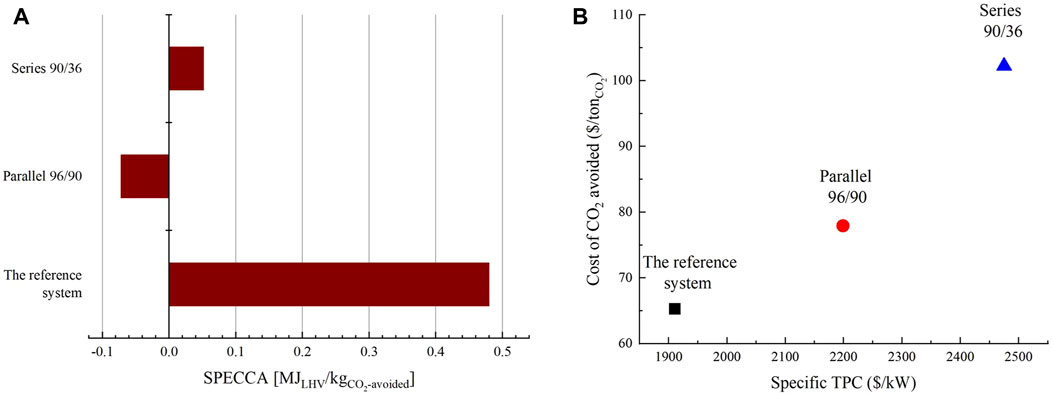
FIGURE 8. (A) SPECCA of the different systems and (B) CCA vs. specific TPC.
7 Conclusion
In this paper, the MCFC-integrated GSCC systems with CO2 capture and SEGR in series/parallel are investigated and contrasted with the MCFC-integrated GSCC system with CO2 capture and without SEGR (the reference case). The results show that the new systems markedly increase the
1) For the systems with SEGR in parallel, the OCCR is held constant at 88.16%. As the SEGR increases and the SCTR remains unchanged, the MCFC CO2 utilization rate increases; when SEGR is kept unchanged and SCTR increases, the MCFC CO2 utilization rate decreases. When the SEGR increases from 0.1 to 0.7 and the SCTR is held constant at 0.95, the
2) For the systems with SEGR in series, the OCCR is held constant at 88.16%; when the SCTR increases from 0.65 to 0.91, the MCFC CO2 utilization rate is reduced from 0.66 to 0.34. When the SCTR increases from 0.65 to 0.91, the
3) When the CO2 utilization rate of the MCFC is 0.96 and the SCTR of the membrane is 0.90, the new system with SEGR in parallel exhibits a better economic and environmental performance.
Because of the high cost of the MCFC at present, the new system does not have significant advantages in terms of technical or economic performance. The advantage of the MCFC-based CO2 capture system, as well as forthcoming technological improvements, will contribute to advancing its economic performance.
Data availability statement
The original contributions presented in the study are included in the article/Supplementary Material; further inquiries can be directed to the corresponding author.
Author contributions
JB: Conceptualization, Data curation, Investigation, Methodology, Software, Writing–original draft. LD: Project administration, Supervision, Writing–review and editing.
Funding
The author(s) declare that financial support was received for the research, authorship, and/or publication of this article. This work was supported by the National Nature Science Foundation Project of China (No. 52076078) and the Science Fund for Creative Research Groups of the National Natural Science Foundation of China (No. 51821004).
Conflict of interest
The authors declare that the research was conducted in the absence of any commercial or financial relationships that could be construed as a potential conflict of interest.
Publisher’s note
All claims expressed in this article are solely those of the authors and do not necessarily represent those of their affiliated organizations, or those of the publisher, the editors, and the reviewers. Any product that may be evaluated in this article, or claim that may be made by its manufacturer, is not guaranteed or endorsed by the publisher.
Supplementary material
The Supplementary Material for this article can be found online at: https://www.frontiersin.org/articles/10.3389/fenrg.2023.1256000/full#supplementary-material
References
Arpornwichanop, A., Saebea, D., Patcharavorachot, Y., et al. (2013). Analysis of a pressurized solid oxide fuel cell-gas turbine hybrid power system with cathode gas recirculation. Int. J. hydrogen energy 38, 4748–4759. doi:10.1016/j.ijhydene.2013.01.146
Bellas, J. M., Finney, K. N., Diego, M. E., Ingham, D., and Pourkashanian, M. (2019). Experimental investigation of the impacts of selective exhaust gas recirculation on a micro gas turbine. Int. J. Greenh. Gas Control 90, 102809. doi:10.1016/j.ijggc.2019.102809
Bian, J., Duan, L., Lei, J., and Yang, Y. (2020). Study on the entropy generation distribution characteristics of molten carbonate fuel cell system under different CO2 enrichment conditions. Energies 13, 5778. doi:10.3390/en13215778
Bian, J., Zhang, H., Duan, L., Desideri, U., and Yang, Y. (2022). Study of an integrated gas turbine -Molten carbonate fuel cell -organic Rankine cycle system with CO2 recovery. Appl. Energy 323, 119620. doi:10.1016/j.apenergy.2022.119620
Campanari, S., Chiesa, P., Manzolini, G., and Bedogni, S. (2014). Economic analysis of CO2 capture from natural gas combined cycles using molten carbonate fuel cells. Appl. Energy 130, 562–573. doi:10.1016/j.apenergy.2014.04.011
Carapellucci, R., Battista, D. D., and Cipollone, R. (2019). The retrofitting of a coal-fired subcritical steam power plant for carbon dioxide capture: a comparison between MCFC-based active systems and conventional MEA. Energy Convers. Manag. 194, 124–139. doi:10.1016/j.enconman.2019.04.077
Choi, J. H., Ahn, J. H., and Kim, T. S. (2014). Performance of a triple power generation cycle combining gas/steam turbine combined cycle and solid oxide fuel cell and the influence of carbon capture. Appl. Therm. Eng. 71 (1), 301–309. doi:10.1016/j.applthermaleng.2014.07.001
Diego, M. E., Bellas, J. M., Mohamed, P., et al. (2018). Techno-economic analysis of a hybrid CO2 capture system for natural gas combined cycles with selective exhaust gas recirculation. Appl. Energy 215, 778–791. doi:10.1016/j.apenergy.2018.02.066
Duan, L., Sun, S., Yue, L., Qu, W., and Yang, Y. (2015). Study on a new IGCC (integrated gasification combined cycle) system with CO2 capture by integrating MCFC (molten carbonate fuel cell). Energy 87, 490–503. doi:10.1016/j.energy.2015.05.011
Duan, L., Zhu, J., Long, Y., and Yang, Y. (2014). Study on a gas-steam combined cycle system with CO2 capture by integrating molten carbonate fuel cell. Energy 74, 417–427. doi:10.1016/j.energy.2014.07.006
ElKady, A. M., Evulet, A., Brand, A., Ursin, T. P., and Lynghjem, A. (2009). Application of exhaust gas recirculation in a DLN F-class combustion system for postcombustion carbon capture. J.Eng. Gas. Turbines Power 131 (5), 34505. doi:10.1115/1.2982158
Evulet, A. T., Elkady, A. M., Branda, A. R., and Chinn, D. (2009). On the performance and operability of GE’s dry low NO combustors utilizing exhaust gas recirculation for PostCombustion carbon capture. Energy Procedia 1, 3809–3816. doi:10.1016/j.egypro.2009.02.182
Franz, J., Schiebahn, S., Zhao, L., Riensche, E., Scherer, V., and Stolten, D. (2013). Investigating the influence of sweep gas on CO2/N2 membranes for post-combustion capture. Int. J. Greenh. Gas Control 13, 180–190. doi:10.1016/j.ijggc.2012.12.008
Gatti, M., Martelli, E., Di Bona, D., Gabba, M., Scaccabarozzi, R., Spinelli, M., et al. (2020). Preliminary performance and cost evaluation of four alternative technologies for post-combustion CO2 capture in natural gas-fired power plants. Energies 13, 543. doi:10.3390/en13030543
Herraiz, L., Fernández, E. S., Palfi, E., and Lucquiaud, M. (2018). Selective exhaust gas recirculation in combined cycle gas turbine power plants with post-combustion CO2 capture. Int. J. Greenh. Gas Control 71, 303–321. doi:10.1016/j.ijggc.2018.01.017
Leto, L., Dispenza, C., Moreno, A., and Calabro, A. (2011). Simulation model of a molten carbonate fuel cell–microturbine hybrid system. Appl. Therm. Eng. 31 (6-7), 1263–1271. doi:10.1016/j.applthermaleng.2010.12.029
Merkel, T. C., Zhou, M., and Ba Ker, R. W. (2012). Carbon dioxide capture with membranes at an IGCC power plant. J. Membr. Sci. 389, 441–450. doi:10.1016/j.memsci.2011.11.012
Miao, L., Tang, S., Li, X., Yu, D., Deng, Y., Hang, T., et al. (2022). Estimating the CO2 emissions of Chinese cities from 2011 to 2020 based on SPNN-GNNWR. Environ. Res. 218, 115060. doi:10.1016/j.envres.2022.115060
Milewski, J., Bujalski, W., Woowicz, M., Futyma, K., and Bernat, R. (2013). Experimental investigation of CO2 separation from lignite flue gases by 100 cm2 single molten carbonate fuel cell. Appl. Mech. Mater. 376 (3), 299–303. doi:10.4028/www.scientific.net/AMM.376.299
Ramasubramanian, K., Verweij, H., and Ho, W. S. W. (2012). Membrane processes for carbon capture from coal-fired power plant flue gas: a modeling and cost study. J. Membr. Sci. 2012, 299–310. doi:10.1016/j.memsci.2012.07.029
Richard, W., Baker, , Kniep, J., Wei, X., and Merkel, T. (2017). CO2 capture from natural gas power plants using selective exhaust gas recycle membrane designs. Int. J. Greenh. Gas Control 66, 35–47. doi:10.1016/j.ijggc.2017.08.016
Spendelow, J., Nguyen, T., Houchins, C., et al. (2012). Medium-scale CHP fuel cell system targets. https://www.hydrogen.energy.gov/pdfs/11014_medium_scale_chp_target.pdf (accessed on April 27, 2023).
Tsukagoshi, K., Muyama, A., Masada, J., et al. (2007). Operating status of uprating gas turbines and future trend of gas turbine development. Tech. Rev. - Mitsubishi Heavy Ind. 44 (4).
Zhao, H., and Hou, Q. (2022). Study on thermal performance of solar methanol reforming MCFC-GT-ST-CHP system. Hydrogen Energy 47, 28670–28683. doi:10.1016/j.ijhydene.2022.06.195
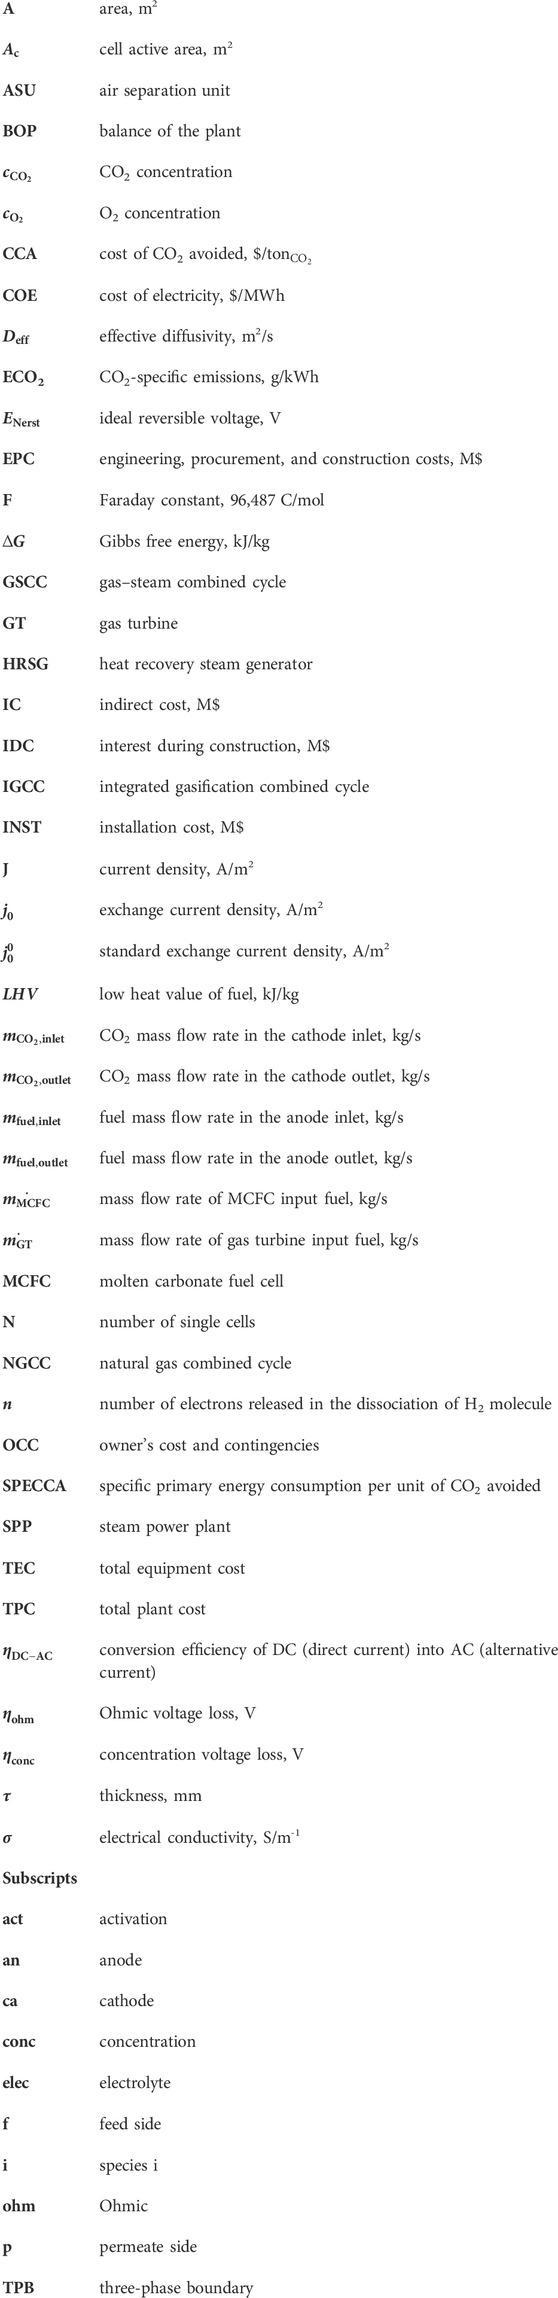
Nomenclature
Keywords: gas turbine, molten carbonate fuel cell, selective exhaust gas recirculation, CO2 emissions, economic analysis
Citation: Bian J and Duan L (2023) Study on MCFC-integrated GSCC systems with SEGR in parallel or series and CO2 capture. Front. Energy Res. 11:1256000. doi: 10.3389/fenrg.2023.1256000
Received: 10 July 2023; Accepted: 19 October 2023;
Published: 14 November 2023.
Edited by:
Chi Lau, Teesside University, United KingdomReviewed by:
Davide Papurello, Polytechnic University of Turin, ItalyHoucheng Zhang, Ningbo University, China
Wenjia Li, Tianjin University, China
Copyright © 2023 Bian and Duan. This is an open-access article distributed under the terms of the Creative Commons Attribution License (CC BY). The use, distribution or reproduction in other forums is permitted, provided the original author(s) and the copyright owner(s) are credited and that the original publication in this journal is cited, in accordance with accepted academic practice. No use, distribution or reproduction is permitted which does not comply with these terms.
*Correspondence: Liqiang Duan, ZGxxQG5jZXB1LmVkdS5jbg==