 Cameron M. Priest1,2†
 Joshua Y. Gomez1
 Nicholas J. Kane1Jeremy L. Hartvigsen1Lucun Wang1
 Dong Ding1Micah J. Casteel1*Frederick F. Stewart1
 Gang Wu2*
- 1Idaho National Laboratory, Idaho Falls, ID, United States
- 2Department of Chemical and Biological Engineering, University at Buffalo, The State University of New York, Buffalo, NY, United States
High temperature electrolysis of water using solid oxide electrochemical cells (SOEC) is a promising technology for hydrogen production with high energy efficiency and may promote decarbonization when coupled with renewable energy sources and excess heat from nuclear reactors. Over the past several decades there have been extensive scientific and engineering studies on cell materials and degradation behaviors that have greatly improved current density, decreased total resistance, and lowered degradation rates. Although the technology is now at a near-commercial level, maintaining consistency in cell testing and minimizing variance in practical testing environments is an often overlooked but crucial topic. To promote high quality data collection, testing procedures and balance of plant component details are extremely important to consider. This work discusses some key factors affecting the reproducibility of practical SOEC testing on the button cell level, namely, current collection layers, cell sealing procedures, the reliability of steam and hydrogen delivery systems, cell testing fixture design, and reduction procedures. To provide a baseline and a level of standardization for the SOEC community, this work also discloses details of the standard operating procedure and techniques adopted for o-SOEC testing at Idaho National Laboratory (INL).
1 Introduction
There is a pressing need to develop sustainable technologies and renewable energy sources with substantially reduced carbon emissions. Severing dependence on fossil fuels is the ideal solution to this climate crisis but will require great strides in energy conversion, storage, and alternative fuels. To fully integrate renewable energy, which currently is intermittent and not completely suitable for an ever-increasing continuous demand, technology that can efficiently convert and store electricity into chemicals and fuels is of paramount importance.
One chemical that shows great promise is hydrogen due to its extremely high energy density and role as a valuable chemical feedstock (Laguna-Bercero, 2012). Currently, steam methane reforming, partial oxidation of hydrocarbons, and coal gasification are the main methods by which hydrogen is produced, with steam reforming of natural gas accounting for 75% of all hydrogen production (Bass et al., 2020). The major issue with these production methods is that fossil fuels are heavily involved not only as the feedstock but also as the thermal energy source. These methods also produce a significant amount of CO2 in addition to the primary hydrogen product, with 7 kg CO2 produced per kg of hydrogen in an average steam reforming process (Bass et al., 2020).
Among various alternative hydrogen production methods, high temperature electrolysis (HTE) of water by oxygen-ion conducting solid oxide electrochemical cells (o-SOECs), is one of the most promising and cleanest approaches when paired with low-emission heat and electricity. HTE is significantly more energy efficient when compared to low temperature electrochemical processes, such as alkaline water electrolysis (AWE) and proton exchange membrane (PEM) electrolysis (Ebbesen et al., 2014; Gomez and Hotza, 2016).
The reasoning behind high temperature operation stems from the thermodynamics of the water electrolysis reaction. The total energy demand for this reaction is determined by the enthalpy change shown by Eq. (1), where ∆G is the change in Gibbs free energy, ∆H is the change in enthalpy, which represents the reaction’s total energy demand, T is temperature, and ∆S is the change in entropy.
Figure 1 shows that the electrical energy demand is drastically reduced at high temperatures and is replaced by thermal energy. Between 700°C and 900°C about one-third of the total energy demand for water vapor electrolysis can be supplied by heat alone and this drastically reduces the cost of the overall energy input (Grigoriev et al., 2020). The advantages of HTE are readily apparent but testing o-SOECs in a precise and repeatable manner is challenging. The testing procedure and ancillary factors surrounding cell testing can contribute significantly to activation, ohmic, and mass transport losses in o-SOECs. For example, activation losses are influenced by reactant gas delivery flow rate and the pressure on each side of the cell. Ohmic losses can be heavily influenced by current collection layers, which, when applied poorly, can introduce a large amount of overall resistance to the cell (in addition to impacting concentration losses). In addition to activation losses, mass transport losses can also be influenced by gas delivery and partial pressure inconsistency on either side of the cell. Even if the quality of each cell is consistent within a given batch, rigorous quality control of cell preparation and testing procedures should still be implemented to ensure reliable data collection and minimize test variability impacts to uphold the legitimacy of any systematic scientific investigations involving o-SOEC technology.
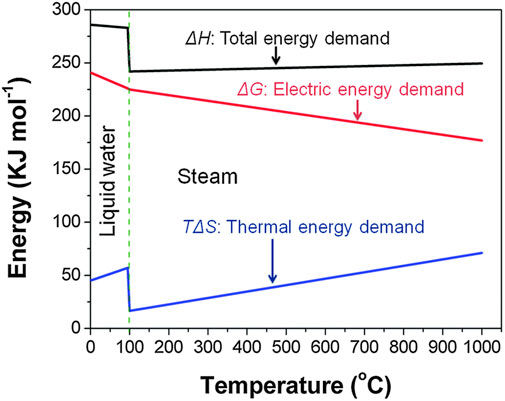
FIGURE 1. Energy demand for water electrolysis as a function of temperature (Reproduced from Bi et al. (Bi et al., 2014)).
2 Challenges in consistent long-term testing
Once a cell is fabricated or purchased from a vendor, the first step in a long-term electrolysis test is the application of current collectors to the cell. This establishes an electrical connection between the cell and the testing fixture/electrochemical testing station. Next, the cell must be sealed onto a testing fixture to ensure a gas tight seal that separates the air side and fuel side. This is critical to ensure no combustion occurs from cross-over leakage which impacts the partial pressures of reactants/products and disturbs the overall thermal environment of the cell.
Next, precise steam/hydrogen delivery to the fuel side of the cell must be considered. This manifests in the form of testing fixture and reactant delivery system designs that facilitate cell support, a controlled thermal environment, and efficient reactant and product transport. Lastly, the cell must be conditioned before electrochemical testing can begin. Inconsistent control of parameters or factors in all these steps alone and in tandem can lead to a high variance in collected data. In the following, common practices with possible issues encountered in each of these steps are discussed in detail.
2.1 Current collection methods
Current collection is an important yet commonly overlooked area in o-SOEC testing and can greatly affect overall cell performance, especially in terms of ohmic and polarization resistance (Rolle et al., 2012). Current collectors are used to collect or deliver electrons to and from the cell electrodes. The current collectors should be porous enough over the active area of the cell to allow gas flow to the triple phase boundaries (TPB) (Ahmed and Ahmed, 2022). Performance data in the literature, such as area specific resistance (ASR) and power outputs, for fuel cells with similar compositions and fabrication processes may vary greatly. In some cases, such discrepancies in reported cell performances can be attributed to different current collection layers/methods (Guo et al., 2011).
Current collectors can affect both electrode and electrolyte layers of the cell and can cause non-negligible losses in performance. Optimization of current collection layers have been shown to increase cell performance by a factor of up to 1.6 (based on power density tests in fuel cell mode) (Noh et al., 2013). Proper current collection layer application can also reduce overall cell resistance by as much as 70% (Jiang et al., 2003). Under constant current conditions, these performance improvement metrics (power density and cell resistance) are directly proportional. This implies that proper current collection can increase general cell performance by 65%–70% compared to unoptimized collection.
Current collection layers usually consist of either metal inks (e.g., Au, Ag, Pt, Ni) or electrode slurry pastes (e.g., LSCF, NiO, etc.) alongside precious metal contact meshes and wires. For electrode slurry pastes, the choice of material depends on the specific environment of the electrode, namely, being oxidizing or reducing. For example, LSCF paste would be chosen for the air electrode, which is typically exposed to air or an O2 containing gas flow, whereas NiO would be used for the fuel electrode which is exposed to reducing conditions during operation. It is important to note that due to the high cost of precious metals, the aforementioned current collector materials are used for single cell lab scale testing only and are not feasible for stack testing or full commercial operation (Chou et al., 2014). This section discusses current collectors primarily for planar button cells, but for tubular/microtubular cells and stack level o-SOECs, the current pathways are longer and the current collector is even more crucial, reinforcing the importance of this cell layer (Zhong et al., 2009; Casarin and Sglavo, 2015; Hodjati-Pugh et al., 2021).
Aside from electronic conductivity, the most important criteria for choosing and applying current collectors are good adhesion with electrodes, sufficient porosity to facilitate gas flow, and material compatibility. For example, poor adhesion of current collection layers can introduce significant electrical resistance which can be mistaken for poor cell performance. Loss of adhesion/contact is also the main cause for abrupt drops in cell performance or sudden cell failure, especially under the high humidity conditions that accompany o-SOEC testing (Jiao and Shikazono, 2014). Furthermore, current collectors with poor porosity can impede the flow of gas to the electrode area, thereby significantly increasing electrode polarization resistance due to mass transfer limitations and thus concentration losses.
Material compatibility should be verified to prevent the current collection layer from reacting with any cell components, especially at cell operating temperatures (650°C–1,000°C) for extended periods of time. For example, Ag ink has relatively low electrochemical stability, especially under potentiostatic operation. This means Ag can migrate and penetrate through o-SOEC electrodes to the YSZ electrolyte (De Silva et al., 2011). Specifically, Ag collects at the fuel electrode-electrolyte interface or air electrode-buffer layer interface over time and its deposition reduces electrode porosity and shrinks the TPB.
It is speculated that the driving forces for Ag migration are current flow and oxygen ion flux, but a specific mechanism is still unclear (Simner et al., 2005; Hughes et al., 2012; Majewski and Dhir, 2018; Khan et al., 2021). For o-SOECs this occurs primarily at the air electrode because of its exposure to oxidizing conditions. Furthermore, Ag can form dendrites at high temperatures in the presence of hydrogen even in the absence of current flow, which leads to similar migration problems on the fuel electrode side as well (Yang et al., 2018). For these reasons, Ag current collectors are not recommended for long term (>500 h) o-SOEC testing despite their superior electrical conductivity at room temperature (6.2 × 10⁵ S/cm) (Guo et al., 2011). Au and Pt are more suitable for long-term testing due to their higher chemical inertness, although they are relatively less conductive than Ag and must be fired at higher temperatures (900°C or higher) to ensure good adhesion to the cell electrode, which may exceed the sintering temperature of certain cell components.
Aside from choosing the appropriate material, format is also important because it can differentiate between good and poor adhesion. For example, annealed metal contact meshes are desired for current collection layers because of their uniformity across the electrode area which provides even electrical contact across the cell. Mesh with reduced grid size improves lateral conduction across the electrode surface and patterned meshes are more effective than woven meshes because they have better contact to the electrode surface (Noh et al., 2013).
Jiang et al. compared Ag and Pt meshes and found that while the designed contact area of the Ag mesh was only slightly higher (6.74%) than the Pt mesh (4.62%), the actual or observed contact area for the Ag mesh was a factor of 3 higher, namely, 13.68% as compared to 4.62% for the Ag and Pt mesh, respectively (see Figure 2). This has been attributed to the relatively lower melting point of Ag (∼962°C) compared to Pt (1772°C). At a testing temperature of 800°C, the Ag mesh is much softer than the Pt mesh and which increases both the contact area and adhesion to the electrode. As a result, the cell with the Ag mesh current collector showed higher performance in terms of both ohmic resistance and peak power density (Jiang et al., 2003).
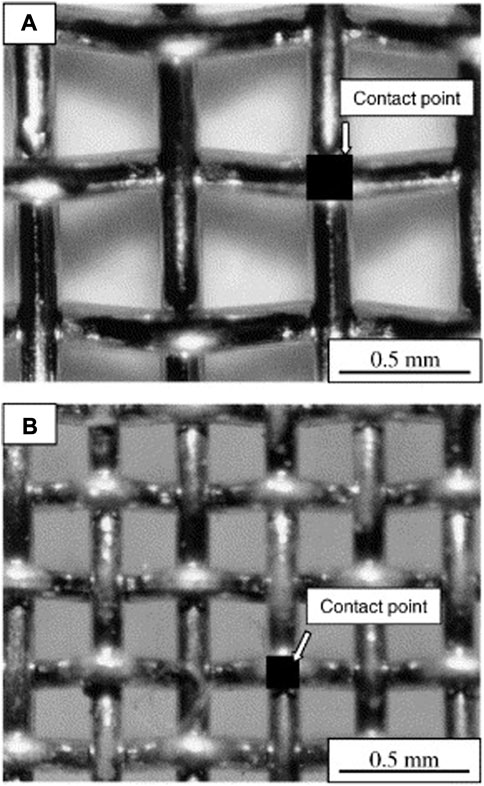
FIGURE 2. Optical micrographs of woven Pt (A) and Ag (B) mesh current collectors (Reproduced from Jiang et al. (Jiang et al., 2003)).
The choice of mesh is also dependent on which electrode the current collection layer is being attached to. For the fuel electrode Ni-YSZ, Ni mesh is preferred as the current collector because its chemical and physical properties most closely match the fuel electrode material (Guillodo et al., 2000; Jiao and Shikazono, 2014). Ni mesh and related current collectors show lower polarization resistance than either Pt or Au, and therefore are an ideal choice for the button cell tests.
In addition, the mesh area is usually filled with electrode pastes (electrode slurry that has not yet been fired/sintered) to ensure full electrical contact across the entire electrode area. These electrode pastes do not necessitate a sintering process as they are just fired enough to stick to the mesh and electrode. Sintering this electrode contact paste would increase electrode thickness and integrate itself into the electrode. This would increase the overall cell thickness and drop current and power densities (Kim and Virkar, 1999). Thus, a simple lower temperature firing/drying process is sufficient. For o-SOECs, LSCF and NiO are popular choices for electrode pastes.
Another advantage of electrode paste slurries is that they possess a higher porosity than metal inks, such as Au or Pt inks, and therefore rarely require the addition of pore formers. One drawback of electrode pastes as current collectors is that, like metals, their electrical conductivity has an inverse relationship with their porosity (Guo et al., 2011). In a sintered state, electrode materials possess high electrical conductivity at o-SOEC operating temperatures but in a more lightly fired form used in a current collection layer, the electrical conductivity is lowered due to higher porosity. This could reduce cell performance to a level below that of a cell using only Ag ink (Guo et al., 2011). Alternatively, metal inks can be effective if applied uniformly with a method such as screen printing (Liao et al., 2016) and many groups continue to use Ag ink and wires for their testing (Chen et al., 2012). Overall, each type of current collector material has important tradeoffs to consider and failing to examine aspects of testing needs can cause significant drops in cell performance.
The standard operating procedure (SOP) for electrode paste recipes and current collector application developed at INL is detailed as follows. Representative images of attached current collection layers and a detailed schematic of the cell configuration showing all layers in an exploded view are presented in Figures 3, 4, respectively.
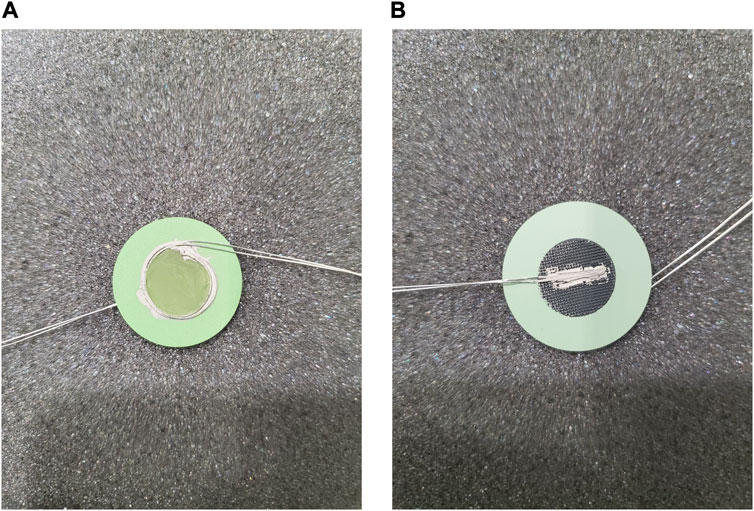
FIGURE 3. Current collectors attached on the (A) fuel electrode and (B) air electrode of a 1-inch o-SOEC cell.
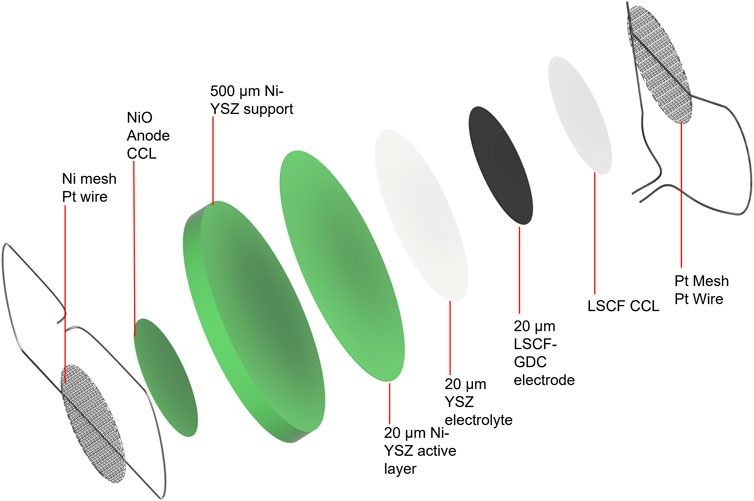
FIGURE 4. Exploded view of o-SOEC cell configuration with current collectors.
Electrode paste recipe (LSCF and NiO):
1. Mix 1:1 electrode powder and 5% ethyl cellulose in α-terpineol.
2. Mix with a planetary mixer.
a. 5 min mixing at 2000 rpm;
b. 5 min defoaming at 2,200 rpm.
Procedure for current collection layer attachment (1 inch cell diameter):
1. Fuel electrode:
a. An 80 mm long platinum wire (0.25 mm diameter) is cut and folded in half, then bent into a ring shape with two tails.
b. 50-gauge Ni mesh (0.009″ diameter wire) is punched into a 13 mm diameter disc and flattened.
c. Ni mesh is centered and placed on top of the fuel electrode.
d. Heraeus platinum ink is spread over the stretch of Pt wire ring that will be in contact with the mesh. The resulting Pt wire ring with ink is then pressed lightly on top of the mesh to attach the mesh and wire to the fuel electrode.
e. 0.025 g of NiO electrode paste is spread over the fuel electrode to fully coat the mesh yet not fully submerge it and adhere the mesh to the fuel electrode.
f. Final assembly is dried at 100°C in an oven for 2 h.
2. Air electrode:
a. An 80 mm long platinum wire (0.25 mm diameter) is cut and folded in half.
b. 52-gauge platinum mesh is punched into a 13 mm diameter disc and flattened.
c. Heraeus platinum ink is spread over the stretch of Pt wire that will be in contact with the mesh. The Pt wire is then adhered to the mesh by lightly pressing the inked wire and mesh together.
d. This wiremesh assembly is then dried in an oven at 100°C for 1 h and fired to 1,200°C for 2 h.
e. 0.025 g of LSCF electrode paste is spread over the air electrode and the wire-mesh assembly is placed over this wet paste.
f. The final assembly is dried at 100°C for 2 h.
Firing procedure for current collection layer:
1. Ramp to 400°C at 1°C/min.
2. Hold at 400°C for 1 h.
3. Ramp to 1,000°C at 2°C/min.
4. Hold at 1,000°C for 2 h.
5. Cool to room temperature (25°C) at 3°C/min.
2.2 Cell sealing pastes
Once the current collection layers have been applied, the next step is to seal the cell on the testing fixture to form a gas tight separation between the two electrodes to prevent combustion resulting from the mixing of hydrogen and oxygen. This sealing step is crucial given that any occurrence of combustion can both extensively damage the cell and may cause safety concerns (Timurkutluk et al., 2022). Sealing materials should be electrically insulating (≥104 Ω cm at operating temperature) and chemically inert towards cell components and oxidizing/reducing conditions (Lara et al., 2004; Reis et al., 2006; Mahapatra and Lu, 2010a).
Additionally, the paste must be thermally stable for at least several thousand hours and have a coefficient of thermal expansion (CTE) between 8.5 and 12 × 10−6 K−1 to maintain compatibility with YSZ. Specifically, the CTE of a paste should deviate by no more than 2 × 10⁻⁶ K−1 compared to that of the cell component it is in contact with (Mahapatra and Lu, 2010b).
Types of seals include compressive, compliant, and rigidly bonded seals. Compressive mica seals are typically used in testing of large planar single cells or stacks (Chou et al., 2014). For button cell tests, rigidly bonded seals are preferred because of their flexibility, cost effectiveness, and modularity (Weil et al., 2006; Mahapatra and Lu, 2010a). Most rigidly bonded seals used for SOFC/SOEC sealing at the button cell level are glass-ceramic composites because they possess more predictable properties and are partially crystallize at high temperature (devitrification) (Timurkutluk et al., 2019). These composites contain mostly aluminosilicates mixed with smaller amounts of other metal oxides, such as BaO, MgO, SrO, La2O3, and B2O3 (Singh, 2006; Lessing, 2007; Mahapatra and Lu, 2010a; Yang et al., 2013). A summary of metal oxide constituents and their roles in a glass/glass-ceramic sealing paste is shown below in Table 1.
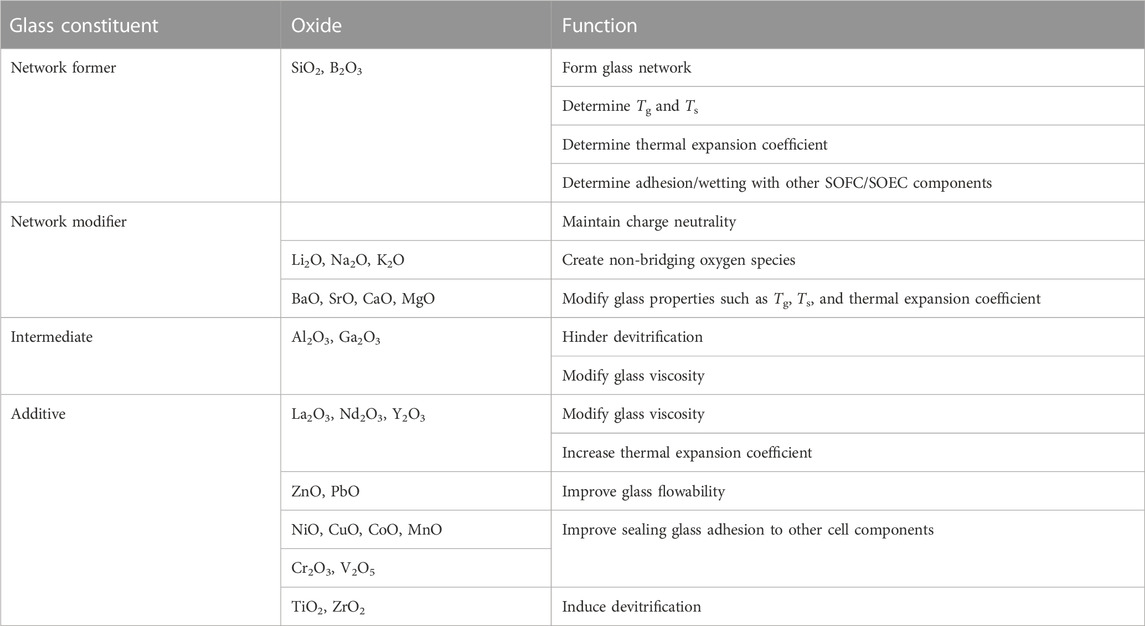
TABLE 1. Functions of different oxide constituents in a sealing glass (Reproduced from Mahapatra et al. (Mahapatra and Lu, 2010a)).
Glass-ceramic sealants are mechanically and electrically insulating, their CTE can match with YSZ (9–13 vs. 10.3 × 10⁻⁶ K−1), and their chemical compositions have great space for subtle or drastic modification in order to achieve desired properties (Singh, 2006; Ye et al., 2012; Puig et al., 2014; de Pablos-Martin et al., 2020). A typical glass-ceramic sealing paste contains glass/ceramic powder, an organic binder/vehicle, and a solvent. Common organic binders include ethyl cellulose and polyethylene glycol. Common solvents used are ethanol, α-terpineol, and water.
To seal the button cell onto the testing fixture, the paste is applied and then heated in a firing process to burn off the organic binder and exceed the glass/ceramic’s glass transition temperature (Tg), then heated above the softening point (Ts) to cure/harden the glass (Mahapatra and Lu, 2010a). Heating above Ts allows the paste to flow to a certain degree and fill in the pores left by the organic burn off before cooling down and re-hardening to create a rigid seal (Lessing, 2007). Maintaining T > Tg during the firing process allows the paste to stay slightly viscous so that it can flow to self-repair any cracks that might arise from cell/paste CTE mismatch (Mahapatra and Lu, 2010a). The Tg for o-SOEC glass-ceramic pastes typically falls between 650°C and 800°C and Ts should be above operating temperature but below 1,000°C to minimize undesired reactions between cell components (Mahapatra and Lu, 2010a). Other rigidly bonded seal formulations have been tested in the literature, including glass-metal composites, ceramic composites, and alumnosilicate cements (Lessing, 2007; Mahapatra and Lu, 2010a). However, various tradeoffs between cost, complexity, reactivity, CTE matching, and overall effectiveness in preventing leakage have firmly established glass-ceramics as the most effective and easily accessible rigidly bonded seal choice for o-SOEC button cell testing (Lessing, 2007; Mahapatra and Lu, 2010a). A comparison between the various types of seals is shown in Table 2 and a comparison between the types of rigidly bonded seals is shown in Table 3.
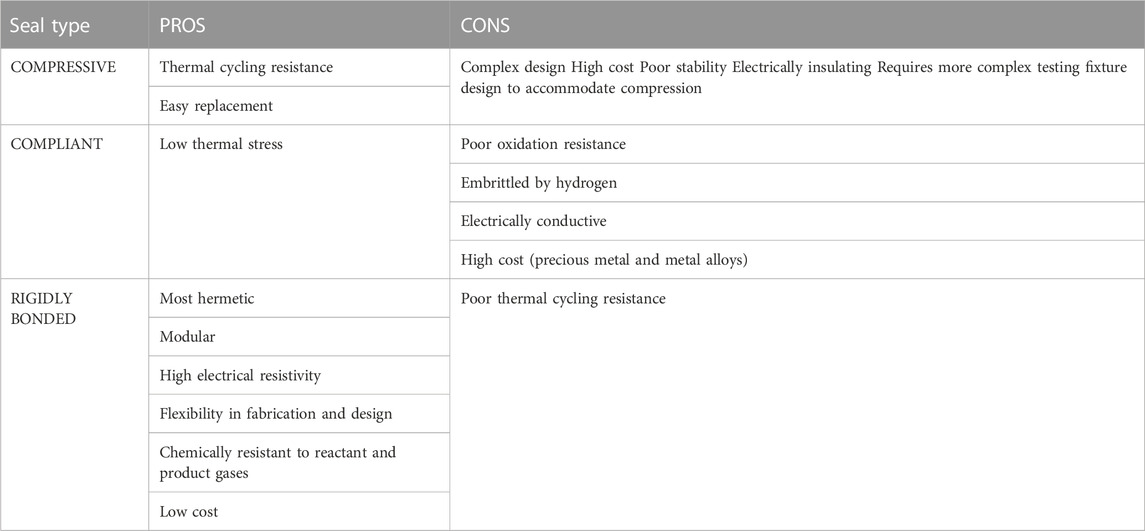
TABLE 2. Summary of solid oxide cell seal types (Mahapatra and Lu, 2010a).
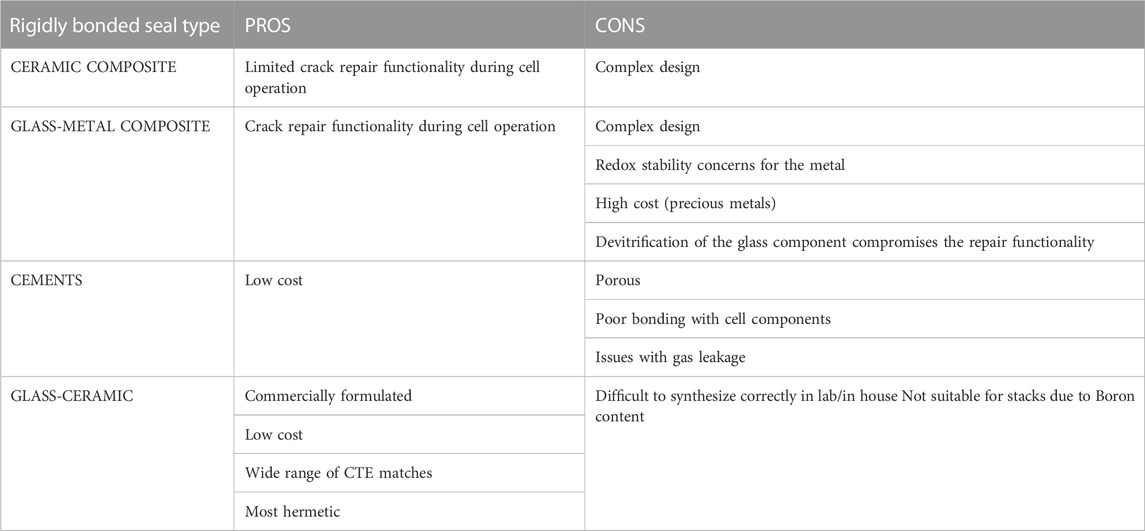
TABLE 3. Comparison of rigidly bonded seals (Lessing, 2007).
Thermal cycling stability of o-SOECs is another issue related to sealing procedure/material choice. If thermal cycling is desired in testing, there is very little tolerance for CTE mismatch between the sealant, cell, and testing fixture. For the electrode supported cell testing detailed in this work, thermal cycling is not considered feasible. The button cell protocols demonstrated here use rigidly bonded glass seals that are less tolerant to thermal cycling. Compressive type seals like mica are ideal for thermal cycling but their use requires a testing fixture design that can accommodate compression (Ihringer, 2011; Coquoz et al., 2015; Hackett et al., 2015; Wu and Shy, 2017; Pichot et al., 2020). When applying any sort of glass or ceramic sealing paste, it is imperative to create two discrete gas environments that are separated by the cell’s dense electrolyte. For example, an electrode-supported cell needs the sealant to completely cover the edge of the porous electrode support to prevent even a small amount of gas from leaking from the fuel to air side. Even a pinhole type leak can impact the reduction procedure and open circuit voltage, leading to drastically decreased cell performance. The glass paste recipe and application/curing procedure adopted for button cell testing at INL is detailed as follows.
Glass paste recipe:
1. For a 10 g basis, first mix 3.3% ethyl cellulose in α-terpineol (0.33 g ethyl cellulose +9.67 g α-terpineol).
2. Heat this mixture for a few hours in a drying oven (∼100°C) and visually inspect for complete dissolution of ethyl cellulose. See Figure 5.
3. Once 3.3% ethyl cellulose/terpineol dissolution is complete, mix with ethanol and Schott 018-354 glass powder (6 parts glass powder:1 part 3.3% cellulose in terpineol:0.1 parts ethanol). Mix these 3 components well until a uniform, thick white paste forms. See Figure 6.
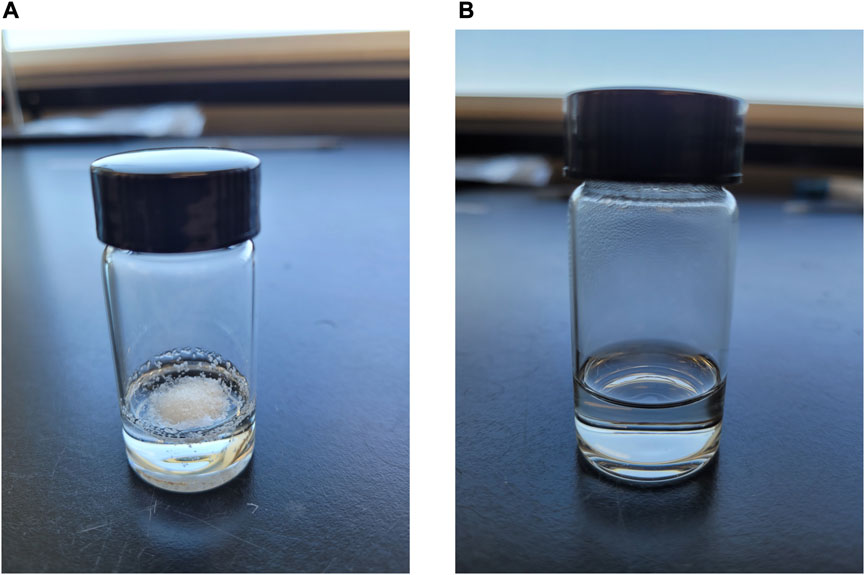
FIGURE 5. 3.3% Ethyl Cellulose in α-Terpineol Solution (A) unheated and (B) heated to full dissolution.
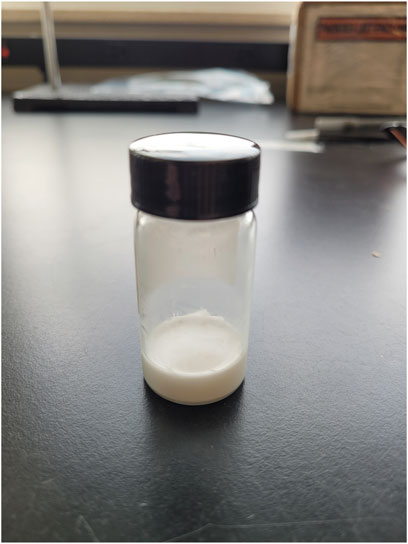
FIGURE 6. Glass paste (fully mixed).
Glass paste application:
1. Use a ringstand/clamp to hold up and level a 1″ alumina testing fixture.
2. Load ∼0.5 mL of glass paste into a syringe and deliver it evenly on the end of a 1″ alumina testing fixture. Even coverage and uniformity are very important.
3. Once the layer of glass paste is applied evenly, place the cell on the fixture and press very lightly to secure it.
4. Apply a layer of glass paste on the top of the cell in a ring that closely follows the outer edge.
5. Use a clean nitrile/latex gloved hand or a clean spatula to deftly roll the top layer of paste down over the edge of the cell until it contacts the original layer of glass paste. Ensure that the edge of the cell is completely covered by the glass paste.
6. Closely monitor the position of the glass paste and push it up if it drips or flows down the side of the fixture too much. This process should take about 30 min until the paste air dries enough to stop moving on its own.
7. Let the paste dry overnight and then wrap the current collector wires around the leads on the testing fixtures. See Figure 7 for a view of dried glass paste after application.
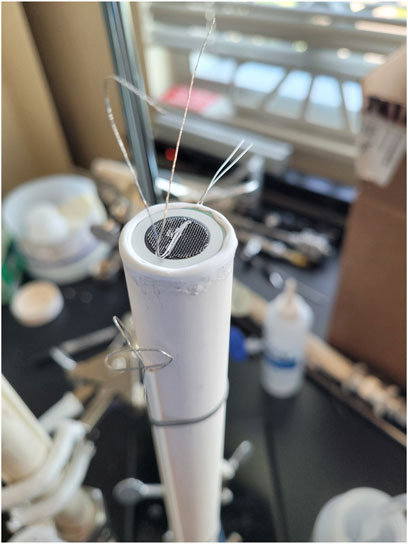
FIGURE 7. Dried glass paste after application.
2.3 Gas delivery systems
The next area to consider is the design of cell testing fixtures and humidifiers. For o-SOECs, steam is required for electrolysis, which needs reliable and controlled delivery to the fuel electrode at a desired concentration (3%, 10%, 50%, etc.) (Zheng et al., 2019). This gaseous water must also be mixed with a hydrogen stream to maintain a reducing atmosphere on the fuel electrode side and prevent reoxidation of Ni. For the air electrode, ambient furnace air can be used.
The foremost challenge in o-SOEC testing is water vapor delivery (humidification). Maintaining proper humidity levels at the fuel electrode has a significant effect on the quality of electrochemical performance data, overall electrolysis efficiency, and the quality of data used to determine the faradaic efficiency of the water electrolysis reaction (Ou et al., 2017; Eder and Preißinger, 2020; Zhang et al., 2022). Improper or unstable humidification is often seen as oscillations in either current or voltage signals during electrochemical testing and is the result of fluctuation, either high or low, in humidification levels from a desired setpoint (Sanchez et al., 2016).
Common methods for steam delivery in o-SOEC testing are bubble humidifiers (bubblers), combustion humidifiers, and steam generators (Vasu et al., 2008; Zhang et al., 2022). Combustion humidifiers, sometimes called hydrogen burners, can more precisely deliver the desired quantity of water vapor in a relatively short amount of time when compared to bubblers (Zhang et al., 2022). However, the increased potential explosive risk of combustion humidifiers requires an extensive safety review for long-term operation. Steam generators (boilers) are another option, but their higher flowrates (>100 sccm) are often excessive for lab scale testing, not to mention the safety concerns that are raised from requiring a pressure vessel and its associated auxiliary components (Zhang et al., 2022).
Bubblers are technically simple and are much safer (Eder et al., 2022). The drawback of bubblers is that they are slow to change conditions when ramping or cooling to a temperature/water vapor concentration setpoint and the actual relative humidity versus the bubbler setpoint can vary by ∼5% (Liu and Sharqawy, 2016; Fang et al., 2022). Bubblers require several minutes to reach steady state when ramping or cooling to a setpoint (Fang et al., 2022). Bubblers control the water vapor concentration by varying water temperature which is directly proportional to its vapor pressure. Note that the local altitude needs to be considered when calculating the temperature setpoint of the bubbler to achieve the target steam concentration.
In bubblers, water vapor is carried by a gas stream which flows into the bubbler reservoir through a porous tip. The gas stream bubbles through the liquid water and rises to the headspace above the reservoir where the gas stream (hydrogen) mixes with the water vapor. The outlet stream then leaves the bubbler. The lines carrying the humidified gas between the bubbler and the cell fixture must be heated to prevent condensation. Specifically, the heated lines must consistently exceed the dew point which leads to a minimum controller setting of 120°C in practice for 50% steam/50% hydrogen fuel side conditions. Depending on the type and quality of heating control used, this temperature setting can vary. Specifically, the layout and heating of the heated lines must be considered carefully as any condensation in the inlet gas lines can significantly decrease data quality. It is beneficial to decrease the length of the lines and fully cover the lines with heat trace and insulation. Outlet lines should be heated until the product stream reaches the condenser. The condenser is necessary for separating the water vapor from the hydrogen before the product stream enters the laboratory ventilation system. This is done for the sake of safety and minimizing the possibility of creating a flammable mixture. All outlet lines prior to the condenser should be sloped downward to facilitate drainage and should be at least 3/8’’. Using 1/4″ diameter lines can create back pressure into the testing fixture when condensed water droplets fill the interior of the tube. Liu et al. showed that it is beneficial for the bubbler to operate at sub-atmospheric pressure (∼0.48 bar) because it increases the heat transfer rate to the water (Liu and Sharqawy, 2016). Conversely, Ma et al. showed that bubbler performance decreases with an increase in inlet gas velocity (5 m/s to 20 m/s), reinforcing the idea that bubblers are best suited for lab scale single cell applications where total gas flowrates are relatively low (Ma et al., 2019). A P&ID diagram for an o-SOEC testing stand used at INL is shown in Figure 8.
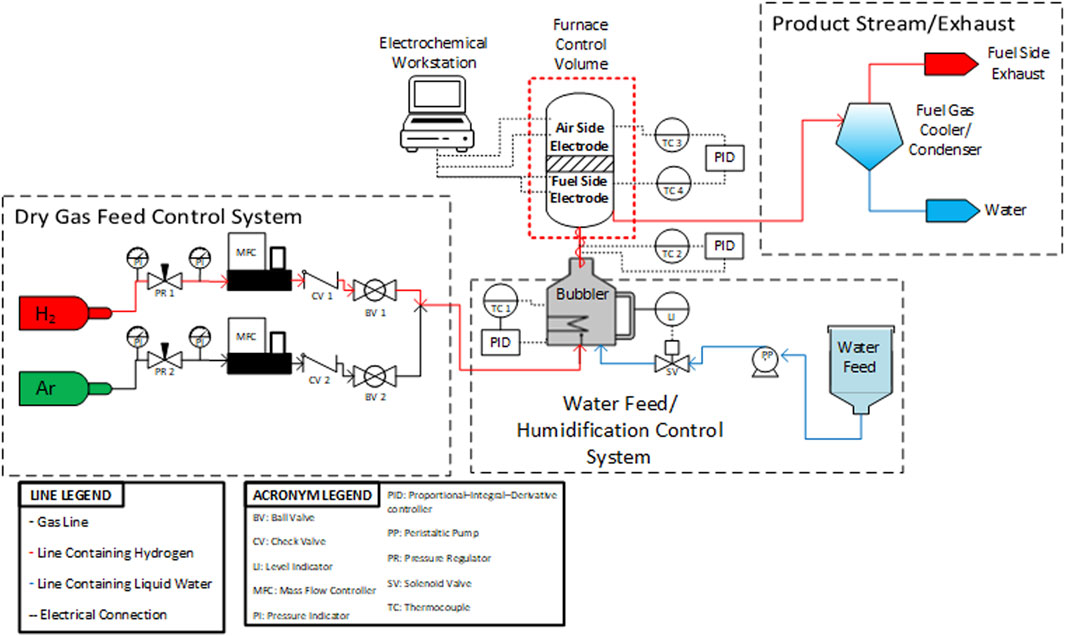
FIGURE 8. Full P&ID for an o-SOEC testing stand at INL.
The cell testing fixture is the second gas delivery system design considered in o-SOEC testing. The role of the testing fixture is to separate the air and fuel electrodes of the cell and deliver the humidified hydrogen stream to the fuel electrode of the cell. In addition, it vents the product gases to an outlet stream that can be used for further experimentation or analysis (cold trap, hydrogen recycle stream, GC analysis, etc.).
It is ideal to match the material of the testing fixture’s tube to the support material of the cell. For example, Ni-YSZ supported cells can minimize CTE mismatch by using zirconia support tubes. This minimizes mechanical stress on the cell during temperature ramping or cooling and helps to prevent possible leakage during cell sealing firing procedures. Due to the low cost, alumina testing tubes are the most common support but other high hardness ceramics that can resist SOEC temperature ranges (650°C–1000°C) can be used as well (Shen et al., 2022). The schematics for the 1 inch testing fixtures used at INL are shown in Figure 9.
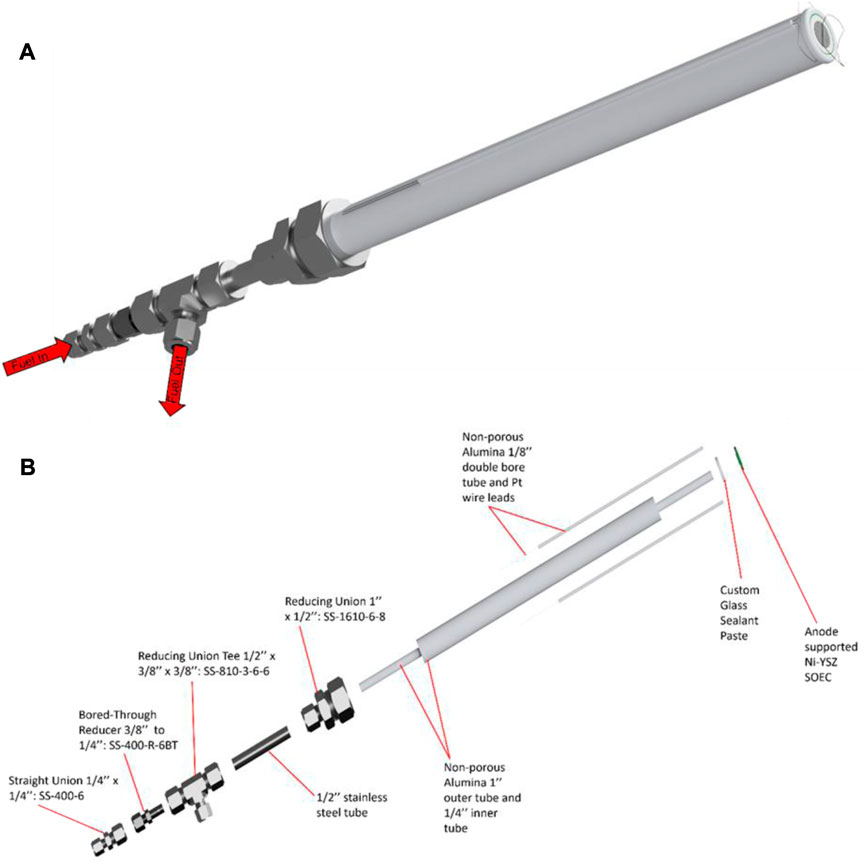
FIGURE 9. Schematics of the alumina testing fixture used at INL: (A) fully assembled testing fixture with cell and glass sealant paste and (B) exploded view of the testing fixture showing all components. The design of this INL fixture is intentionally geometrically simple because its individual components are purchased unmodified from commercial vendors. The lack of modification is suggested for ease of use and expediting test stand setup. However, more geometrically complex designs for a testing fixture could be investigated for their effect on optimizing reactant gas flows (Huang et al., 2010).
2.4 Reduction procedure
Once the current collectors have been attached, the cell has been sealed on the testing fixture, and a humidification system and testing fixtures are in place, the steam electrode of the cell must be reduced before testing. The reduction conditions and procedure have also been shown to have non-negligible effects on cell performance (Li et al., 2010; Cheng et al., 2015). The steam electrode composed of Ni/YSZ in a typical o-SOEC must be exposed to a reducing atmosphere to convert the NiO to electronically conductive and catalytically active Ni and to create pores in the electrode to allow for diffusion of reactant gases (Cheng et al., 2015). This reduction process is conducted by exposing the steam electrode at a given temperature to a hydrogen rich atmosphere in stages by gradually increasing the concentration of hydrogen and reducing the concentration of argon/nitrogen (Cheng et al., 2015). This sensitive reduction process has been linked to Ni coarsening/agglomeration and must be conducted with great care to avoid damage to the Ni/YSZ electrode microstructure (Makowska et al., 2015). Three main factors in the reduction procedure may influence the cell performance, including the temperature, reduction time, and hydrogen concentration.
The reduction temperature has a major effect on the steam electrode microstructure in terms of structural homogeneity, Ni crystallite size, and porosity. Nickel agglomeration/coarsening is considered as one of the major degradation mechanisms in o-SOECs (Hauch et al., 2008; Osinkin et al., 2010; Hauch et al., 2011; Holzer et al., 2011). While primarily deemed as a long-term consequence of testing, Ni agglomeration may occur during reduction as well (Mogensen et al., 2021). Studies by Li et al. showed SEM images and EIS spectra of various cells after being reduced at 550, 650, and 750°C. They found that 650°C is the optimal reduction temperature for Ni/8YSZ anode supported cells with LSM air electrode because at 650°C there was minimal Ni agglomeration, and the total cell resistance was the lowest compared to the cells reduced at 550°C and 750°C, as shown in Figure 10 (Li et al., 2010).
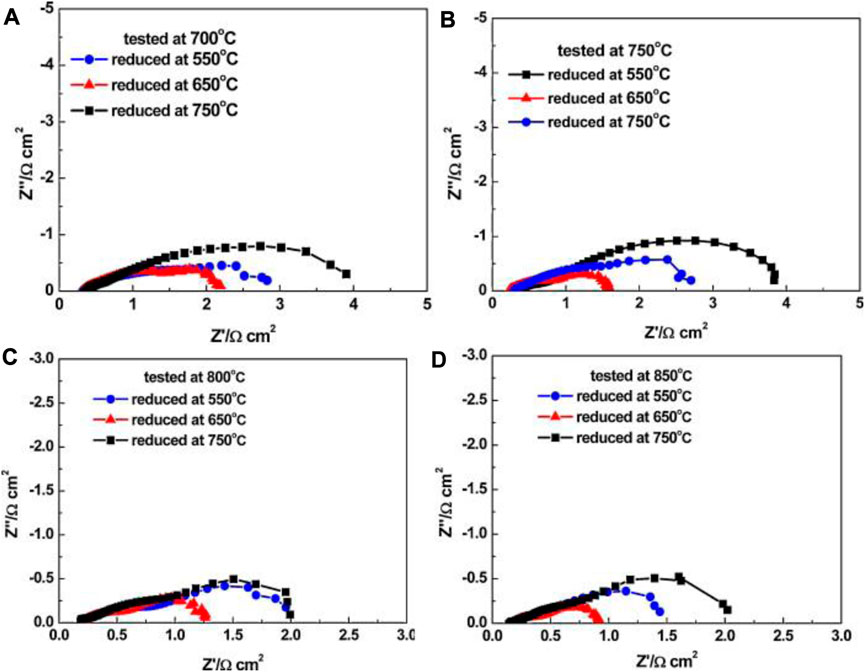
FIGURE 10. Electrochemical impedance spectra (EIS) for the single cells reduced at different temperatures and then tested at: (A) 700°C; (B) 750°C; (C) 800°C; (D) 850°C (Reproduced from Li et al. (Li et al., 2010)).
Conversely, a study on electrode activation by Haanappel et al. showed that anode supported Ni/YSZ cells (LSM or LSCF air electrode, YSZ electrolyte, Ni/YSZ anode) performed best after being reduced at 900°C (Haanappel et al., 2006). Manukyan et al. studied the reduction of bulk NiO crystals in hydrogen and revealed that incomplete reduction occurs at temperatures less than or equal to 500°C with NiO still present in the complex microstructure. Pore size at these lower temperatures is ∼100 nm. At 1,000°C and above, full reduction occurs in seconds, but the pore size of the resulting microstructure decreases to 10 nm or less (Manukyan et al., 2015). Since this study used partially oxidized Ni wires rather than an actual Ni/YSZ fuel electrode, it is difficult to make direct comparisons with studies conducted on real solid oxide cells. However, it gives a possible lower and upper limit for o-SOEC reduction temperature. Below 500°C, it is likely that the Ni-YSZ electrode will not be completely reduced. Above 1,000°C, the reduction process will probably occur too quickly and shrink the pores in the microstructure to a point where gas diffusion is impeded. Additionally, the Ni crystal growth can be excessive enough at extreme temperatures to cause phase separation in the Ni-YSZ cermet.
Reduction time also has a major effect on the electrochemical performance of an o-SOEC cell. The Ni/YSZ electrode should be reduced for at least 5 h and the OCV should be monitored throughout the reduction process (Li et al., 2010). Reducing for less than 5 h may result in incomplete reduction of NiO in the steam electrode, which would raise the total resistance of the cell. Besides the reduction timeframe, the cell should be considered fully reduced when the OCV deviates less than ∼1 mV/h after reaching a value close to the theoretical Nernst potential. With this metric, some cells may take less than 5 h to fully reduce but to minimize testing error it is recommended to leave a cell overnight on OCV under reducing conditions.
The hydrogen concentration is the third variable in the reduction procedure and is most important in the first 1 or 2 h of the reduction procedure. Initially, the cell testing fixture should be flushed with argon or nitrogen before hydrogen is introduced to remove ambient oxygen from inside the system. This both prevents a possible combustible mixture from forming inside the system and establishes a stable inert atmosphere. When hydrogen is introduced, it should be done fractionally, from 5% to 10%, 20%, 50%, and 100%. The reasoning for this gradual increase is to control the reduction kinetics and minimize the stress on the cell as the fuel electrode undergoes its chemical change in the presence of hydrogen, which is an exothermic process that can trigger autocatalysis once started and possibly produce local hot spots (Rodriguez et al., 2002). The hydrogen concentration is related to the intensity of these hot spots and therefore should be increased as gradually as possible to prevent unnecessary sintering or agglomeration of metallic Ni. At each given hydrogen concentration, the gas flow should not be changed until the OCV has reached a steady state. Once the OCV is stable, the hydrogen concentration can be increased to the next fraction and conversely the argon can be decreased to maintain a constant total flow rate into the testing fixture. Not maintaining a constant flow rate introduces stress to the cell in the form of gas pressure and should be avoided. Once the cell OCV is stable at 100% hydrogen, electrochemical testing can commence.
Overall, a reduction procedure requires precise control of temperature, exposure time, and hydrogen concentration. The general reduction temperature for o-SOECs should be greater than 500°C but less than 1,000°C and can vary within this range depending on the desired operating temperature. Next, total reduction time should be at least 5 h and the cell should be held at each hydrogen concentration threshold (10%, 20%, 30%, 50%, etc.) until the fluctuation in OCV is less than 1 mV/h to confirm steady state conditions. Lastly, hydrogen concentration control should be done as gradually as possible within realistic time constraints and maintain a constant total flow rate to the cell when changing the concentration of hydrogen and the balance inert gas. The full glass sealing procedure and cell reduction procedure optimized at INL are shown in Table 4 The total fuel side flowrate is 100 sccm for a 1 inch o-SOEC.
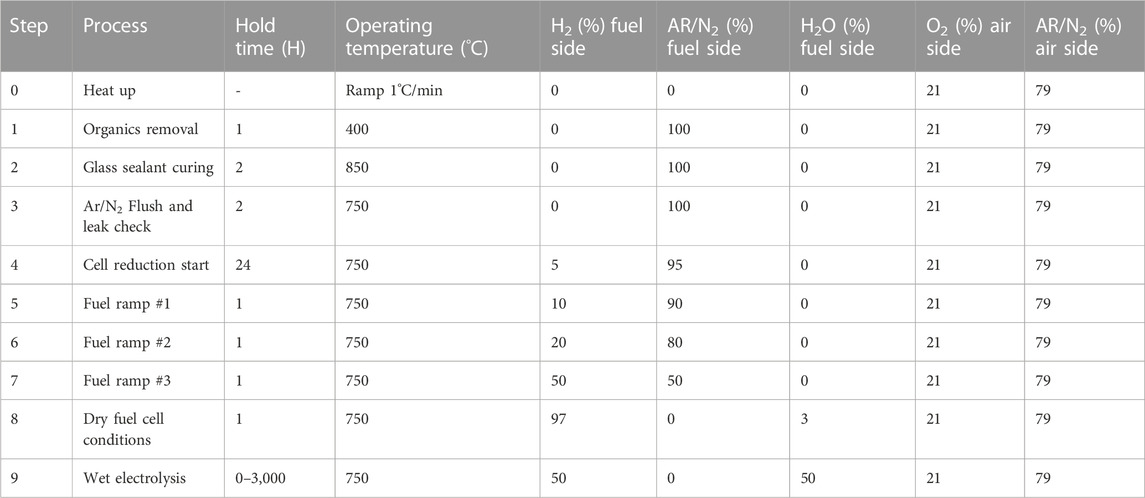
TABLE 4. Glass sealing procedure and cell reduction procedure.
3 Summary
While great technical strides have been made and continue to be made in o-SOEC research and development, different research groups rarely include practical testing details in their publications. This often makes it very difficult if not impossible to replicate the vast number of results reported in o-SOEC literature and compare results across different groups. Obtaining consistently high-quality data relies heavily on these more sensitive details and neglecting them causes a significant detriment to cell performance. As the discussion of these topics are scarce in the literature, the full testing and cell preparation procedure demonstrated here is meant to provide a baseline for the solid oxide electrolysis community and offer a level of standardization in this research field. Despite the standardization we aim to establish with this work, we also stress that the methods and recipes presented here are meant to be modified and improved upon by the solid oxide electrolysis community.
Data availability statement
The datasets presented in this study can be found in online repositories. The names of the repository/repositories and accession number(s) can be found in the article/supplementary material.
Author contributions
CP: Conceptualization, Data curation, Investigation, Methodology, Writing–original draft. JG: Conceptualization, Investigation, Methodology, Writing–review and editing. NK: Investigation, Methodology, Writing–review and editing. JH: Writing–review and editing. LW: Funding acquisition, Resources, Writing–review and editing. DD: Writing–review and editing. MC: Funding acquisition, Resources, Writing–review and editing. GW: Writing–review and editing.
Funding
The authors declare financial support was received for the research, authorship, and/or publication of this article. This work was funded by the U.S. Department of Energy’s Hydrogen and Fuel Cell Technology Office in the Office of Energy Efficiency and Renewable Energy under the H2NEW program.
Acknowledgments
The authors acknowledge the other national labs in the H2NEW consortium, including LBNL, NREL, and PNNL for their assistance and support throughout this work. This manuscript has been authored by Battelle Energy Alliance, LLC under Contract No. DE-AC07-05ID14517 with the U.S. Department of Energy.
Conflict of interest
The authors declare that the research was conducted in the absence of any commercial or financial relationships that could be construed as a potential conflict of interest.
Publisher’s note
All claims expressed in this article are solely those of the authors and do not necessarily represent those of their affiliated organizations, or those of the publisher, the editors and the reviewers. Any product that may be evaluated in this article, or claim that may be made by its manufacturer, is not guaranteed or endorsed by the publisher.
Abbreviations
SOEC, Solid Oxide Electrolysis Cell; SOFC, Solid Oxide Fuel Cell; INL, Idaho National Laboratory; HTE, High Temperature Electrolysis; AWE, Alkaline Water Electrolysis; PEM, Proton Exchange Membrane; ASR, Area-Specific Resistance; TPB, Triple Phase Boundary; LSCF, Lanthanum Strontium Cobalt Ferrite; LSM, Lanthanum Strontium Manganite; YSZ, Yttria-Stabilized Zirconia; SOP, Standard Operating Procedure; CTE, Coefficient of Thermal Expansion; P&ID, Piping and Instrumentation Diagram; SEM, Scanning Electron Microscopy; EIS, Electrochemical Impedance Spectroscopy.
References
Ahmed, K. I., and Ahmed, M. H. (2022). Developing a novel design for a tubular solid oxide fuel cell current collector. Appl. Sciences-Basel 12 (12), 6003. doi:10.3390/app12126003
Bassani, A., Previtali, D., Pirola, C., Bozzano, G., Colombo, S., and Manenti, F. (2020). Mitigating carbon dioxide impact of industrial steam methane reformers by acid gas to syngas technology: technical and environmental feasibility. J. Sustain. Dev. Energy Water Environ. Systems-Jsdewes 8 (1), 71–87. doi:10.13044/j.sdewes.d7.0258
Bi, L., Boulfrad, S., and Traversa, E. (2014). Steam electrolysis by solid oxide electrolysis cells (SOECs) with proton-conducting oxides. Chem. Soc. Rev. 43 (24), 8255–8270. doi:10.1039/c4cs00194j
Casarin, M., and Sglavo, V. M. (2015). Effect of the current collector on performance of anode-supported microtubular solid oxide fuel cells. J. Fuel Cell. Sci. Technol. 12 (3). doi:10.1115/1.4029875
Chen, Y. B., Wang, F. C., Chen, D. J., Dong, F. F., Park, H. J., Kwak, C., et al. (2012). Role of silver current collector on the operational stability of selected cobalt-containing oxide electrodes for oxygen reduction reaction. J. Power Sources 210, 146–153. doi:10.1016/j.jpowsour.2012.03.019
Cheng, S.-W., Tsai, C.-H., Wu, S.-H., Liu, C.-K., Cheng, Y.-N., and Lee, R.-Y. (2015). Effects of reduction process on the electrochemical and microstructural properties for electrolyte-supported SOFC. Int. J. Hydrogen Energy 40 (3), 1534–1540. doi:10.1016/j.ijhydene.2014.11.034
Chou, Y. S., Stevenson, J. W., and Choi, J. P. (2014). Long-term evaluation of solid oxide fuel cell candidate materials in a 3-cell generic short stack fixture, part I: test fixture, sealing, and electrochemical performance. J. Power Sources 255, 1–8. doi:10.1016/j.jpowsour.2013.12.067
Coquoz, P., Grize, C., Ruiz, J., Bourradou, A., Diethelm, S., Singh, V., et al. (2015). Study of 2R-cell equipped with LSC and LSCF cathodes under thermic and redox cycling. ECS Trans. 68 (1), 569–577. doi:10.1149/06801.0569ecst
de Pablos-Martin, A., Rodriguez-Lopez, S., and Pascual, M. J. (2020). Processing technologies for sealing glasses and glass-ceramics. Int. J. Appl. Glass Sci. 11 (3), 552–568. doi:10.1111/ijag.15107
De Silva, K. C. R., Kaseman, B. J., and Bayless, D. J. (2011). Silver (Ag) as anode and cathode current collectors in high temperature planar solid oxide fuel cells. Int. J. Hydrogen Energy 36 (1), 779–786. doi:10.1016/j.ijhydene.2010.10.034
Ebbesen, S. D., Jensen, S. H., Hauch, A., and Mogensen, M. B. (2014). High temperature electrolysis in alkaline cells, solid proton conducting cells, and solid oxide cells. Chem. Rev. 114 (21), 10697–10734. doi:10.1021/cr5000865
Eder, E., Hiller, S., Brüggemann, D., and Preißinger, M. (2022). Characteristics of air–liquid heat and mass transfer in a bubble column humidifier. Appl. Therm. Eng. 209, 118240. doi:10.1016/j.applthermaleng.2022.118240
Eder, E., and Preißinger, M. (2020). Experimental analysis of the humidification of air in bubble columns for thermal water treatment systems(☆). Exp. Therm. Fluid Sci. 115, 110063. doi:10.1016/j.expthermflusci.2020.110063
Fang, M., Wan, X., and Zou, J. (2022). Development of a fuel cell humidification system and dynamic control of humidity. Int. J. Energy Res. 46 (15), 22421–22438. doi:10.1002/er.8547
Gomez, S. Y., and Hotza, D. (2016). Current developments in reversible solid oxide fuel cells. Renew. Sustain. Energy Rev. 61, 155–174. doi:10.1016/j.rser.2016.03.005
Grigoriev, S. A., Fateev, V. N., Bessarabov, D. G., and Millet, P. (2020). Current status, research trends, and challenges in water electrolysis science and technology. Int. J. Hydrogen Energy 45 (49), 26036–26058. doi:10.1016/j.ijhydene.2020.03.109
Guillodo, M., Vernoux, P., and Fouletier, J. (2000). Electrochemical properties of Ni–YSZ cermet in solid oxide fuel cells: effect of current collecting. Solid State Ionics 127 (1), 99–107. doi:10.1016/s0167-2738(99)00254-4
Guo, Y., Zhou, Y., Chen, D., Shi, H., Ran, R., and Shao, Z. (2011). Significant impact of the current collection material and method on the performance of Ba0.5Sr0.5Co0.8Fe0.2O3−δ electrodes in solid oxide fuel cells. J. Power Sources 196 (13), 5511–5519. doi:10.1016/j.jpowsour.2011.02.056
Haanappel, V. A. C., Mai, A., and Mertens, J. (2006). Electrode activation of anode-supported SOFCs with LSM- or LSCF-type cathodes. Solid State Ionics 177 (19), 2033–2037. doi:10.1016/j.ssi.2005.12.038
Hackett, G. A., Gerdes, K., Chen, Y., Song, X., and Zondlo, J. (2015). Performance impact associated with Ni-based SOFCs fueled with higher hydrocarbon-doped coal syngas. Metallurgical Mater. Trans. E 2 (1), 58–69. doi:10.1007/s40553-015-0044-y
Hauch, A., Ebbesen, S. D., Jensen, S. H., and Mogensen, M. (2008). Solid oxide electrolysis cells: microstructure and degradation of the Ni/Yttria-Stabilized zirconia electrode. J. Electrochem. Soc. 155 (11), B1184. doi:10.1149/1.2967331
Hauch, A., Mogensen, M., and Hagen, A. (2011). Ni/YSZ electrode degradation studied by impedance spectroscopy — effect of p(H2O). Solid State Ionics 192 (1), 547–551. doi:10.1016/j.ssi.2010.01.004
Hodjati-Pugh, O., Dhir, A., and Steinberger-Wilckens, R. (2021). Development of a novel electroless deposited nickel braze for micro-tubular solid oxide fuel cell current collector contacting. J. Adv. Join. Process. 4, 100070. doi:10.1016/j.jajp.2021.100070
Holzer, L., Iwanschitz, B., Hocker, T., Münch, B., Prestat, M., Wiedenmann, D., et al. (2011). Microstructure degradation of cermet anodes for solid oxide fuel cells: quantification of nickel grain growth in dry and in humid atmospheres. J. Power Sources 196 (3), 1279–1294. doi:10.1016/j.jpowsour.2010.08.017
Huang, C. M., Shy, S. S., Li, H. H., and Lee, C. H. (2010). The impact of flow distributors on the performance of planar solid oxide fuel cell. J. Power Sources 195 (19), 6280–6286. doi:10.1016/j.jpowsour.2010.04.073
Hughes, G. A., Yakal-Kremski, K., Call, A. V., and Barnett, S. A. (2012). Durability testing of solid oxide cell electrodes with current switching. J. Electrochem. Soc. 159 (12), F858–F863. doi:10.1149/2.008301jes
Ihringer, R. (2011). 2R-Cell: A universal cell for an easy and safe SOFC operation. ECS Trans. 35 (1), 393–402. doi:10.1149/1.3570014
Jiang, S. P., Love, J. G., and Apateanu, L. (2003). Effect of contact between electrode and current collector on the performance of solid oxide fuel cells. Solid State Ionics 160 (1-2), 15–26. doi:10.1016/s0167-2738(03)00127-9
Jiao, Z. J., and Shikazono, N. (2014). Study on the influence of current collector on the sudden deterioration of solid oxide fuel cell anode performance. J. Fuel Cell. Sci. Technol. 11 (2). doi:10.1115/1.4026087
Khan, M. S., Xu, X., Knibbe, R., and Zhu, Z. (2021). Air electrodes and related degradation mechanisms in solid oxide electrolysis and reversible solid oxide cells. Renew. Sustain. Energy Rev. 143, 110918. doi:10.1016/j.rser.2021.110918
Kim, J.-W., and Virkar, A. V. (1999). The effect of anode thickness on the performance of anode-supported solid oxide fuel cells. ECS Proc. Vol. 1999-19 (1), 830–839. doi:10.1149/199919.0830pv
Laguna-Bercero, M. A. (2012). Recent advances in high temperature electrolysis using solid oxide fuel cells: A review. J. Power Sources 203, 4–16. doi:10.1016/j.jpowsour.2011.12.019
Lara, C., Pascual, M. J., and Duran, A. (2004). Glass-forming ability, sinterability and thermal properties in the systems RO-BaO-SiO2 (R = Mg, Zn). J. Non-Crystalline Solids 348, 149–155. doi:10.1016/j.jnoncrysol.2004.08.140
Lessing, P. A. (2007). A review of sealing technologies applicable to solid oxide electrolysis cells. J. Mat. Sci. 42 (10), 3465–3476. doi:10.1007/s10853-006-0409-9
Li, T. S., Wang, W. G., Miao, H., Chen, T., and Xu, C. (2010). Effect of reduction temperature on the electrochemical properties of a Ni/YSZ anode-supported solid oxide fuel cell. J. Alloys Compd. 495 (1), 138–143. doi:10.1016/j.jallcom.2010.01.103
Liao, M. W., Lin, T. N., Chang, J. C., Lee, M. C., Yang, R. J., Chang, Y. C., et al. (2016).Investigation on the performance testing reliability by introducing current collection modification for the solid oxide fuel cell, 13th International Symposium on Solid Oxide Fuel Cells (SOFC) - Materials, Science, and Tehnology and Crystalline Materials for Electrical, Optical, and Medical Applications, Daytona Beach, FL, January 2017. Daytona Beach, 137–151.
Liu, H. C., and Sharqawy, M. H. (2016). Experimental performance of bubble column humidifier and dehumidifier under varying pressure. Int. J. Heat Mass Transf. 93, 934–944. doi:10.1016/j.ijheatmasstransfer.2015.10.040
Ma, T. C., Wang, K., Zhou, Q. Q., Lin, W. K., Cong, M., and Jia, W. Y. (2019). Numerical study on humidification performance of fuel cell test platform humidifier. Energies 12 (20), 3839. doi:10.3390/en12203839
Mahapatra, M. K., and Lu, K. (2010a). Glass-based seals for solid oxide fuel and electrolyzer cells - a review. Mater. Sci. Eng. R-Reports 67 (5-6), 65–85. doi:10.1016/j.mser.2009.12.002
Mahapatra, M. K., and Lu, K. (2010b). Seal glass for solid oxide fuel cells. J. Power Sources 195 (21), 7129–7139. doi:10.1016/j.jpowsour.2010.06.003
Majewski, A. J., and Dhir, A. (2018). Application of silver in microtubular solid oxide fuel cells. Mater. Renew. Sustain. Energy 7 (3), 16. doi:10.1007/s40243-018-0123-y
Makowska, M. G., Strobl, M., Lauridsen, E. M., Frandsen, H. L., Tremsin, A. S., Kardjilov, N., et al. (2015). Effect of stress on NiO reduction in solid oxide fuel cells: A new application of energy-resolved neutron imaging. J. Appl. Crystallogr. 48 (2), 401–408. doi:10.1107/s1600576715002794
Manukyan, K. V., Avetisyan, A. G., Shuck, C. E., Chatilyan, H. A., Rouvimov, S., Kharatyan, S. L., et al. (2015). Nickel oxide reduction by hydrogen: kinetics and structural transformations. J. Phys. Chem. C 119 (28), 16131–16138. doi:10.1021/acs.jpcc.5b04313
Mogensen, M. B., Chen, M., Frandsen, H. L., Graves, C., Hauch, A., Hendriksen, P. V., et al. (2021). Ni migration in solid oxide cell electrodes: review and revised hypothesis. Fuel Cells 21 (5), 415–429. doi:10.1002/fuce.202100072
Noh, H. S., Hwang, J., Yoon, K., Kim, B. K., Lee, H. W., Lee, J. H., et al. (2013). Optimization of current collection to reduce the lateral conduction loss of thin-film-processed cathodes. J. Power Sources 230, 109–114. doi:10.1016/j.jpowsour.2012.12.059
Osinkin, D. A., Kuzin, B. L., and Bogdanovich, N. M. (2010). Effect of oxygen activity and water partial pressure to degradation rate of Ni cermet electrode contacting Zr0.84Y0.16O1.92 electrolyte. Russ. J. Electrochem. 46 (1), 41–48. doi:10.1134/s1023193510010052
Ou, K., Yuan, W. W., Choi, M., Yang, S., and Kim, Y. B. (2017). Performance increase for an open-cathode PEM fuel cell with humidity and temperature control. Int. J. Hydrogen Energy 42 (50), 29852–29862. doi:10.1016/j.ijhydene.2017.10.087
Pichot, E., Olivon, M., Perraud, A., Joubert, O., and Le Gal La Salle, A. (2020). Electrochemical study of the versatility of a solid cell working both as fuel cell and electrolysis modes. Fuel Cells 20 (3), 332–341. doi:10.1002/fuce.201900066
Puig, J., Ansart, F., Lenormand, P., Bailly, N., Georges, S., and Dailly, J. (2014). Barium borosilicate sealing glasses synthesized by a sol-gel process: chemical interactions with a stainless steel and gas-tightness of a SOFC. Fuel Cells 14 (6), 1014–1021. doi:10.1002/fuce.201300289
Reis, S. T., and Brow, R. K. (2006). Designing sealing glasses for solid oxide fuel cells. J. Mater. Eng. Perform. 15 (4), 410–413. doi:10.1361/105994906x117206
Rodriguez, J. A., Hanson, J. C., Frenkel, A. I., Kim, J. Y., and Pérez, M. (2002). Experimental and theoretical studies on the reaction of H2 with NiO: role of O Vacancies and mechanism for oxide reduction. J. Am. Chem. Soc. 124 (2), 346–354. doi:10.1021/ja0121080
Rolle, A., Thoréton, V., Rozier, P., Capoen, E., Mentré, O., Boukamp, B., et al. (2012). Evidence of the current collector effect: study of the SOFC cathode material Ca3Co4O9+δ. Fuel Cells 12 (2), 288–301. doi:10.1002/fuce.201100084
Sanchez, D. G., Ruiu, T., Friedrich, K. A., Sanchez-Monreal, J., and Vera, M. (2016). Analysis of the influence of temperature and gas humidity on the performance stability of polymer electrolyte membrane fuel cells. J. Electrochem. Soc. 163 (3), F150–F159. doi:10.1149/2.0071603jes
Shen, F. Y., Welander, M. M., and Tucker, M. C. (2022). Metal-supported solid oxide electrolysis cell test standard operating procedure. Front. Energy Res. 10, 10. doi:10.3389/fenrg.2022.817981
Simner, S. P., Anderson, M. D., Pederson, L. R., and Stevenson, J. W. (2005). Performance variability of La(Sr)FeO[sub 3] SOFC cathode with Pt, Ag, and Au current collectors. J. Electrochem. Soc. 152 (9), A1851. doi:10.1149/1.1995687
Singh, R. N. (2006). High-temperature seals for solid oxide fuel cells (SOFC). J. Mater. Eng. Perform. 15 (4), 422–426. doi:10.1361/105994906x117224
Timurkutluk, B., Celik, S., and Ucar, E. (2019). Effects of solid loading on joining and thermal cycling performance of glass-ceramic sealing pastes for solid oxide fuel cells. Ceram. Int. 45 (10), 12845–12850. doi:10.1016/j.ceramint.2019.03.207
Timurkutluk, C., Toruntay, F., Onbilgin, S., Atalmis, G., and Timurkutluk, B. (2022). Development of ceramic fiber reinforced glass ceramic sealants for microtubular solid oxide fuel cells. Ceram. Int. 48 (11), 15703–15710. doi:10.1016/j.ceramint.2022.02.105
Vasu, G., Tangirala, A. K., Viswanathan, B., and Dhathathreyan, K. S. (2008). Continuous bubble humidification and control of relative humidity of H-2 for a PEMFC system. Int. J. Hydrogen Energy 33 (17), 4640–4648. doi:10.1016/j.ijhydene.2008.05.051
Weil, K. S., Hardy, J. S., and Koeppel, B. J. (2006). New sealing concept for planar solid oxide fuel cells. J. Mater. Eng. Perform. 15 (4), 427–432. doi:10.1361/105994906x117233
Wu, P. C., and Shy, S. S. (2017). Cell performance, impedance, and various resistances measurements of an anode-supported button cell using a new pressurized solid oxide fuel cell rig at 1–5 atm and 750–850 °C. J. Power Sources 362, 105–114. doi:10.1016/j.jpowsour.2017.07.030
Yang, C. A., Wu, J., Lee, C. C., and Kao, C. R. (2018). Analyses and design for electrochemical migration suppression by alloying indium into silver. J. Mater. Sci. Mater. Electron. 29 (16), 13878–13888. doi:10.1007/s10854-018-9520-3
Yang, Z. G., Xia, G. G., Meinhardt, K. D., Weil, K. S., and Stevenson, J. W. (2013). Chemical stability of glass seal interfaces in intermediate temperature solid oxide fuel cells. J. Mater. Eng. Perform. 22 (10), 2892–2899. doi:10.1007/s11665-013-0731-8
Ye, Y. N., Yan, D., Wang, X. P., Pu, J., Chi, B., and Jian, L. (2012). Development of novel glass-based composite seals for planar intermediate temperature solid oxide fuel cells. Int. J. Hydrogen Energy 37 (2), 1710–1716. doi:10.1016/j.ijhydene.2011.10.011
Zhang, Y. L., Xu, N. S., Tang, Q. M., Gibbons, W., and Huang, K. V. (2022). Evaluation of steam supply performance: steamer vs. bubbler. Front. Energy Res. 10, 10. doi:10.3389/fenrg.2022.963777
Zheng, B., Liu, Y., Sun, P., Tang, S., Zhao, C., Xu, J., et al. (2019). Study on heating performances of steam generator for solid oxide fuel cell using waste heat from solid particles. Int. J. Hydrogen Energy 44 (46), 25221–25228. doi:10.1016/j.ijhydene.2019.03.020
Keywords: water electrolysis, solid oxide electrolysis cell, high temperature, button cell, oxygen ion conducting, standard operating procedure
Citation: Priest CM, Gomez JY, Kane NJ, Hartvigsen JL, Wang L, Ding D, Casteel MJ, Stewart FF and Wu G (2023) Challenges in practical button cell testing for hydrogen production from high temperature electrolysis of water. Front. Energy Res. 11:1278203. doi: 10.3389/fenrg.2023.1278203
Received: 15 August 2023; Accepted: 04 September 2023;
Published: 15 September 2023.
Edited by:
Tong Liu, Wuhan Institute of Technology, ChinaReviewed by:
Libin Lei, Guangdong University of Technology, ChinaKeqing Zheng, China University of Mining and Technology, China
Copyright © 2023 Priest, Gomez, Kane, Hartvigsen, Wang, Ding, Casteel, Stewart and Wu. This is an open-access article distributed under the terms of the Creative Commons Attribution License (CC BY). The use, distribution or reproduction in other forums is permitted, provided the original author(s) and the copyright owner(s) are credited and that the original publication in this journal is cited, in accordance with accepted academic practice. No use, distribution or reproduction is permitted which does not comply with these terms.
*Correspondence: Micah J. Casteel, bWljYWguY2FzdGVlbEBpbmwuZ292; Gang Wu, Z2FuZ3d1QGJ1ZmZhbG8uZWR1
†These authors share first authorship