 Ning Zhou Xu
 Xiang Gao
 Songjian Chai3
- 1Energy Research Institute @NTU, Nanyang Technological University, Singapore, Singapore
- 2The Industrial Training Centre, Shenzhen Polytechnic University, Shenzhen, China
- 3College of Physics and Optoelectronic Engineering, Shenzhen University, Shenzhen, China
- 4Electric Power Research Institute, State Grid Liaoning Electric Power Company Ltd., Shenyang, China
- 5PacificLight Power Pte Ltd., Singapore, Singapore
In deregulated electricity markets, predicting price and load is a common practice. However, market participants and shareholders often seek deeper insights into other system statuses associated with price prediction, such as power flow and market share of generation companies (GenCos). These insights are challenging to obtain using purely data-driven methods. This paper proposes a physics-based solution for the probabilistic prediction of market-clearing outcomes, using real sanitized offer data from the National Electricity Market of Singapore (NEMS). Our approach begins with approximating the generator offers that have been historically cleared. Using this pool of offer data, we propose a probabilistic market-clearing process. This process allows for the probabilistic prediction of market prices. By considering the power system network and its constraints, we also naturally obtain probabilistic predictions of power flow and market shares. We validate our approach using actual NEMS data. Our findings show that while the overall performance of price prediction is comparable to existing methods, our proposed method can also provide probabilistic predictions of other associated system operating conditions. Furthermore, our method enables scenario studies, such as the impact of demand-side participation and the penetration of rooftop photovoltaic (PV) systems on the Uniform Singapore Energy Price (USEP).
1 Introduction
The past few decades have witnessed the liberalization of electricity markets all over the world (Bunn et al., 2021; Yang et al., 2019), including the National Electricity Market of Singapore (NEMS) (Services, 2021; Energy Market Authority of Singapore, 2018). As a fundamental aspect of these markets, electricity price prediction has been the subject of extensive research (Zhao et al., 2008; Abedinia et al., 2017; Wan et al., 2017; Monte et al., 2018; Nowotarski and Weron, 2018; Brusaferri et al., 2019; Chai et al., 2019; Afrasiabi et al., 2020; He et al., 2020; Hong et al., 2020; Li et al., 2020; Fraunholz et al., 2021; Taylor, 2021; Uniejewski and Weron, 2021; Meng et al., 2022; Heidarpanah et al., 2023). However, most existing tools prioritize price prediction, often overlooking the comprehensive insights that additional system parameters, such as power flow and market share of generation companies (GenCos), can offer. The repercussions of such an oversight can be manifold. Without these nuanced insights, prediction models could inadvertently misjudge critical supply–demand imbalances at specific nodes. This, in turn, can lead to potential inaccuracies in price forecasts. GenCos, if left uninformed about these pivotal parameters, might grapple with challenges in streamlining their offer-making decisions, inadvertently paving the way for market inefficiencies. Furthermore, the lack of these comprehensive insights might foster an environment ripe for market volatility, with speculative bidding amplifying price fluctuations.
Over the past 2 decades, prediction techniques have significantly advanced (Zhao et al., 2008; Abedinia et al., 2017; Wan et al., 2017; Monte et al., 2018; Nowotarski and Weron, 2018; Brusaferri et al., 2019; Chai et al., 2019; Afrasiabi et al., 2020; He et al., 2020; Hong et al., 2020; Li et al., 2020; Fraunholz et al., 2021; Taylor, 2021; Uniejewski and Weron, 2021; Meng et al., 2022; Zhou et al., 2022; Heidarpanah et al., 2023). Point forecasting techniques, for instance, have been widely adopted in this field (Abedinia et al., 2017; Fraunholz et al., 2021; Hong et al., 2020; Heidarpanah et al., 2023). In the NEMS, the market operator publishes point forecasts for demand and the Uniform Singapore Energy Price (USEP) (Energy Market Company, 2023). Probabilistic forecasting, however, goes a step further. It reflects the probabilistic and heteroscedastic nature of electricity price and load, providing predictions in the form of intervals (Zhao et al., 2008; Wan et al., 2017; Taylor, 2021; He et al., 2020), quantiles (Uniejewski and Weron, 2021), and densities (Chai et al., 2019; Brusaferri et al., 2019; Li et al., 2020; Afrasiabi et al., 2020). Zhao et al. (2008) and Wan et al. (2017) construct optimal prediction intervals. Taylor (2021) proposes expectile-bounded intervals. He et al. (2020) introduce a method based on a deep neural network model. To address the vulnerability of quantile regression averaging (QRA) to low-quality predictors, a regularized variant of QRA is proposed (Uniejewski and Weron, 2021). Density forecasting, which provides comprehensive uncertainty information, has its own advantages. Chai et al. (2019) propose a reliable strategy for constructing predictive densities oriented toward continuous ranked probability scores. A Bayesian deep learning-based technique is developed by Brusaferri et al. (2019). Li et al. (2020) combine density probabilistic load forecasts to enhance the performance of the final probabilistic forecasts. Afrasiabi et al. (2020) construct a deep neural network (DNN) model from historical data to directly predict the probability density function (PDF) of residential loads based on past time series.
Many AI-based models inherently focus on identifying patterns in historical data, often sidelining real-world grid considerations, such as transmission capacities, voltage limits, and other network-related constraints. This data-driven approach can lead to predictions that, while statistically accurate, are operationally infeasible, particularly in complex scenarios or during events that stress the grid. Furthermore, these models typically struggle to derive additional system parameters, such as local marginal price (LMP), power flow, and the market share of GenCos, which are crucial for a comprehensive understanding of market dynamics. The “black-box” nature of these models also presents challenges in interpretability, making it difficult to understand the rationale behind certain predictions.
In contrast, simulation-based prediction methods, which account for the intricacies of the power system network, offer a way to obtain these additional system parameters. However, there exists limited literature on this topic. Ji et al. (2017) provide a forecasting method from the vantage point of a system operator who has access to system operating conditions. In a short-term forecasting algorithm proposed by Zhou et al. (2011), supply-offer behaviors are assumed static. Quadratic cost function and lossless power flow are also assumed. Bo and Li (2009) investigate the impact of load uncertainty on LMP forecasting. In these studies, GenCos’ offers are often assumed or assigned as fuel-cost-based functions due to the sanitization of generator offer data in a typical electricity market.
One approach to this challenge is to approximate offers from accessible historical data. In Durvasulu and Hansen (2018), generator types are identified and clustered using only publicly available data in the PJM market. Market-based cost functions are then fitted and used in optimal power flow (OPF) calculations to obtain the marginal cost. However, this approach becomes more complicated due to the variability of available data across different markets. For instance, in markets such as the NEMS, the available dataset is more limited. Not only is the generator ID sanitized, but so is the offer quantity. LMP is also not available, as detailed in Figure 3, Section 2.
This paper presents a comprehensive solution for probabilistic market prediction that addresses several key aspects in a single package:
1. It takes into account the issue of data availability and bases the modeling on sanitized data.
2. It incorporates network constraints, enabling the prediction of other system parameters, such as power flow and generator output, which are associated with price prediction.
3. It offers probabilistic prediction on price and other market-clearing outcomes.
4. It serves as a platform for studying future scenarios, including the impact of demand-side participation and increased penetration of renewable energy.
The proposed methodology is validated using real NEMS data. To the best of our knowledge, this work is the first to provide a probabilistic prediction for price, market share, and power flow using real-world sanitized data.
The framework for typical prediction methods is shown in Figure 1A. Figure 1B shows how we address the four points mentioned previously. To tackle the data availability issue (point 1), the first step is to estimate historically cleared offers based on accessible data, for which we develop an optimization method. In the second step, we sort the offer data estimated from the first step using a clustering technique. We derive clusters of functions, representing possible offers using regression, and then assign them to generators, each with associated conditional probabilities. The obtained offer curves enable the calculation of optimal power flow (OPF), addressing point 2. In the final step, we propose a conditional probabilistic market-clearing process. With load forecast as the input and using Monte Carlo simulation, we can obtain probabilistic estimates of price along with other market-clearing outcomes, addressing point 3. Since our methodology is physics-based, we can conduct scenario studies with assumed system parameters, addressing point 4.
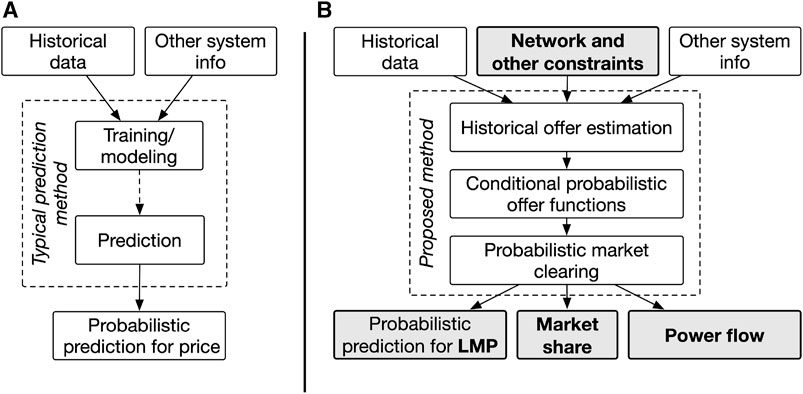
FIGURE 1. Comparison of market prediction methods: (A) typical method for market price prediction; (B) proposed method for comprehensive market prediction.
The remainder of this paper is structured as follows: Sections 2–4 detail the proposed methodology against the backdrop of the NEMS. A solution for the historical offer estimation with sanitized information is proposed in Section 2. The formulation of conditional offer functions is presented in Section 3. A probabilistic clearing process for market prediction is proposed in Section 4. In Section 5, actual NEMS data are used to validate the methodology. Its performance is benchmarked against both classical and advanced prediction methods. In Section 6, future scenarios are studied. Section 7 concludes the paper.
2 Historical offer estimation
2.1 Market basics
In the NEMS, the following data are available either publicly or through subscription (Energy Market Company, 2023; Energy Market Authority, 2023): historical USEP and load for each area, registered information of generating units, overhaul schedule (i.e., generator’s availability) and its marginal price (i.e., offer price cleared historically), daily market share of GenCos, and load forecasts. The 230 kV and 400 kV transmission network lines of the Singapore power system are available in Limited (2016), Joseph et al. (2021), and Global Energy Network Institute, 2023.
Figure 2 shows forms of offers and pricing throughout the market-clearing process, as well as their data availability in the NEMS. Like many modern electricity markets, the NEMS uses nodal pricing. This means that, subject to the physical properties and constraints, electricity price varies across transmission nodes. Unique to the NEMS, while generators are paid the nodal price (local marginal price or LMP), consumers are charged a uniform price to prevent locational disadvantages. This is referred to as the Uniform Singapore Energy Price or USEP.
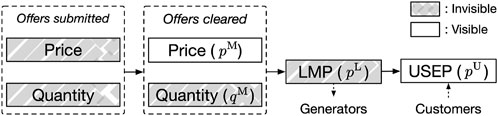
FIGURE 2. Offers and pricing throughout the market-clearing process and data availability in the NEMS.
Definition (Uniform Singapore Energy Price): USEP is the weighted average of LMP over all the nodes that withdraw energy:
where
2.2 Approximating historically cleared offers
An offer in the context of electricity markets consists of a price and its corresponding quantity. As illustrated in Figure 2, in the NEMS, only cleared offer price and historical USEP are available. As outlined in Figure 1, our initial step is to approximate the offers that have been cleared historically. To achieve this, we formulate an optimization problem. The objective of this problem is to approximate the historical quantity (as shown in the second block of Figure 2) in such a way that the resulting USEP estimation closely matches the recorded values (2). In this paper, the terms “offer” and “price–quantity pair” are used interchangeably.
Minimize:
where
In the setup of this problem,
In this paper,
where
where
where
In addition to the typical constraints for DC power flow calculations, such as power limits and balance, and branch limits, the function
where
As can be seen from the aforementioned formulation, the optimization aims to estimate historically accepted offer quantity
2.3 Solution
The solution to the aforementioned problem is illustrated in Figure 3. In the present study, we have chosen to employ the self-adaptive differential evolution (SaDE) algorithm, as detailed in Qin et al. (2009), given its demonstrated efficiency in optimization tasks. One of the primary advantages of SaDE over traditional evolutionary algorithms (EAs) is its intrinsic ability to converge more rapidly. This accelerated convergence is achieved through SaDE’s unique capability to adaptively select learning strategies and fine-tune control parameters throughout the evolutionary process (Qin et al., 2009; Qin and Suganthan, 2005). Unlike many other algorithms that require manual parameter tuning, SaDE’s self-adaptive mechanisms render it more user-friendly and often more robust across a variety of optimization challenges. By dynamically balancing exploration and exploitation phases, SaDE reduces the risk of premature convergence, often a challenge in traditional EAs. Furthermore, the algorithm’s adaptability means that it is less sensitive to initial parameter settings, thereby offering a level of flexibility seldom found in conventional differential evolution approaches. This dynamic and adaptive nature of SaDE ensures a holistic and efficient optimization process, making it a compelling choice for our research.
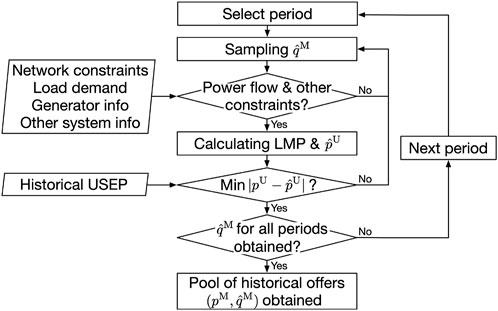
FIGURE 3. Flowchart for calculating cleared offers.
For corroboration, basic EA options, such as the genetic algorithm (GA), are also employed. The power flow can be solved using MATPOWER (Zimmerman et al., 2011). In this problem, the offer quantity is the variable, while the price is given. Therefore, the cost/offer functions for generators are constant functions within each iteration.
3 Conditional probabilistic offer functions
Once the estimated offer quantity
Figure 4 plots the historical price–quantity pairs of a typical generator (the 8th) in the NEMS. It can be observed that most of the time, the cleared offer price is under 300 Singapore dollars per MWh. However, there is also a possibility that the price may exceed 1,000 $/MWh. In this paper, “$” denotes the Singapore dollar.
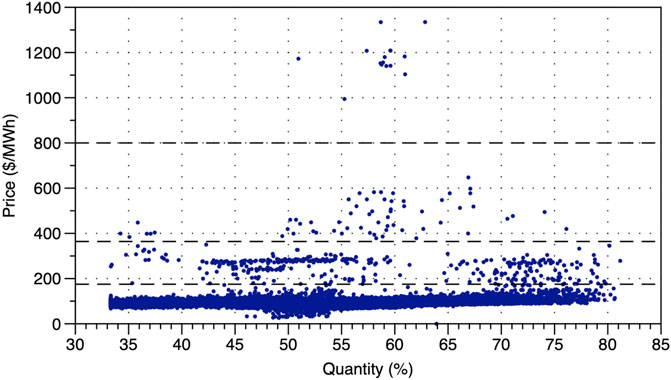
FIGURE 4. Historical price–quantity pairs of a generator in the NEMS (from 1 January 2019 to 30 September 2019).
Second, generators choose their offer submissions based on various market conditions. As a result, these multiple choices of offers need to be modeled. In this part of our model, we form offer clusters and regress offer functions. Each cluster/function is associated with its respective probability. The framework for this step is summarized in Figure 5, with the details provided in the following subsections.
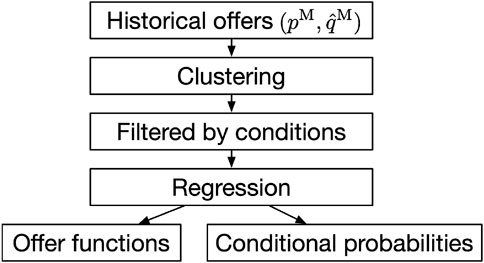
FIGURE 5. Flowchart for obtaining conditional probabilistic offer curves.
3.1 Clustering
To reflect the decision-making process of GenCos, the offers obtained in the first step (Section 2) are classified into clusters. Each cluster represents a group of price–quantity pairs from which a generator might choose its offer. For instance, as depicted in Figure 4, the offers made by generator 8 can be clustered into four groups.
There are many clustering techniques available. In this paper, we use
where
After clusters are formed, an offer function is used as a representation of each cluster.
3.2 Conditional offer-making
Variables that influence electricity prices are listed in Chai et al. (2019). Unlike the Nordic system (Chai et al., 2019), the Singapore power system primarily relies on domestic generation, with no presence of hydropower and nuclear power. Among the accessible data in the NEMS, conditions affecting generators’ offer-making include demand, generation, time of the day, and day of the week. Under these conditions, (10) becomes
where
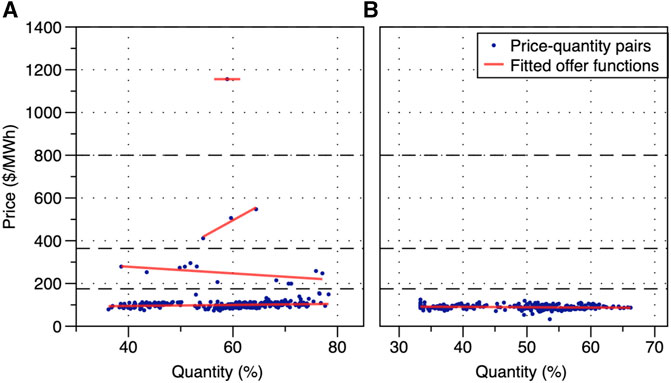
FIGURE 6. Example of offer data and fitted offer functions, under conditions of capacity margin, time of the day, and day of the week. [Offers made between (A) 13:00 and 13:30 and (B) 6:30 and 7:00 of the typical working day from 1 January 2019 to 30 September 2019.].
Within each filtered cluster of the dataset, conditional offer functions can be obtained using either linear or polynomial regression. In this paper, linear regression is used, as illustrated in Figure 6. For this combination of conditions (Figure 6A), the probabilities associated with the four offer functions (from bottom to top) are 94.51%, 4.38%, 1.09%, and 0.36%, respectively. In addition, the set of offer curves varies with the conditions. For example, the offers made by the same generator during an early period of the day could only exist in the lowest cluster, as shown in Figure 6B.
When applying conditions/filters to the offer data, we consider the following:
1) While results could benefit from an increased number of clusters and effective conditions in (11), data points with matching conditions might become sparse as each additional condition may filter out some data points. In this regard, more data are required to ensure that the offer functions obtained from the regression are good representatives of respective clusters. This is especially true for high-price-point clusters since their occurrence is far less frequent.
2) Conditions used are subjected to data availability. Both historical and projected conditions are required. Datasets with matching conditions are selected to perform prediction. In the NEMS, both scheduled generator status and load forecast are available. They are the input of the model (Figure 7). Although price variations, especially price spikes, are more likely to be related to emergencies, the true causes and relevant records are not publicly available in the NEMS. Neither do forecasts on emergencies exist.
3) For conditions such as the total generation capacity
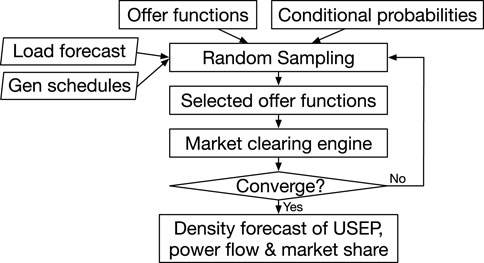
FIGURE 7. Flowchart of probabilistic market-clearing for comprehensive market prediction.
4 Probabilistic market-clearing
The concept of probabilistic market-clearing is integral to our approach. Instead of relying on deterministic values, we employ a probabilistic method that accounts for uncertainties inherent in the electricity market. The crux of our probabilistic market-clearing method lies in the utilization of Monte Carlo simulation. This simulation leverages the conditional offer functions and their respective probabilities, which we previously derived. The process involves multiple iterations, each time selecting offer functions based on their conditional probabilities and subjecting them to random sampling.
For each iteration, the selected offer functions play a pivotal role in market-clearing. Here, we calculate the LMP and USEP using Eq. 3. This iterative method ensures that the resulting solution is stable and reflective of market dynamics. To ensure convergence and computational efficiency, we have set specific criteria: the simulation halts when the change in variance across 1,000 consecutive iterations is less than 0.1%. An upper limit of 1,000,000 iterations is set to prevent excessive computation.
The primary objective of market-clearing in the NEMS, in the absence of demand-side bidding, is to minimize the total cost, represented as
5 Numerical study
Data from the NEMS spanning from 1 January 2019 to 30 September 2019 are used for verification. During this period, there were 46 registered generators in the NEMS, with their capacities ranging from 4.8 to 431 MW. The total capacity was 9.51 GW, and the peak load was 7.24 GW. There were 48 trading/dispatch periods in a day. The proposed methodology is used for day-ahead market prediction. A 3-week dataset is selected for testing, while the remaining datasets are used for modeling.
5.1 Historical offer estimation
The proposed methodology for historical offer estimation (Section 2) is implemented in the MATLAB environment. Offer quantities
Figure 8 shows the histogram of the values of the objective function (1). The average of the USEPs for the 9-month period is 98.28 $/MWh. The mean error between the calculated and actual USEPs ((1)) is 0.084 $/MW (i.e., 0.084% of the average USEP); 99.52% of the cases result in errors less than 1%.
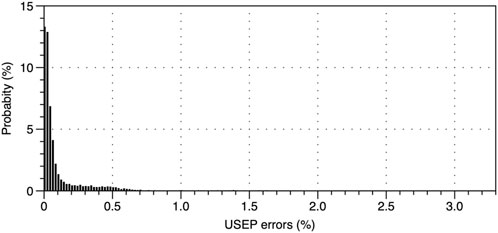
FIGURE 8. Performance of the offer estimation—histogram of USEP errors.
5.2 Comprehensive market prediction results
With the estimated historical price–quantity pairs, we can determine offer functions with conditional probabilities (Section 3), followed by USEP forecasting using probabilistic market-clearing (Section 4). The number of clusters
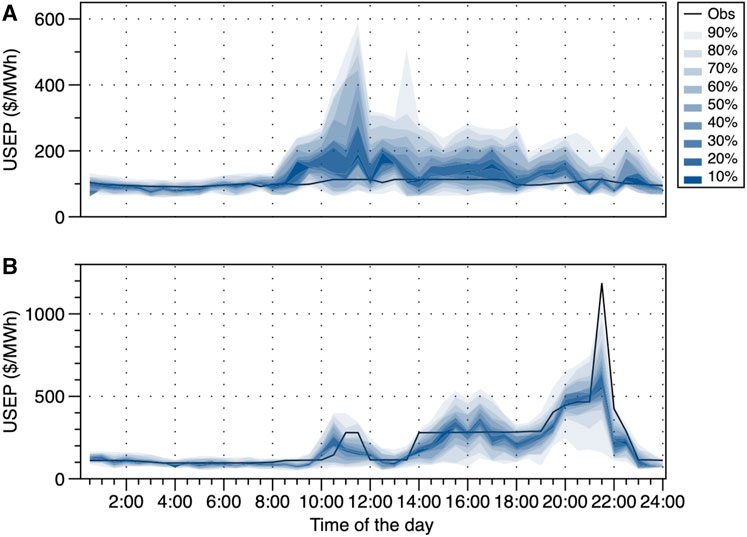
FIGURE 9. USEP prediction results vs. observations: (A) 102nd day (12 April) and (B) 76th day (17 March) in 2019.
For a typical day in the NEMS, the USEP is approximately 100 $/MWh in 2019. However, there are possibilities to witness price spikes, especially during the periods from 10:30 to 12:00 and 13:00 to 14:00. The distribution of the prediction is more converged during the early hours. This is because, historically, the prices during early hours are most likely to settle approximately 100 $/MWh.
Generally speaking, the prediction errors mainly stem from errors in 1) the offer estimation (Section 2) and 2) the clustering, filtering, and linear regression (Section 3). The benchmark for USEP prediction and its comparison with other methods are discussed in the following subsection.
The prediction results for daily market share are shown in Figure 10. The predicted results for typical normal days are close to the mean values (Figure 10A), whereas the prediction is more scattered for a day with price spikes (Figure 10B). This is because generators’ offers are more likely to settle in lower price tiers on a normal day, leading to more converged results, as shown in Figure 10A. This is consistent with the observations in price prediction, as shown in Figure 9. It is important to remember that in the NEMS, only daily market share is available (according to (8)). The calculated market shares for each period and each generator (Section 2) could differ from the actual market shares.
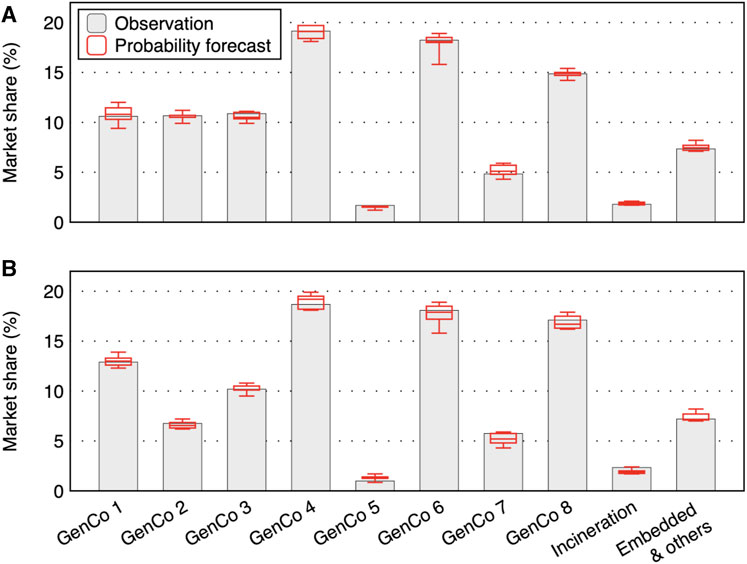
FIGURE 10. Prediction results for daily market share vs. its observation: (A) 102nd day (12 April) and (B) 76th day (17 March) in 2019.
5.3 Performance benchmarking
The performance of USEP prediction is evaluated against both classical and advanced prediction models. These include a basic empirical unconditional density forecast model (EU), a classical time-series model—generalized autoregressive conditional heteroskedastic model (GARCH) with the Gaussian error distribution (Jónsson et al., 2014), and three AI models—an extreme learning machine logistic continuous ranked probability score-based ensemble model output statistics (ELC-EMOS) (Chai et al., 2019), a regularized quantile regression averaging method which utilizes the least absolute shrinkage and selection operator (LQRA) (Uniejewski and Weron, 2021), and a combined model (Combine) (Li et al., 2020).
The continuous ranked probability score (CRPS) is used for benchmarking. The CRPS measures the closeness of forecast distribution to the corresponding observation and is one of the popular indices for measuring the performance of probabilistic prediction (Chai et al., 2019; Li et al., 2020; Afrasiabi et al., 2020; Matheson and Winkler, 1976; Hersbach, 2000; Gneiting et al., 2007; Gneiting and Raftery, 2007; Zhang et al., 2020). The same NEMS data are used for training and testing, respectively. However, network constraints are not considered in the benchmark models. For quantile forecast, quantiles 0.01 to 0.99 are estimated in steps of 0.01.
Table 1 presents a comparative analysis of daily average CRPS for selected testing cases, bifurcated into normal days and days with price spikes. Among the selected 21 testing cases, two groups—normal days and days with spikes—are formed and benchmarked. Among them, 11 are normal days in which the daily average USEP varies from 87.30 to 107.61 $/MWh, and 10 days with price spikes in which the daily average varies from 112.01 to 520.58 $/MWh. The smaller the CRPS score, the better the performance.
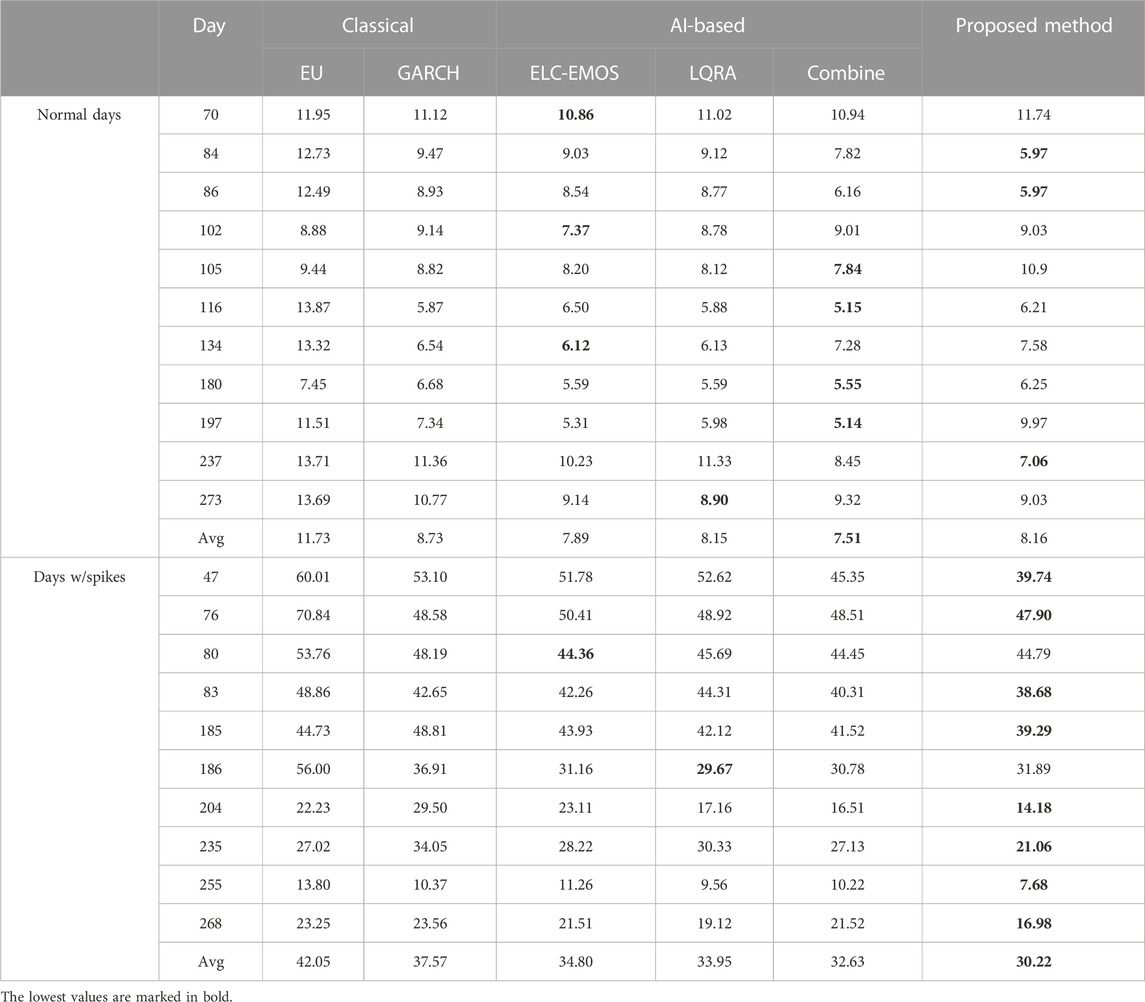
TABLE 1. Daily average CRPS (S$/MWh) benchmarks.
5.3.1 Classical methods
Among the classical methods, the EU stands out for its simplicity, relying on a constant empirical distribution. Information such as
5.3.2 AI-based methods
Turning to AI-based methods, they collectively outperform their classical counterparts. The combined method slightly edges out others in both normal days and days with spikes. This indicates the potential of AI in capturing intricate patterns and nuances in the data.
5.3.3 Proposed method
Our proposed method outperforms, especially during days with price spikes. While it competes closely with AI-based methods on normal days, it takes a clear lead during volatile days. When comparing the proposed method, for normal days, our proposed method is on par with AI-based methods, while AI methods have slight edges. The average CRPSs for ELC-EMOS, LQRA, Combine, and the proposed method are 7.89, 8.15, 7.51, and 8.16 $/MWh, respectively. As discussed in Section 3.1 and Section 3.2, increasing the number of clusters can be one solution to improve the results. The offer information is distilled and represented by a limited number of linear functions. For a given number of explanatory information (i.e., conditional filter
For days with spikes, on the other hand, the proposed method takes a clear lead in terms of CRPS. The average CRPSs for ELC-EMOS, LQRA, Combine, and the proposed method are 34.80, 33.95, 32.63, and 30.22 $/MWh, respectively. This can be mainly attributed to the following reasons: first, USEP in Singapore context is a form of local marginal pricing that considers the grid’s network property, which conventional AI-based prediction models do not take as the input. Compared with normal days in which offers are cleared at similar prices, the network’s effect on LMP becomes pronounced when more generators’ offers are cleared at high price points. As a result, the LMP on the bus increases. As the weighted average of LMPs (1), USEP also increases.
The advantage of our method can be ascribed to two key factors:
Network influence on LMP: The inherent network properties of the Singapore grid play a pivotal role in shaping USEP, especially during high-clearance offers. Traditional AI models (Wan et al., 2017; Chai et al., 2019; Wan et al., 2014) often overlook this constraint. Our method, however, integrates these network effects, leading to enhanced prediction accuracy.
Data constraints on AI models: While AI-based methods typically thrive on large datasets, our study was constrained to 9 months of data. This limitation could pose challenges in tuning AI models, potentially leading to suboptimal performance.
The results underscore the importance of considering network properties and constraints in electricity market predictions. While AI offers promise, its efficacy is often contingent upon data availability. Our proposed method, which seamlessly blends these considerations, emerges as a robust solution, especially during market volatilities.
6 Scenario study
6.1 Impact of demand-side participation
The proposed method also has the advantage of being able to study future scenarios with varied system parameters. For instance, the NEMS is actively considering consumers’ participation in the price discovery process, such as demand-side bidding (Energy Market Authority, 2013). To study the impact, fixed-rate pricing schemes for demand-side bidding are assumed. Apart from the pricing, another influencing factor is the penetration level of the dispatchable load, defined here as the proportion in relation to the annual peak load. In this case, 1% of the penetration level is equivalent to 72.37 MW. The dispatchable load is assumed to be distributed across the whole network in proportion to demand on each node. In our model, it is treated as generators with negative output. A price floor of 300 $/MWh for demand-side bidding in the NEMS is designed to address the potential gaming issue (Energy Market Authority, 2013).
By varying the price and the penetration level of the dispatchable load in the system, the changes in the average USEP can be obtained, as shown in Figure 11. It can be seen from the figure that USEP drops with the demand-side’s participation. For a given amount of dispatchable load, the reduction in USEP decreases with the increase in the bidding price. For instance, with 1% penetration and 300 $/MWh bidding price, the USEP reduction is 1.30 $/MWh (1.32% of the average USEP). Increasing the price up to 500 $/MWh, the USEP reduction remains similar. The impact of demand-side bidding dwindles when its price is between 600 and 1,000 $/MWh. Beyond 1,000 $/MWh, its effect on USEP reduction diminishes. The higher the bidding price, the smaller the chance it can be cleared. This observation becomes more noticeable with higher penetration levels.
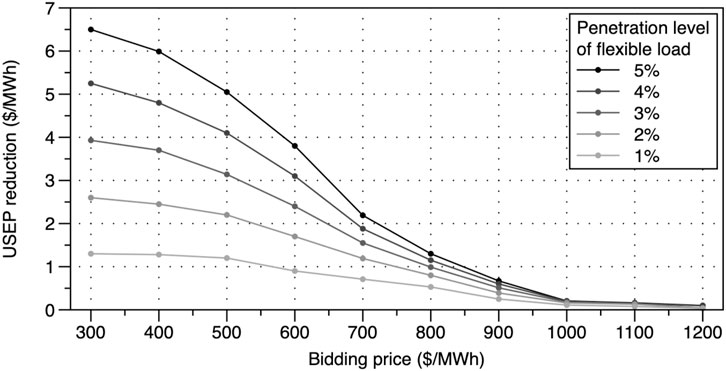
FIGURE 11. Impact of dispatchable load on the USEP, with fixed-rate pricing.
The second observation concerns the penetration level. Given the bidding prices, the USEP continuously reduces as the capacity of dispatchable load increases, but not always in a linear way. When the price is low, for example, 300 $/MWh, the USEP reduction is almost in a linear relationship with the penetration level. As the price increases, especially approximately from 600 to 900 $/MWh, the USEP reduction does not grow in proportion with the penetration level. The explanation is that at lower prices, bids from the demand-side compare favorably with generators. However, at higher price levels, offers from traditional generators start to compete despite increased participation of flexible load. From the aforementioned results, the flexible load can hardly be cleared when the bidding price is higher than 1,000 $/MWh.
6.2 Impact of rooftop PV penetration
Singapore’s access to renewable energy sources is limited, with solar photovoltaics (PVs) being one of the few options. Given the country’s land constraints, rooftop PV installations have become a popular solution. We obtained power measurement data from a typical commercial building equipped with solar panels. This building consumes approximately 60 MWh of energy daily, and its rooftop PV system has a capacity of 1 MWp. Commercial loads account for 35% of the Singapore’s total demand, with the majority located in the central area.
We studied the impact of rooftop PV systems on USEP by assuming that similar PV systems are installed on other commercial buildings. The penetration level of rooftop PV, defined as the installed capacity, ranges from 0 to 1 MWp per 60 MWh commercial load. Offer strategies from GenCos are assumed to remain the same. Table 2 shows the average daily USEP reduction under different rooftop PV penetration levels.

TABLE 2. Impact on USEP of rooftop PV penetration on commercial buildings in Singapore.
The table reveals that an increase in PV capacity indeed lowers the electricity price by reducing demand. The price drop is approximately proportional to the PV penetration level. With the highest coverage (1.0 MWp per 60 MWh of demand), the PV system can support up to 2.46% of the total daily demand on a sunny day (solar radiation intensity ranging from 800 to 1000 W/m2 around solar noon, a typical intensity for clear days in Singapore’s equatorial climate (The National Environment Agency, 2023)). In our experiments, this translates into a modest reduction (0.93%) in the daily USEP.
The limited impact can be attributed to three contributing factors: 1). PV can only operate during daylight hours (approximately 10 h), leaving the USEP unchanged for the remaining periods. Additionally, sunlight availability is not always guaranteed; 2). the penetration of PV is still relatively limited when installed solely on commercial buildings’ rooftops; and 3). the USEP is the weighted sum of LMP across all nodes, which means the overall impact is diluted on average.
7 Conclusion
This paper introduces an innovative analytical method tailored for electricity market prediction, especially in scenarios with incomplete market offer data. Our research underscores the following key findings and contributions:
1. Comprehensive predictions: Beyond price forecasts, our approach furnishes crucial insights into GenCos’ market shares and load flows, adding depth to market predictions.
2. Performance benchmarking: Using real NEMS data, our method displayed superior performance, particularly during price spike events.
3. Scenario analyses: Our studies highlighted the potential of demand-side bidding to mitigate the USEP, with effects varying based on bidding price and dispatchable load capacity. Moreover, rooftop PV implementations on commercial infrastructures were found to exert a modest downward effect on prices due to solar energy limitations and installation capacities.
4. Methodological advantages: The approach stands out for its adaptability to other deregulated electricity markets, even without complete historical offer data. Its provision of added predictive parameters aids market stakeholders in gauging potential market outcomes. Furthermore, its physics-based nature paves the way for diverse scenario studies.
In essence, this work offers a robust and adaptable toolkit for electricity market prediction, promising expansive applications and avenues for future exploration.
8 Future work
While our methodology provides a comprehensive approach to predicting GenCo’s offer-making decisions, it is worth noting that we have based our predictions on a set of factors including demand, generation, time of the day, and day of the week. In real-world scenarios, GenCos often base their decisions on a myriad of factors, especially in situations leading to price hikes. For instance, external factors, such as weather patterns, can significantly influence energy demand, especially with the increasing penetration of renewable energy sources. Similarly, broader economic indicators can hint at potential changes in energy consumption patterns.
To enhance the predictive accuracy of our model, future research endeavors should delve deeper into integrating these additional factors. Incorporating weather data, for example, can provide insights into potential changes in demand due to temperature variations. Similarly, studying economic indicators can give a clearer picture of how broader economic trends might influence energy consumption and, consequently, GenCo offers. While our study has been tailored to the unique intricacies of the Singaporean electricity market, it would be invaluable to apply this methodology to other electricity markets. This would not only test the model’s universal applicability but also highlight potential adjustments required to cater to different market dynamics and structures.
Data availability statement
The raw data supporting the conclusion of this article will be made available by the authors, without undue reservation.
Author contributions
NX: writing–original draft. XG: data curation, formal analysis, and writing–review and editing. SC: writing–review and editing. MN: writing–review and editing.
Funding
The author(s) declare financial support was received for the research, authorship, and/or publication of this article. This work is sponsored by the Scientific Research Startup Fund for Shenzhen High-Caliber Personnel of SZPT (No. 6022310042k).
Conflict of interest
Author MN was employed by State Grid Liaoning Electric Power Company Ltd. Author JY was employed by PacificLight Power Pte Ltd.
The remaining authors declare that the research was conducted in the absence of any commercial or financial relationships that could be construed as a potential conflict of interest.
Publisher’s note
All claims expressed in this article are solely those of the authors and do not necessarily represent those of their affiliated organizations, or those of the publisher, the editors, and the reviewers. Any product that may be evaluated in this article, or claim that may be made by its manufacturer, is not guaranteed or endorsed by the publisher.
References
Abedinia, O., Amjady, N., and Zareipour, H. (2017). A New feature selection technique for load and price forecast of electrical power systems. IEEE Trans. Power Syst. 32 (1), 62–74. doi:10.1109/tpwrs.2016.2556620
Afrasiabi, M., Mohammadi, M., Rastegar, M., Stankovic, L., Afrasiabi, S., and Khazaei, M. (2020). Deep-based conditional probability density function forecasting of residential loads. IEEE Trans. Smart Grid 11 (4), 3646–3657. doi:10.1109/tsg.2020.2972513
Altman, N. S. (1992). An introduction to kernel and nearest-neighbor nonparametric regression. Am. Stat. 46 (3), 175–185. doi:10.2307/2685209
Bo, R., and Li, F. (2009). Probabilistic LMP forecasting considering load uncertainty. IEEE Trans. Power Syst. 24 (3), 1279–1289. doi:10.1109/tpwrs.2009.2023268
Brusaferri, A., Matteucci, M., Portolani, P., and Vitali, A. (2019). Bayesian deep learning based method for probabilistic forecast of day-ahead electricity prices. Appl. Energy 250, 1158–1175. doi:10.1016/j.apenergy.2019.05.068
Bunn, D. W., Inekwe, J. N., and Macgeehan, D. (2021). Analysis of the fundamental predictability of prices in the British balancing market. IEEE Trans. Power Syst. 36 (2), 1309–1316. doi:10.1109/tpwrs.2020.3015871
Chai, S., Xu, Z., and Jia, Y. (2019). Conditional density forecast of electricity price based on ensemble ELM and logistic EMOS. IEEE Trans. Smart Grid 10 (3), 3031–3043. doi:10.1109/tsg.2018.2817284
Durvasulu, V., and Hansen, T. M. (2018). Market-based generator cost functions for power system test cases. IET Cyber-Phys. Syst. Theory Appl. 3 (4), 194–205. doi:10.1049/iet-cps.2018.5046
Energy Market Authority (2023). Energy market authority. [Online]. Available at: https://www.ema.gov.sg/.
Energy Market Authority (2013). Implementing demand response in the national electricity market of Singapore - final determination paper.
Energy Market Authority of Singapore (2018). Intermittency pricing mechanism for intermittent generation sources in the national electricity market of Singapore: final determination paper.
Energy Market Company (2023). Energy market Company. [Online]. Available at: https://www.emcsg.com/.
Fraunholz, C., Kraft, E., Keles, D., and Fichtner, W. (2021). Advanced price forecasting in agent-based electricity market simulation. Appl. Energy 290, 116688. doi:10.1016/j.apenergy.2021.116688
Friedman, J. H., Bentley, J. L., and Finkel, R. A. (1977). An algorithm for finding best matches in logarithmic expected time. ACM Trans. Math. Softw. 3 (3), 209–226. doi:10.1145/355744.355745
Gao, Y., Zhou, S., Shu, Z., and Beng, G. H. (2017). “Market clearing model for Singapore electricity market incorporating transmission loss,” in 2016 Asian Conference on Energy, Power and Transportation Electrification (ACEPT 2016), Singapore, 25-27 October 2016 (IEEE).
Global Energy Network Institute (2023). Global energy network Institute. [Online]. Available at: http://www.geni.org/.
Gneiting, T., Balabdaoui, F., and Raftery, A. E. (2007). Probabilistic forecasts, calibration and sharpness. J. R. Stat. Soc. B Stat. Methodol. 69 (2), 243–268. doi:10.1111/j.1467-9868.2007.00587.x
Gneiting, T., and Raftery, A. E. (2007). Strictly proper scoring rules, prediction, and estimation. J. Am. Stat. Assoc. 102 (477), 359–378. doi:10.1198/016214506000001437
He, H., Lu, N., Jiang, Y., Chen, B., and Jiao, R. (2020). End-to-end probabilistic forecasting of electricity price via convolutional neural network and label distribution learning. Energy Rep. 6, 1176–1183. doi:10.1016/j.egyr.2020.11.057
Heidarpanah, M., Hooshyaripor, F., and Fazeli, M. (2023). Daily electricity price forecasting using artificial intelligence models in the Iranian electricity market. Energy 263, 126011. doi:10.1016/j.energy.2022.126011
Hersbach, H. (2000). Decomposition of the continuous ranked probability score for ensemble prediction systems. Weather Forecast 15 (5), 559–570. doi:10.1175/1520-0434(2000)015<0559:dotcrp>2.0.co;2
Hong, Y. Y., Taylar, J. v., and Fajardo, A. C. (2020). Locational marginal price forecasting using deep learning network optimized by mapping-based genetic algorithm. IEEE Access 8, 91975–91988. doi:10.1109/access.2020.2994444
Ji, Y., Thomas, R. J., and Tong, L. (2017). Probabilistic forecasting of real-time LMP and network congestion. IEEE Trans. Power Syst. 32 (2), 831–841. doi:10.1109/tpwrs.2016.2592380
Jónsson, T., Pinson, P., Madsen, H., and Nielsen, H. A. (2014). Predictive densities for day-ahead electricity prices using time-adaptive quantile regression. Energies (Basel) 7 (9), 5523–5547. doi:10.3390/en7095523
Joseph, A., Gao, Z., Kong, X., Xu, N. Z., and Ngin, H. T. (2021). Dynamic modelling and simulation of Singapore transmission network (230/400kV). Technology Disclosure, (NTU Ref: 2021-305).
Li, T., Wang, Y., and Zhang, N. (2020). Combining probability density forecasts for power electrical loads. IEEE Trans. Smart Grid 11 (2), 1679–1690. doi:10.1109/tsg.2019.2942024
Matheson, J. E., and Winkler, R. L. (1976). Scoring rules for continuous probability distributions. Manage Sci. 22 (10), 1087–1096. doi:10.1287/mnsc.22.10.1087
Meng, A., Wang, P., Zhai, G., Zeng, C., Chen, S., Yang, X., et al. (2022). Electricity price forecasting with high penetration of renewable energy using attention-based LSTM network trained by crisscross optimization. Energy 254, 124212. doi:10.1016/j.energy.2022.124212
Monteiro, C., Ramirez-Rosado, I. J., and Fernandez-Jimenez, L. A. (2018). Probabilistic electricity price forecasting models by aggregation of competitive predictors. Energies (Basel) 11 (5), 1074. doi:10.3390/en11051074
Nanyang Technological University (2021). High performance computing centre (HPCC). Singapore: Nanyang Technological University. [Online]. Available at: https://ntuhpc.org/.
Nowotarski, J., and Weron, R. (2018). Recent advances in electricity price forecasting: a review of probabilistic forecasting. Renew. Sustain. Energy Rev. 81 (2016), 1548–1568. doi:10.1016/j.rser.2017.05.234
Qin, A. K., Huang, V. L., and Suganthan, P. N. (2009). Differential evolution algorithm with strategy adaptation for global numerical optimization. IEEE Trans. Evol. Comput. 13 (2), 398–417. doi:10.1109/tevc.2008.927706
Qin, A. K., and Suganthan, P. N. (2005). “Self-adaptive differential evolution algorithm for numerical optimization,” in 2005 IEEE Congress on Evolutionary Computation Vol. 2, Edinburgh, UK, 2-4 September 2005, 1785–1791.
Services, S. P. (2021). Open electricity market. [Online]. Available at: https://www.openelectricitymarket.sg.
Taylor, J. W. (2021). Evaluating quantile-bounded and expectile-bounded interval forecasts. Int. J. Forecast. 37 (2), 800–811. doi:10.1016/j.ijforecast.2020.09.007
The National Environment Agency (2023). Meteorological service Singapore. [Online]. Available: http://www.weather.gov.sg.
Uniejewski, B., and Weron, R. (2021). Regularized quantile regression averaging for probabilistic electricity price forecasting. Energy Econ. 95, 105121. doi:10.1016/j.eneco.2021.105121
Wan, C., Niu, M., Song, Y., and Xu, Z. (2017). Pareto optimal prediction intervals of electricity price. IEEE Trans. Power Syst. 32 (1), 817–819. doi:10.1109/tpwrs.2016.2550867
Wan, C., Xu, Z., Wang, Y., Dong, Z. Y., and Wong, K. P. (2014). A hybrid approach for probabilistic forecasting of electricity price. IEEE Trans. Power Syst. 5 (1), 463–470. doi:10.1109/tsg.2013.2274465
Yang, J., Zhao, J., Wen, F., and Dong, Z. (2019). A model of customizing electricity retail prices based on load profile clustering analysis. IEEE Trans. Smart Grid 10 (3), 3374–3386. doi:10.1109/tsg.2018.2825335
Zhang, H., Liu, Y., Yan, J., Han, S., Li, L., and Long, Q. (2020). Improved deep mixture density network for regional wind power probabilistic forecasting. IEEE Trans. Power Syst. 35 (4), 2549–2560. doi:10.1109/tpwrs.2020.2971607
Zhao, J. H., Dong, Z. Y., Xu, Z., and Wong, K. P. (2008). A statistical approach for interval forecasting of the electricity price. IEEE Trans. Power Syst. 23 (2), 267–276. doi:10.1109/tpwrs.2008.919309
Zhou, F., Huang, Z., and Zhang, C. (2022). Carbon price forecasting based on CEEMDAN and LSTM. Appl. Energy 311, 118601. doi:10.1016/j.apenergy.2022.118601
Zhou, Q., Tesfatsion, L., and Liu, C. C. (2011). Short-term congestion forecasting in wholesale power markets. IEEE Trans. Power Syst. 26 (4), 2185–2196. doi:10.1109/tpwrs.2011.2123118
Zhou, S., Shu, Z., Tan, K., Gooi, H. B., Chen, S., and Gao, Y. (2016). “Study of market clearing model for Singapore’s wholesale real-time electricity market,” in 2016 IEEE International Conference on Power System Technology (POWERCON 2016), Wollongong, Australia, September 2016 (IEEE).
Zimmerman, R. D., Murillo-Sánchez, C. E., and Thomas, R. J. (2011). MATPOWER: steady-state operations, planning, and analysis tools for power systems research and education. IEEE Trans. Power Syst. 26 (1), 12–19. doi:10.1109/tpwrs.2010.2051168
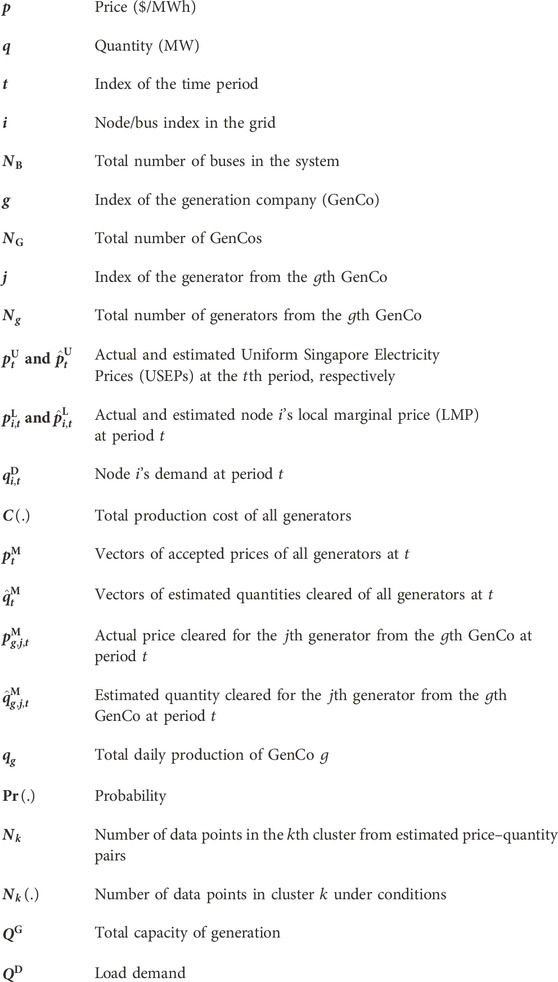
Nomenclature
Keywords: electricity market, probabilistic forecast, market clearing, market share, Monte Carlo simulation, National Electricity Market of Singapore, self-adaptive differential evolution, k-means clustering
Citation: Xu NZ, Gao X, Chai S, Niu M and Yang JX (2023) Leveraging sanitized data for probabilistic electricity market prediction: a Singapore case study. Front. Energy Res. 11:1296957. doi: 10.3389/fenrg.2023.1296957
Received: 19 September 2023; Accepted: 30 October 2023;
Published: 15 November 2023.
Edited by:
Bin Zhou, Hunan University, ChinaReviewed by:
Da Xu, China University of Geosciences Wuhan, ChinaJianqiang Luo, Guangdong University of Technology, China
Copyright © 2023 Xu, Gao, Chai, Niu and Yang. This is an open-access article distributed under the terms of the Creative Commons Attribution License (CC BY). The use, distribution or reproduction in other forums is permitted, provided the original author(s) and the copyright owner(s) are credited and that the original publication in this journal is cited, in accordance with accepted academic practice. No use, distribution or reproduction is permitted which does not comply with these terms.
*Correspondence: Xiang Gao, Z2FveGlhbmdAc3pwdS5lZHUuY24=