 Hailin Yang1*Xu Tian1Fei Liu1Liantao Liu1Lixin Li2Qian Wang2
- 1Economic and Technological Research Institute of State Grid Qinghai Electric Power Company, Xining, Qinghai, China
- 2China Electric Power Research Institute, Beijing, China
To optimize the energy supply potential and complementary advantages of distributed energy, this paper focuses on the dispatching optimization of cogeneration virtual power plant considering uncertainty. First of all, wind power, photovoltaic, combined heat and power (CHP) units, electric boilers, and controllable loads are integrated into a CHP virtual power plant. Then, carbon capture and electric-to-gas devices are introduced to realize carbon recycling. Furthermore, quantify the risk of real-time dispatching of virtual power plants through uncertainty scenario generation and conditional value at risk (CVaR) theory, and the multi-objective stochastic dispatching optimization model of virtual power plants is built with the aim at minimizing the operation cost, carbon emissions, and operation risk as the objectives, and the CRITIC weighting method is adopted to solve it. Finally, the calculation results show that: 1) the electric boiler can use wind and photovoltaic power to supply heat for the system, reduce the dependence of the virtual power plant (VPP) on the CHP unit, and make the electric output of the unit more flexible. 2) The risk quantification method proposed can fully measure the risk situation in real-time dispatching, arrange the wind and photovoltaic power generation plan and backup plan more reasonably, and enable the VPP to get more benefits while avoiding the risks in real-time dispatching.
1 Introduction
Distributed energy is energy efficient, less polluting, more flexible, and larger in scale, and is the key to alleviating the energy shortage in China (Bin et al., 2021). But distributed energy has characteristics of small capacity, large quantity, and uneven distribution, which makes it hard to involve in power grid dispatching directly (Yingxuan et al., 2021). Virtual power plants (VPPs) use advanced communication technology to realize the aggregation of different distributed energy sources, effectively play the complementary ability of various resources in time and space, and fully excavate the energy supply potential of distributed energy sources (Yafei et al., 2023).
Moreover, every winter heating period, combined heat and power (CHP) units in Northeast China often operate in the mode of “power determined by heat”, which causes the waste of wind power and photoelectric resources (Jun et al., 2023). If CHP units and various distributed energy sources are aggregated into a CHP-VPP, the complementary advantages between resources can be used to achieve “thermoelectric coupling” and promote the consumption of renewable energy. Many scholars have now studied the optimal dispatching of CHP-VPP (Shitong et al., 2022; Hamzeh and Sadegh, 2023; Kumar et al., 2023). In Ref. (Fang et al., 2020), electric storage devices (ESDs), wind power plants (WPPs), photovoltaic power plants (PV), and controllable loads are aggregated into a CHP-VPP, and a VPP dispatching optimization model with the goal of maximizing economic benefits is established. In Ref. (Wang et al., 2023), the CHP-VPP is equipped with electric boilers to absorb wind power, and the scheduling optimization model of CHP-VPP is established with the objective of minimum economic costs. The above documents only focus on the economic benefits of VPPs. However, in the background of “carbon peaking and carbon neutrality”, carbon emission will be a key indicator for optimizing VPP dispatch (Guo et al., 2022).
In recent years, the maturity of carbon capture and power to gas (P2G) technology has provided an effective way for the low-carbon development of VPPs (Caixia et al., 2021; Xiaojie et al., 2023). In Michael et al. (2022); Liu et al. (2023), the thermal power units and carbon capture equipment are combined into carbon capture units, which promotes the utilization of wind power and makes carbon emission reduction more significant. In Yungao et al. (2022); ZhangHu (2022), P2G is used to utilize excess wind power generation and convert CO2 into CH4, effectively reducing VPP carbon emission. The above literature provides a theoretical basis for the incorporation of carbon capture and electricity to gas into VPPs, but does not consider the combined use of the two to achieve carbon cycle. In Qingyou et al. (2021), although carbon cycle is realized through a gas power plant carbon capture (GPPCC) device and P2G, the influence of the coupling operation mode of GPPCC and P2G on the degree of carbon cycle is not considered. To solve the problem, carbon storage device is introduced to decouple CO2 capture and treatment process, and a hydrogen storage device is introduced to realize time shift of renewable energy power (Liwei et al., 2022; Shuaishuai et al., 2022). Therefore, if the carbon storage and hydrogen storage devices are used together with GPPCC and P2G, it will effectively decouple the carbon capture and electricity to gas processes, and maximize the carbon emission reduction potential.
To solve the problems in the aforementioned analysis, this paper proposes an optimal scheduling method for CHP-VPP considering carbon capture and P2G. First of all, GPPCC and P2G are introduced in the CHP-VPP for carbon recycling, and carbon storage and hydrogen storage units are added to decouple carbon capture from the power generation and gas production process. Then, the risk of VPP real-time dispatching is quantified through the generation of uncertainty scenarios and CVaR theory. With the operation cost, carbon emission, and operation risk as the objectives, a multi-objective stochastic dispatching optimization method of CHP-VPP is propounded, and the CRITIC weighting method is used to address it. Finally, a simulation is designed to validate the conclusiveness and applicability of the proposed method.
2 VPP structure and modeling
2.1 Structure description
The CHP-VPP in this paper mainly includes distributed power/heat output module and carbon cycle module. The distributed power/heat output module includes distributed wind power and photovoltaic, electric boiler, controllable load, and the power storage device. Carbon cycle module mainly includes the gas CHP unit, GPPCC, P2G, and gas storage device. The VPP realizes the recycling of CO2 through GPPCC and P2G. GPPCC captures CO2 generated by the CHP unit, and P2G converts CO2 into CH4. The carbon storage and hydrogen storage devices can be used to store excess CO2 and H2 at a certain time, so as to decouple carbon capture and electric conversion process. The electric boiler can use the surplus renewable energy to generate electricity to supply heat for the system, reduces the dependence of VPP on the heat output of CHP unit, and increases the flexibility of CHP unit operation. The controllable load and power storage device can cut peak and fill valley, and provide spare output for VPP. Figure 1 shows the energy flow diagram of CHP-VPP.
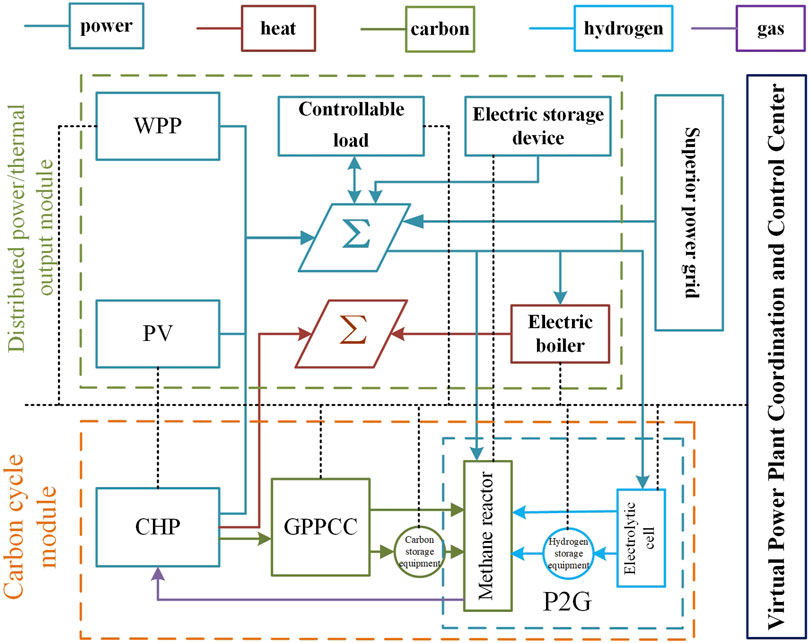
FIGURE 1. Energy flow diagram of the VPP.
VPP coordination control center conducts information interaction with each unit in the VPP through communication technology, so that it can sense the operation status of each device and issue dispatching instructions to each unit. On this basis, the VPP forecasts the WPP and PV output of the next day, and then consider the operating status of each unit, the demand for VPP internal electrical load and thermal load, and formulate the next day’s operation plan of each unit and form the next day’s electricity purchase and sale strategy in the public grid.
2.2 Operation modeling
2.2.1 Distributed power/thermal output module modeling
The distributed power/thermal output module is mainly responsible for meeting the electric heating load of the system by calling various distributed energy sources. Among them, the electric boiler is an auxiliary heating equipment for “thermoelectric decoupling”. Controllable loads and power storage devices can be used as flexible resources to follow the change of WPP and PV output. In addition, the power storage device can be charged during low price hours and discharged during peak price hours to promote the use of renewable energy.
(1) Distributed WPP and PV modeling
In this study, the distributed WPP is modeled as a whole, and the VPP predicts the wind power output of the next day. Therefore, in the process of day ahead dispatching, the declared output of distributed wind turbines should meet the following relationships:
where
In Eq. 2,
where
The principle of distributed photovoltaic modeling is the same as that of the distributed wind power, refer to Eqs 1, 2. The probability distribution function of photovoltaic prediction error will not be repeated in this paper.
(2) Electric boiler
As an auxiliary heating equipment in VPPs, the electric boiler can use wind power generation to meet the thermal load of the system, reduce the dependence of the system on the thermal output of CHP unit, so as to achieve “thermoelectric decoupling”, and increase flexibility in the operation of CHP units. The relationship between the heat generating power
where
(3) Controllable load
Demand response methods include price-based demand response (PBDR) and incentive-based demand response (IBDR). Incentive-based demand response on user side controllable load is primarily considered. Users can sign a contract with the VPP to reduce power consumption during peak hours or increase power consumption during valley hours, and obtain certain benefits. At the same time, users can also provide backup services for the VPP to smoothing the fluctuation of wind power output (Ju et al., 2016).
where
(4) ESD
ESD can realize energy transfer across time periods and coordinate the imbalance between source and load. Among them, the electric energy storage can realize peak load cutting and valley filling through “peak time discharge and valley time charging”, thus the ability of the grid to absorb renewable energy can be improved and the operating cost of VPP can be reduced. The relationship between the storage capacity of the ESD and the charging and discharging shall be in accordance with the following relationship:
where
2.2.2 Carbon cycle module
The carbon cycle module mainly uses the surplus wind power generation for carbon recycling, reducing carbon emissions while cogenerating. Among them, GPPCC will capture CO2 generated by the CHP unit, and P2G will convert CO2 into CH4, which will be supplied to the CHP unit as fuel. The module also includes the carbon storage and hydrogen storage devices, which are used to decouple the generation and processing of CO2. The hydrogen storage devices can realize the time shift of electric energy by storing H2.
(1) CHP unit
The extraction type CHP unit is used to extract some steam from the two stages of the turbine as the heat source for external heating. When the thermal power is fixed, the extraction type unit can adjust the electric power within a certain range, with higher flexibility. However, when the thermal power gradually increases, the adjustable range of electric power will be reduced.
where
The CO2 produced and natural gas consumed can be calculated by Eq. 8:
where
(2) GPPCC
GPPCC energy consumption is directly met by unit output. In order to better control the operation of GPPCC, this paper defines the following operation indicators:
The flue gas
GPPCC operation energy consumption
The flow direction of CO2 in GPPCC is as follows:
where
The energy consumption of GPPCC can be calculated by Eq. 10
where
In addition, GPPCC can store excess CO2 into the carbon storage unit. For the convenience of calculation, the volume
where
where
(3) P2G
P2G mainly includes two processes: electrolytic water and methanation, and energy conversion efficiencies of about 75%–85% for electrolysis of water and 75%–80% for methanization, for a total efficiency of about 45%–60%. In this paper, electrolytic water and methanation are modeled separately, and the specific expression is as follows:
where
P2G stores surplus H2 in the hydrogen storage unit. Therefore, H2 produced by electrolytic water and consumed by methanation can be expressed by Eq. 15
where
Taking
(4) Gas storage device
In this paper, carbon storage and hydrogen storage devices are added to GPPCC and P2G, respectively, which can be used together to flexibly control the two raw materials required for methanation, achieve maximum absorption of wind power generation, and improve the degree of carbon recycling. The modeling of hydrogen and carbon storage devices can refer to the power storage devices, as shown below:
where
3 Multi-objective stochastic dispatching optimization model
3.1 Generation of uncertainty scenarios
Wind and photovoltaic power generation often have strong uncertainty, which will bring risks to the real-time operation of VPPs. Since the uncertainty of new energy output mainly comes from the prediction error, this paper constructs the joint probability distribution function according to the correlation of wind power and photoelectric output error. Then, the inverse transformation method is adopted to generate typical scenarios of wind-photoelectric output, and the random model is transformed into a deterministic model through the generation of uncertainty scenarios while retaining the wind-photoelectric output correlation. In order to take into account the randomness and correlation of the scene output at each moment, the scene output scene is generated.
(1) Constructing the covariance matrix
where
(2) The multivariate normal distribution
(3) According to the probability distribution function in Section 1.2.1, inverting the sample values of each period to obtain the full cycle wind power and photovoltaic forecast error, and the N wind and solar output scenarios are obtained from Eq. 2. Figure 2 is a schematic diagram of the inverse transform.
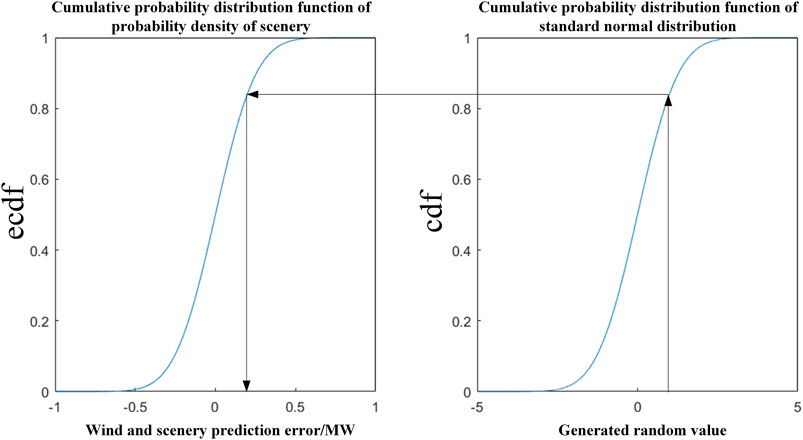
FIGURE 2. Diagram of inverse transform.
Then, in order to reduce the amount of computation, k-means clustering is used to reduce scenes
(1) Initial cluster centers
(2) Each scene and the nearest cluster center are divided into one category, and the center of each category is used as the new cluster center.
(3) If any i or both are satisfied
(4) Repeating steps (1), (2), and (3) for 100 times, and selecting the best clustering result as the final
Finally, the typical output scenarios for wind and PV are combined to obtain the final typical output scenario
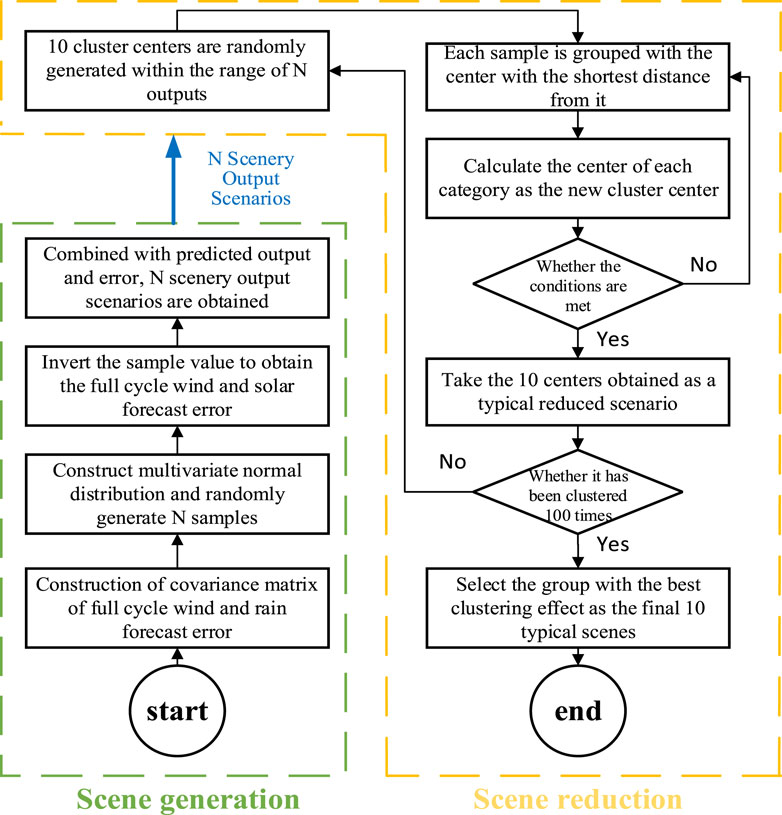
FIGURE 3. Flow chart of uncertainty scenario generation.
3.2 Multi-objective dispatching optimization model
To improve the economy, promote the low-carbon development of VPP, and respond to the national call for “double carbon”, operating costs and carbon emissions are used as the optimization objectives of the VPP in this paper.
(1) Operating cost
The operation cost of the VPP includes the generation cost
The generation cost of the CHP unit includes fuel cost and startup and shutdown cost, which are calculated as follows:
where
The operation and maintenance costs include operation costs of wind power, photovoltaic, GPPCC, P2G, electric boilers, and power storage devices, which are calculated as follows:
where
The controllable load cost includes the response output cost and the standby output cost. The specific calculation is as follows:
where
The revenue from electricity purchase and sale of public grid is calculated as follows:
where
(2) Carbon emissions
Considering that China is still dominated by thermal power generation, the equivalent carbon emissions of purchased public grid electricity are also reckoned in the carbon emissions of CHP-VPP. The expression is written in the following form:
where
The constraints of VPP conventional dispatching model mainly include electric/thermal power balance constraints, CHP unit output constraints, controllable load constraints, equipment operation constraints, and gas storage device constraints.
(1) Electric/thermal power balance constraints
The VPP proposed in this paper includes two kinds of energy flows, electric and thermal, and needs to meet both power/thermal balance constraints.
(2) CHP unit output constraints
The CHP unit output constraints primarily include the upper and lower limit constraints of the unit thermal output, electrical output, and total output:
where
(3) Controllable load constraints
Controllable load constraints mainly include upper limit constraints
where
(4) Equipment operation constraints
The equipment operating constraints consist primarily of upper and lower limit constraints and climb constraints for the GPPCC, P2G, and electric boilers.
where
(5) Energy storage/gas device constraints
Constraints on energy or gas storage devices mainly include energy storage/gas capacity constraints, upper limit of charging and discharging rate constraints, charging and discharging state constraints, and equal energy storage/gas capacity limitations at the beginning and end of the cycle. Taking the gas storage devices as an example:
where
(6) System backup constraints
Because of the uncertainty of variable renewable energy, the conventional dispatching model of the VPP also requires consideration of system reserve constraints. This paper emphasizes the effect of load loss on the system when the actual generation power of wind power and PV is lower than the predicted power. The upper rotation reserve constraint is considered.
where
where
3.3 Multi-objective stochastic dispatching optimization model
Based on value at risk (VaR), CVaR takes into account the distribution of risk outside the confidence level, and can reflect the maximum possible loss in the full probability interval of the portfolio under a given level of confidence. Therefore, in this paper, the CVaR theory is utilized to quantify the risk of load loss in real-time dispatching of VPPs and is used as an optimization objective reflecting the operational risk of VPPs to cope with the uncertainty of variable renewable energy. The approximate formula of CVaR is as follows:
where x and y represent portfolio vectors and random vectors, respectively;
When the analytic formula
where
Risk metrics are often related to the amount and duration of load loss, so by taking the penalty cost of VPP load loss as a loss function, and the specific calculation is as follows:
where
A multi-objective random dispatching optimization model for the VPP is as follows:
4 Multi-objective model solving
The VPP dispatching optimization model has three objectives: operation cost, carbon emissions, and operation risk. The multi-objective model needs to be transformed into the single-objective model, and then the CRITIC weighting method is used to solve the VPP multi-objective optimization model. It is also necessary to linearize the model and dimension the objective function before solving.
4.1 Model linearization
It can be seen from Eq. 9 that the calculation process of
where
Then, by making
where M represents a large enough number. Similarly, the formula for multiplying other binary variable and continuous variable can be linearized.
4.2 Dimensioning of objective function
Since the three objective functions in this paper have different orders of magnitude, the method based on fuzzy satisfaction is used for dimensioning the objective function (Gong et al., 2011). The fuzzy satisfaction theory can reflect the satisfaction degree of the objective function compared with the single-objective optimization, and its principle is to use the membership function of the fuzzy theory to quantify the solution of the objective function. First, each objective function is taken as the optimization object, the single-objective model is solved, and the values of other objective functions are calculated. See Table 1 for details. * denotes that the objective function is used as the optimization object.
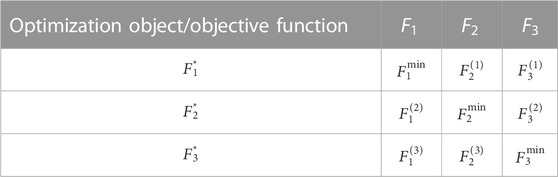
TABLE 1. Input–output of objective function.
The optimal values of each objective function can be obtained from Table 1, namely,
Finally, the objective functions are all optimized in the direction of minimization, and each objective function uses ascending semi-linear membership functions as membership functions. The details are as follows:
where
4.3 CRITIC weighting method
The entropy weight method is the most widely used method for solving VPP multi-objective problems. However, the entropy weight method mainly empowers through the degree of dispersion of each objective, ignoring the horizontal influence generated by the correlation between the objectives. CRITIC is an objective weighting method that considers the impact of index correlation. The principle is to determine the weight according to the contrast strength of the evaluation index and the correlation between the indexes, which can reduce the influence of the correlation between the indexes on the final weight and make the results more objective and reasonable. The general process of the CRITIC method is as follows:
(1) First, suppose there are m plans and n goals, respectively. Taking the solutions of
where
(2) Then, the standard deviation and correlation coefficient were calculated for each target, as follows:
where
(3) Calculating the amount of information contained in each goal and acquiring the weight of each goal, as follows:
where
Finally, the combined objective function is as follows:
5 Example analysis
For the sake of verifying the validity and applicability of the model designed in this study, a simulation is established on MATLAB R2020a and the model is solved using CPLEX solver.
5.1 Example data
For the purpose of this study, an industrial park in Lankao County, Henan Province is selected as the research object. The VPP of the park has two 0.8 MW CHP units, the total capacity of wind and PV is 1.2 MW and 0.4 MW, and the energy storage capacity is 0.1 MW. The maximum response outputs for the electric boiler capacity and controllable loads are 0.15 MW and 0.03 MW, respectively. The maximum operating power of carbon capture device is 0.1 MW, and the maximum operating power of electrolytic cell and methane reactor is 0.3 MW and 0.15 MW, respectively. In the conventional dispatching model, the spinning reserve coefficients of WPP, PV, and load are 0.25, 0.15, and 0.1, respectively. In the uncertain dispatching model, the penalty cost coefficient of load loss is 800 yuan/MW, and the confidence level of the CVaR value is 0.8. Figure 4 shows the wind power, photovoltaic output and electrothermal load predicted by the VPP dispatching center in day ahead. Figures 5, 6 show the actual output scenarios and the reduced typical scenarios of wind charge photovoltaic generated in this paper, respectively. In a typical output scenario for wind and photovoltaic power generation, there is a certain correlation between the output values, while the output values at each time also retain a certain degree of randomness, which is more in line with the actual output of wind power and photovoltaic.
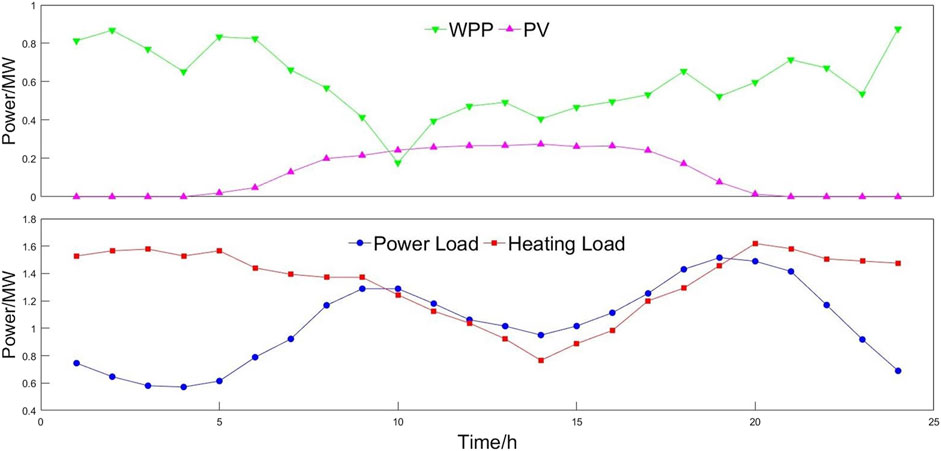
FIGURE 4. WPP and PV output and electric heating load predicted by the VPP dispatching center in the day ahead.
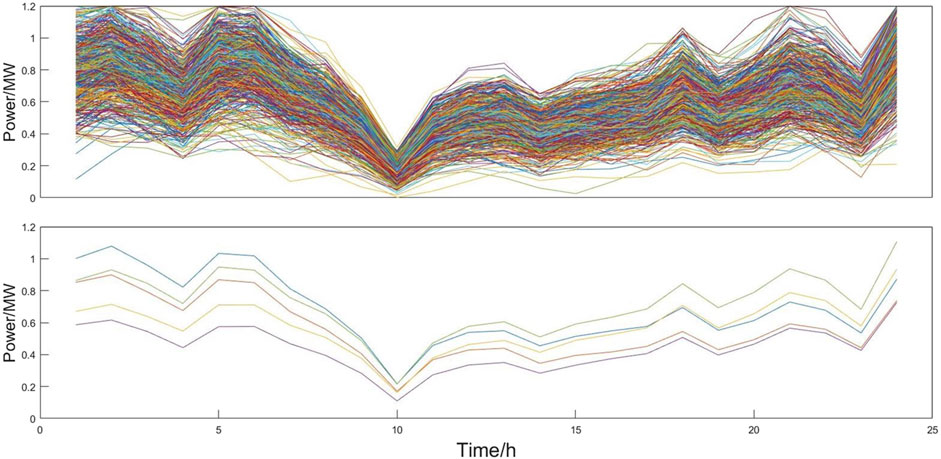
FIGURE 5. Actual output scenarios of wind charge and typical scenarios after reduction.
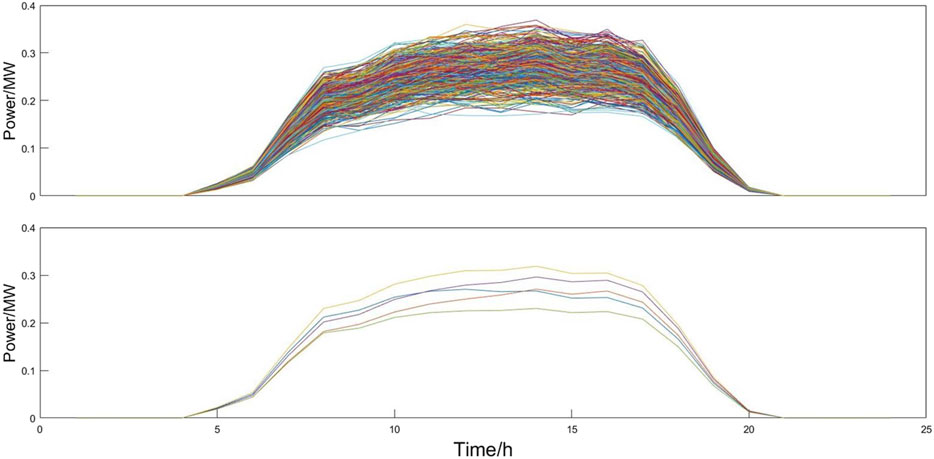
FIGURE 6. Photovoltaic actual output scenarios and typical scenarios after reduction.
5.2 Scenario setting
This paper proposes a carbon recycling module considering the carbon capture device and power-to-gas device, and creatively decouples the generation and utilization process of CO2 through carbon storage and hydrogen storage devices, while realizing the time shift of surplus renewable energy power. In addition, a risk quantification method based on CVaR theory is proposed. For the sake of verifying, the conclusiveness of the method propounded in this study, the following four scenarios are set up for simulation and analysis.
Scenario 1: Basic scenario. This scenario does not include carbon recycling module and the risk quantification method, but the conventional system backup constraint is applied to deal with the uncertainty of new energy.
Scenario 2: Carbon recycling scenario. This scenario introduces the carbon recycling module and does not adopt the risk quantification method in this paper.
Scenario 3: Risk quantification scenario. This scenario adopts the risk quantification method in this paper, without introducing the carbon recycling module.
Scenario 4: Comprehensive scenario. This scenario introduces the carbon recycling module and adopts the risk quantification method.
5.3 Example results
According to the multi-objective weighting method in Section 3, the weights of the objective functions of minimum operation cost, minimum carbon emissions, and minimum operation risk in Scenario 3 and Scenario 4 are 0.26, 0.3, and 0.44, respectively. Since Scenario 1 and Scenario 2 do not use the risk quantification method, and only include the minimum operating cost and the minimum carbon emissions, using the entropy weight method to calculate the weight, which are 0.59 and 0.44, respectively. Table 2 shows the optimization results of each scenario.
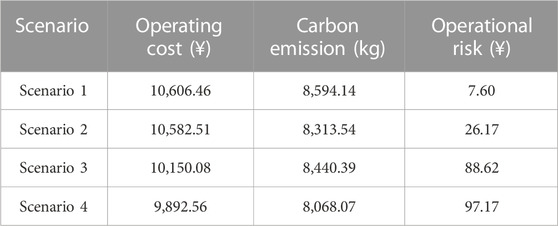
TABLE 2. Optimal results in different cases.
According to Table 2, the operation cost, carbon emissions, and operation risk of Scenario 1 are 10,606.46¥, 8,594.14 kg, and 7.6¥, respectively. Compared with Scenario 1, Scenario 2 utilize the surplus wind power generation to achieve the recycling of CO2 owing to the introduction of carbon recycling module, reduce the fuel cost of CHP units, and reduce the operating cost and carbon emissions by 23.95¥ and 280.6 kg, respectively. Scenario 3 measures the risk level in the real-time operation of the VPP by adopting the risk quantification method, and develops a dispatching scheme with risk and economy, which reduces the operation cost and carbon emissions by 456.38¥ and 153.75 kg, respectively, while the operation risk only increases by 81.02¥. Based on Scenario 2 and Scenario 3, the operating cost and carbon emissions of Scenario 4 are further reduced by 689.95¥, 257.52¥, 245.47 kg, and 372.32 kg. Figure 7 shows the operating power of each unit in the VPP under each scenario.
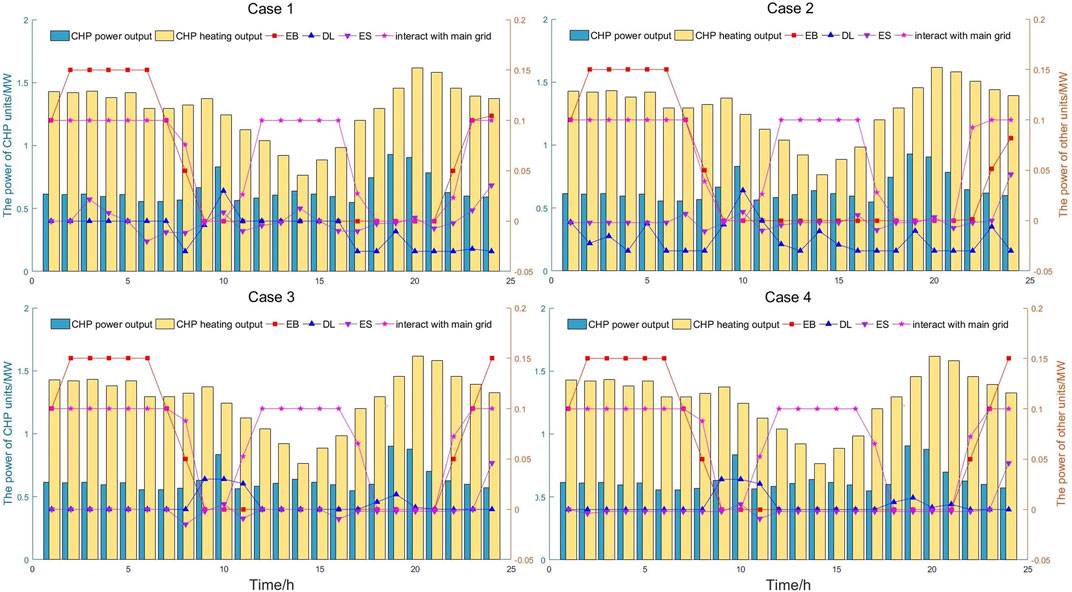
FIGURE 7. Operating power of different units in the four cases.
According to Figure 7, the CHP unit is limited by the thermoelectric ratio and the minimum output, and maintain high output level all the time. The electric boiler uses wind power to supply heat for the system in periods 1–8 and 22–24, and conducts thermoelectric decoupling. The controllable load and power storage device mainly maintain the power balance of the VPP, providing access space for wind power and photovoltaic, and reserve capacity for the VPP. During periods 1–8, 11–16, and 23–24, the output of WPP and PV is high, and VPP sells surplus renewable energy power on the main network. On this basis, this section will further analyze the carbon emission reduction capability of the proposed carbon recycling module and the uncertainty response capability of the risk quantification method. Compared with Scenario 1, the operating power of the CHP unit in Scenario 2 increases slightly, the operating power of electric boilers is higher, and more electric energy is sold in the electricity market. Scenario 2 introduces the carbon recycling module, which requires more power consumption. The consumption of wind power and photovoltaic is greatly increased, increasing of downlink calls of controllable load, to improve the uplink spare space.
Compared with Scenario 1, the operating power of the CHP unit in Scenario 3 is slightly lower, and more electric energy is sold in the power market because Scenario 3 adopts the risk quantification method, and chooses to absorb more scenic calls to improve the economy of VPP, while taking certain risks. Therefore, the number of calls of controllable loads in Scenario 3 is less, to save the backup cost of VPP.
5.3.1 Analysis of GPPCC and P2G carbon recycling capacity
Scenario 2 and Scenario 4 utilize the surplus wind power generation in the VPP through GPPCC and P2G to recycle some CO2 generated by CHP units, reducing the carbon emissions of VPP, and saving the fuel cost of CHP units. The example results show that 293.57 and 360.26 kg of CO2 are recycled in Scenario 2 and Scenario 4, respectively, which fully demonstrates the carbon recycling capacity of GPPCC and P2G. In addition, in order to improve the carbon recycling degree of the VPP, carbon storage and hydrogen storage devices are also considered in the process of carbon recycling to decouple the generation and utilization of H2 and CO2, realizing the time shift of renewable energy power. Figures 8, 9 show the storage of CO2 and H2 and the production of CH4 in Scenario 2 and Scenario 4, respectively.
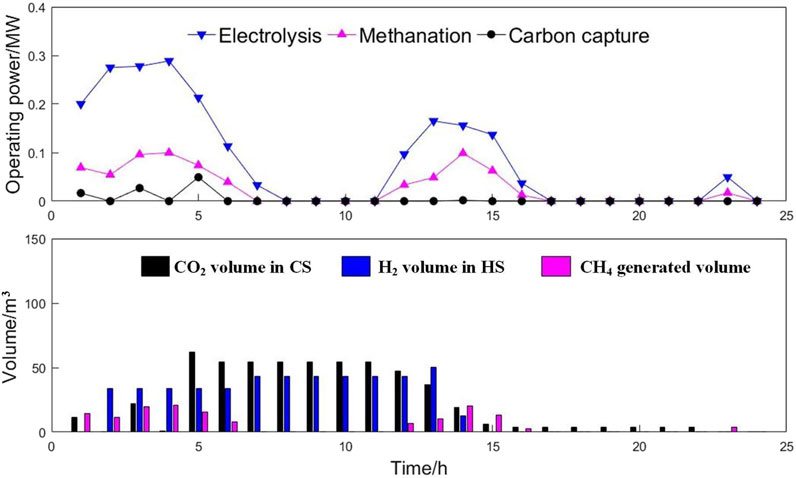
FIGURE 8. Devices’ operating power and gas volume in case 2.
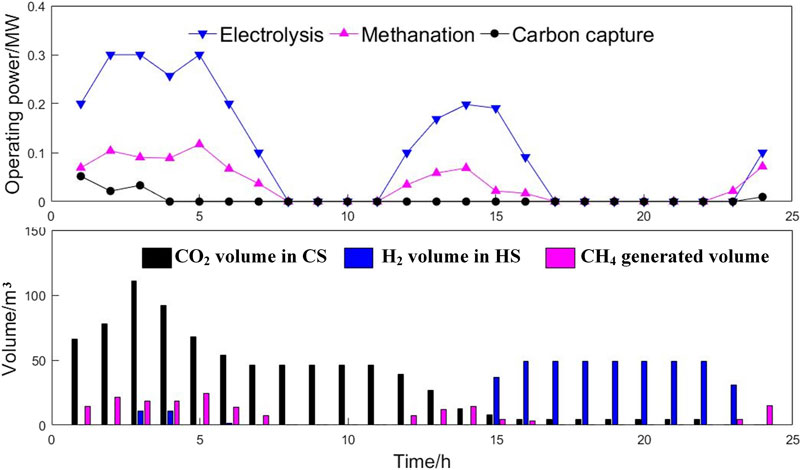
FIGURE 9. Devices’ operating power and gas volume in case 4.
On the basis of Figure 8, to achieve full utilization of renewable energy for power generation, electrolytic water, and methanation are mainly conducted in periods 1–7, 12–16, and 24–25. In addition, the operating power of the equipment in Scenario 4 is slightly higher than that in Scenario 2 due to the risk quantification method. For both scenarios, the operation of electrolytic water, methanation, and carbon capture is relatively independent, and the operation plan can be flexibly arranged according to the WPP output and CHP unit output information in the VPP, to effectively improve the operational efficiency of the carbon recovery module. To reduce the frequent use of carbon capture equipment, the VPP will choose to centrally capture a certain amount of CO2 in periods 1–4 according to the carbon recycling capacity of GPPCC and P2G. However, most of the H2 generated by electrolytic water is produced and used immediately. When there is more renewable energy surplus electricity, storing excess H2 in the hydrogen storage unit, hence the time shift of renewable energy power is achieved. In addition, the periods of CH4 generation and CO2 storage under the two scenarios are roughly the same. However, H2 is mainly stored before time 14 in Scenario 2 and after time 15 in Scenario 4. After fully measuring the risk of VPP real-time operation, so as to take advantage of the renewable energy power available in Scenario 4 for periods 15–16 and 23–24, it is decided to increase the power of electrolytic hydrogen production in periods 15–16, and store the surplus H2 in the hydrogen storage device, during the period 23–24, and H2 is intensively consumed at a high operating power for methanation to produce CH4. Table 3 shows the dispatch results before and after adding the gas storage device for Scenario 4. Figure 10 shows the operating power of each equipment in Scenario 4 without the carbon storage and hydrogen storage units.
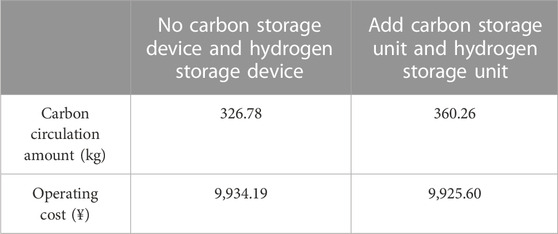
TABLE 3. Optimal results in different cases.
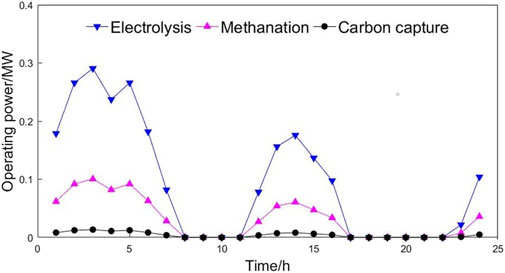
FIGURE 10. Devices’ operating power without HS and CS in case 4.
According to Figure 10, the three processes of carbon capture, electrolytic hydrogen production and methanation are coupled, and the operation flexibility is poor. On the basis of Table 3, although the operation cost has only decreased by 8.59 after the addition of the carbon storage and hydrogen storage units, the amount of carbon recycling has increased by 33.48 kg, and the degree of carbon recycling has increased by 10.25%. Description of the above analysis shows that the carbon recycling method can realize the recycling of CO2, and the carbon storage and hydrogen storage devices can flexibly control the generation and consumption of CO2 and H2, so as to improving the degree of carbon recycling.
5.3.2 Effectiveness analysis of risk quantification methods
Scenario 3 and Scenario 4 use the risk quantification method to measure the risk of VPP operation, thus, the decision maker can formulate a dispatching scheme with both risk and economy. Figure 11 shows the wind power generation plan and upstream backup plan of the VPP under each scenario. It can be seen that Scenario 1 and Scenario 2 adopt the conventional system reserve constraint, and arrange the reserve capacity according to the fixed proportion of the wind power plan output, so that part of the wind power generation cannot be consumed, resulting in a large opportunity cost. Scenario 3 and Scenario 4 adopt the risk quantification method in this paper, which can fully consider the real-time risk situation. Compared with Scenario 1, Scenario 3 arranges more planned output for wind power at the time of 18 and 21, and takes certain risks to obtain greater benefits. Compared with Scenario 2, Scenario 4 arranges more planned output for wind power in time periods 2, 5–7, 18, and 24, and takes certain risks to obtain greater benefits. However, the planned output of wind power will be reduced in time periods 3–4, 8, and 20, and some potential benefits will be given up to avoid the risk of load loss. In addition, compared with Scenario 1–2, Scenario 3–4 can arrange the standby plan according to the risk situation, and the standby output of controllable load is generally low, saving the standby cost for the VPP. The above analysis shows that the risk quantification method in this paper can fully measure the risk situation in real-time dispatching, and more reasonably arrange the wind and solar power generation plan and backup plan, so that the VPP can avoid the risk in real-time dispatching while obtaining more benefits. Figure 12 shows the target values under different confidence levels
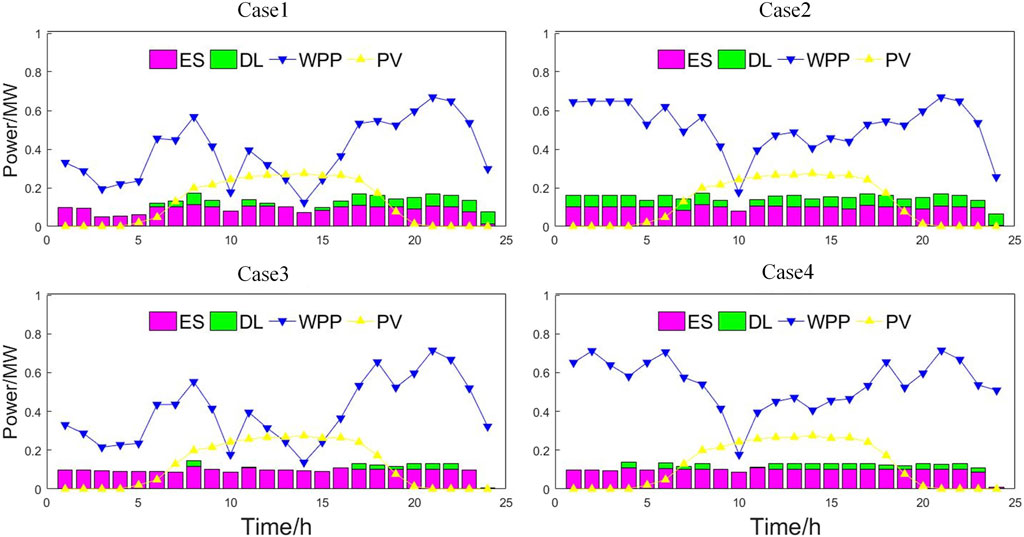
FIGURE 11. Up reserve plan and the plan of wind and photovoltaic power generation in different cases.

FIGURE 12. Objective values with different in case 4.
According to Figure 12, with the increase of confidence, the attitude of decision makers becomes conservative, which makes the operation cost and carbon emissions gradually increase, and the operation risk gradually decreases. While
6 Conclusion
In this paper, GPPCC and P2G are introduced into CHP-VPP, and also the carbon storage and hydrogen storage units are added. Then, based on the uncertainty scenario generation and CVaR theory, the load loss risk of VPP is quantified in real time, and the VPP multi-objective stochastic scheduling optimization model is constructed with the objectives of min operating cost, min carbon emission, and min operating risk. Finally, the credibility and relevance of the model are verified by designing an example, and the conclusions are as follows.
(1) The electric boiler can use wind power generation to supply heat for the system, reduce the dependence of VPP on the heat output of CHP, which makes the power output more flexible, and effectively realize “thermoelectric decoupling”.
(2) The risk quantification method in this paper can fully measure the risk status in real-time dispatching, and more reasonably arrange the wind and solar power generation plan and backup plan, so that the VPP can get more benefits while avoiding the risk in real-time dispatching. The example analysis shows that when the confidence level is (0.6, 0.8), the operating cost and operating risk of the system are in a more appropriate range.
(3) GPPCC and P2G can effectively realize the recycling of CO2, and carbon storage devices and hydrogen storage devices can flexibly control the generation and consumption of CO2 and H2, which can effectively separate carbon capture, electrolytic hydrogen production, and methanation processes to enhance carbon recycling.
(4) The carbon storage and hydrogen storage devices can flexibly control the generation and consumption of CO2 and H2, and their combined use can effectively decouple the carbon capture and electricity to gas processes, while achieving the time shift of renewable energy power, so as to improve the degree of carbon recycling. The example analysis shows that the degree of carbon recycling increased by 10.25% by adding two devices at the same time.
(5) In the future, the influence of new power sources such as concentrating solar power plants on CHP-VPP will be considered.
Data availability statement
The original contributions presented in the study are included in the article/Supplementary Material; further inquiries can be directed to the corresponding author.
Author contributions
HlY and XT: conceptualization, methodology, validation, and writing–review and editing. FL and LtL: visualization and writing–original draft. LxL and QW: investigation and writing–original draft.
Funding
The author(s) declare that no financial support was received for the research, authorship, and/or publication of this article.
Acknowledgments
This work was supported by the State Grid Qinghai Electric Power Company, the Science & Technology project (522830230009).
Conflict of interest
Authors HY, XT, FL, and LaL were employed by Economic and Technological Research Institute of State Grid Qinghai Electric Power Company.
The remaining authors declare that the research was conducted in the absence of any commercial or financial relationships that could be construed as a potential conflict of interest.
Publisher’s note
All claims expressed in this article are solely those of the authors and do not necessarily represent those of their affiliated organizations, or those of the publisher, the editors, and the reviewers. Any product that may be evaluated in this article, or claim that may be made by its manufacturer, is not guaranteed or endorsed by the publisher.
References
Bin, X., Yuemei, L., Renjing, X., and Jianbao, C. (2021). Exploring the driving forces of distributed energy resources in China: using a semiparametric regression model. Energy, 236. doi:10.1016/J.ENERGY.2021.121452
Caixia, T., Jing, W., Shiping, G., Lei, P., Zhongfu, T., et al. (2021). Three-level market optimization model of virtual power plant with carbon capture equipment considering copula–CVaR theory. Energy, 237. doi:10.1016/J.ENERGY.2021.121620
Fang, F., Yu, S., and Liu, M. (2020). An improved shapley value-based profit allocation method for CHP-VPP. Energy, 213. doi:10.1016/j.energy.2020.118805
Gong, J., Xie, D., Jiang, C., and Zhang, Y. (2011). Multiple objective compromised method for power management in virtual power plants.Energies 4(4040700):700–716. doi:10.3390/en4040700
Guo, W., Mao, Y., Zhang, X., and Huan, Y. (2022). Internal benefit optimization model of gas-thermal power virtual power plant under China's carbon neutral target. Energy Sci. Eng. 10 (4), 1227–1239. doi:10.1002/ese3.1097
Hamzeh, F. A., and Sadegh, M. J. (2023). Optimal stochastic operation of technical virtual power plants in reconfigurable distribution networks considering contingencies. Int. J. Electr. Power Energy Syst., 147. doi:10.1016/J.IJEPES.2022.108799
Ju, L., Tan, Z., Yuan, J., Tan, Q., Li, H., and Dong, F. (2016). A bi-level stochastic scheduling optimization model for a virtual power plant connected to a wind–photovoltaic–energy storage system considering the uncertainty and demand response. Appl. Energy, 171. doi:10.1016/j.apenergy.2016.03.020
Jun, P., Xiaoou, L., and Jingjing, H. (2023). Multi-level games optimal scheduling strategy of multiple virtual power plants considering carbon emission flow and carbon trade. Electr. Power Syst. Res., 223. doi:10.1016/J.EPSR.2023.109669
Kumar, A. P., Kumar, V. J., and Jayalakshmi, N. (2023). Real-time and day-ahead risk averse multi-objective operational scheduling of virtual power plant using modified Harris Hawk's optimization. Electr. Power Syst. Res., 220. doi:10.1016/J.EPSR.2023.109285
Liu, D., Xiao, F., Wu, J., Ji, X., Xiong, P., Zhang, M., et al. (2023). Electricity-carbon joint trading of virtual power plant with carbon capture system. Int. Trans. Electr. Energy Syst. 2023, 1–13. doi:10.1155/2023/6864403
Liwei, J., Zhe, Y., Qingqing, Z., Qiaochu, L., Peng, W., Wenxu, T., et al. (2022). Nearly-zero carbon optimal operation model and benefit allocation strategy for a novel virtual power plant using carbon capture, power-to-gas, and waste incineration power in rural areas. Appl. Energy, 310. doi:10.1016/J.APENERGY.2022.118618
Michael, T. A., Lin, L., and Zaiyue, Y. (2022). Data-driven optimal scheduling of multi-energy system virtual power plant (MEVPP) incorporating carbon capture system (CCS), electric vehicle flexibility, and clean energy marketer (CEM) strategy. Appl. Energy, 314. doi:10.1016/J.APENERGY.2022.11899
Qingyou, Y., Xingbei, A., and Jinmeng, L. (2021). Low-carbon economic dispatch based on a CCPP-P2G virtual power plant considering carbon trading and green certificates. Sustainability 13 (22), 12423. doi:10.3390/su132212423
Shitong, S., Mahdi, K. -R. S., Lisa, G. K., Mousa, M., Hamed, N., and Ameena Saad, A. -S. (2022). Day-ahead offering strategy in the market for concentrating solar power considering thermoelectric decoupling by a compressed air energy storage. Appl. Energy, 305. doi:10.1016/J.APENERGY.2021.117804
Shuaishuai, L., Hui, W., Xiangping, M., Chengdong, Y., and Mingyue, W. (2022). Optimal capacity configuration model of power-to-gas equipment in wind-solar sustainable energy systems based on a novel spatiotemporal clustering algorithm: a pathway towards sustainable development. Renew. Energy (1), 201. doi:10.1016/J.RENENE.2022.10.079
Wang, J., Pan, Z., Li, S., Ge, H., Yang, G., and Wang, B. (2023). Optimal scheduling of virtual power plant considering reconfiguration of district heating network. . Electron. 12 (16), 3409. doi:10.3390/electronics12163409
Xiaojie, L., Xueru, L., Wei, Z., and Yi, Z. (2023). Predictive operation optimization of multi-energy virtual power plant considering behavior uncertainty of diverse stakeholders. Energy, 280. doi:10.1016/J.ENERGY.2023.128130
Yafei, W., Weijun, G., You, L., Qian, F., and Yao, W. (2023). Techno-economic analysis of the transition toward the energy self-sufficiency community based on virtual power plant. Front. Energy Res. 11. doi:10.3389/fenrg.2023.1010846
Yingxuan, Z., Zhen, W., Ping, J., and Wu, H. (2021). A distributed two-stage economic dispatch for virtual power plant based on an improved exact diffusion algorithm. Front. Energy Res. 9. doi:10.3389/fenrg.2021.734801
Yungao, W., Jing, W., Gejirifu, D., and Fan, W. (2022). Research on optimal operation model of virtual electric power plant considering net-zero carbon emission. Sustainability 14 (6), 3276. doi:10.3390/su14063276
Keywords: virtual power plant, distributed new energy, conditional value at risk, combined heat and power, carbon capture
Citation: Yang H, Tian X, Liu F, Liu L, Li L and Wang Q (2024) A multi-objective dispatching model for a novel virtual power plant considering combined heat and power units, carbon recycling utilization, and flexible load response. Front. Energy Res. 11:1332474. doi: 10.3389/fenrg.2023.1332474
Received: 03 November 2023; Accepted: 07 December 2023;
Published: 08 January 2024.
Edited by:
Shenbo Yang, Beijing University of Technology, ChinaReviewed by:
Xiaobao Yu, Shanghai University of Electric Power, ChinaHongye Wang, Dalian University of Technology, China
Nie Yan, Lanzhou University, China
Copyright © 2024 Yang, Tian, Liu, Liu, Li and Wang. This is an open-access article distributed under the terms of the Creative Commons Attribution License (CC BY). The use, distribution or reproduction in other forums is permitted, provided the original author(s) and the copyright owner(s) are credited and that the original publication in this journal is cited, in accordance with accepted academic practice. No use, distribution or reproduction is permitted which does not comply with these terms.
*Correspondence: Hailin Yang, Yl96ZXJvMjAyM0AxNjMuY29t