 Xin Wei
 Lianrong Pan
- Guangxi Power Grid Dispatching Control Center, Nanning, China
The ability of fast restoration reflects power system resilience and safety. This paper proposes a partitioning decision-making method for parallel restoration based on the label propagation algorithm and the cooperative game theory. The topological and physical characteristics of blackout systems are considered as the edge weight and the node importance simultaneously for formulating the partitioning model. By the label propagation algorithm, various labels representing different subsystems mark all buses. To accelerate the speed of convergence and prevent the label oscillation, this paper proposes a game strategy of cooperation between buses and subsystems by evaluating the Shapley value of buses. The partitioning constraints are integrated into each label propagation process to assess the feasibility of the partitioning strategy. Finally, case studies on the IEEE 39- and 118-bus test systems and an actual urban power system in South China verify the effectiveness of the proposed method.
1 Introduction
Over the past few decades, several blackouts have happened worldwide, mainly caused by power faults, man-made damages, natural disasters, etc. (Arif et al., 2023; Josip et al., 2022; Yuan et al., 2020). Construction of resilient power system, which has the ability of fast restoration from power outages, is helpful for enhance the system safety Ding et al., 2022. For accelerating the restoration process, system operators and utilities usually adopt parallel restoration strategies, including partitioning, restoration in each subsystem and interconnection of subsystems Wang et al., 2011.Good partitioning results help each subsystem devise efficient restoration strategies. Therefore, determining reasonable subsystems in the partitioning stage is significant for implementing the subsequent parallel restoration strategies Zhao et al., 2020.
According to the characteristics of parallel restoration, the following partitioning principles should be considered Sun et al., 2003; Adibi et al., 1987; Amraee and Saberi, 2017: 1) each subsystem contains at least one blackstart (BS) unit; 2) loads in each subsystem are sufficient to balance the power output of generating units; 3) each subsystem is almost equal in size. Many system operators and utilities have developed partitioning strategies for parallel restoration based on expert experience or geographic information PJM, 2018; Transmission, 2013, lacking theoretical support.
In the existing literature, methods of mathematical programming, heuristic algorithm and complex networks have been used to develop partitioning strategies for parallel restoration. The partitioning problem is usually formulated as an optimization problem. Reference Wang et al., 2011 proposed an ordered binary decision diagram-based method (OBDD) to determine the optimal partitioning scheme. Reference Gu et al., 2019 proposed a bi-level programming model to partition the outage region and restore the power supply. Reference Sun et al., 2016 suggests simplifying power systems by applying graph theory due to the need for node classification or tie line selection in partitioning strategies. The active power of tie lines was a significant factor for developing partitioning strategies. However, the partitioning problem is proved to be a non-deterministic polynomial complete problem (NP-complete) Wang et al., 2011, which cannot be solve by polynomial-time algorithms. The theory of complex networks is suitable for large complex systems and usually used for determining the partitioning schemes. Reference Lin et al., 2011 used the edge betweenness to reflect the relationship between nodes, and applied the Girven Newman (GN) algorithm to develop partitioning strategies. Based on the spectral clustering method, reference Quirós-Tortós et al., 2014 used the corresponding elements of each bus in the Laplace matrix of the power network as the clustering object to obtain the partitioning strategy. The approaches mentioned above helped solve the partitioning problem of parallel restoration. The current situation is that individual factors are considered separately. Either they focus on the power flow of the pre-blackout system or they emphasize the topological structure, such as node importance, edge betweenness, etc. Solely considering power flow characteristics for restoration partitioning decisions may not meet the requirements of restoring subsystems for parallel restoration, such as the size of subsystems. Traditional complex network theory requires prior knowledge of the network’s topology to compute information about edges and nodes. However, after an actual blackout occurs, the loss of communication in the power grid system may prevent the complete acquisition of device information necessary for restoration. This means that the recoverable network structure may not be fully known, making it difficult to make partitioning decisions using traditional complex network theory methods alone. Therefore, it is necessary to consider both topological and physical characteristics in the partitioning method. There is little related work that comprehensively considers both the topological and physical characteristics of power systems.
The challenge of power system partitioning is to classify vast buses considering the requirements of parallel restoration. Reference Quirós-Tortós et al., 2015 defined the free nodes based on the indicator matrix, combined with other nodes in a given subsystem. Reference Ni and Mei, 2008 proposed a control centrality index to select the center bus of each subsystem. Reference Qing, 2015 proposed a label propagation-based controlled islanding algorithm to determine a splitting strategy and used an entropy criterion to evaluate the uncertainties of labels. Reference Huang et al., 2020 proposed a refining method to adjust the boundary nodes if the generating strategy did not satisfy partitioning constraints. These methods can objectively judge the division of power systems. However, they do not analyze the relationship between boundary nodes and subsystems. It does not guarantee that the closely connected boundary nodes are merged into the corresponding subsystems.
Based on the above discussion, this paper applies the label propagation algorithm and the cooperative game theory to determine partitioning strategies for parallel restoration. The label propagation algorithm is suitable for dealing with the classification of vast buses because of its low complexity and excellent partitioning ability Raghavan et al., 2007. The label propagation algorithm assigns an initial value, which can represent a subsystem, to each bus in the system, and iteratively updates the node’s label value based on the similarity and connectivity among buses. The topological and physical characteristics of power systems are considered simultaneously as the similarity and connectivity of buses for the propagation of subsystem labels. However, it is easy to result in oscillations at boundary nodes of subsystems.A critical drawback of the existing research is the lower speed for step-by-step load restoration in the power network Ghiasi et al., 2021.This is attributed to the presence of vast discrete variables related to feeders and loads. Moreover, it may lead to the failure to converge the optimal model, a problem similar to the one addressed in the manuscript. The manuscript focuses on the partitioning problem for parallel power system restoration, which involves handling a large number of possible tie lines while considering the requirements of parallel restoration. In large-scale power systems, increasing the number of subsystems raises the computational complexity of determining partitioning strategies. The label propagation algorithm is difficult to converge due to its low complexity and may easily result in oscillations at boundary nodes of subsystems. This paper discusses the relationship between buses and subsystems and proposes a cooperative game theory to assist the decision-making of boundary buses of subsystems. Buses of power systems are treated as different game players, and subsystems are regarded as coalitions. The Shapley value is used for determining the boundary buses. During the label propagation process, buses collaborate with various subsystems, putting the bus into the coalition that maximizes its Shapley value. The proposed method considers the cooperation and competition among buses regarding their contributions to subsystems, adjusting boundaries of subsystems, and ultimately determining the community structure that maximizes profits as the partitioning strategy for parallel restoration.
The main contributions of this paper are as follows:
1 The effects of the topological and physical characteristics of power systems on the partitioning of parallel restoration are discussed and formulated as significant indexes.
2 A partitioning method based on the label propagation algorithm and the cooperative game theory is proposed considering the cooperative relationship between buses and subsystems.
3 A strategy based on the maximum Shapley value for preventing the label oscillation is developed. It helps improve the convergence rate of the partitioning.
The remainder of this paper is organized as follows. Section II describes the graph representation of a power system. The proposed method is described in Section III. Section IV presents the simulation results for the IEEE 39- and 118-bus test system and an actual urban power system in South China. Conclusions are in Section V.
2 Graph representation of complex power systems
2.1 Simplified standards for power systems
Since developing partitioning strategies of a power system is to classify buses or select tie lines, the power system can be simplified by applying the graph theory. According to the topological and physical characteristics, a complex power system is abstracted as an undirected sparse connected graph by adopting the following simplified standards Sun et al., 2016:
1 The transmission network in a power system is considered, whereas distribution networks are treated as equivalent loads.
2 The power plant, substation, and load-buses in a power system are undifferentiated nodes in the simplified network.
3 All transmission lines and transformers are regarded as undifferentiated and undirected edges.
2.2 Edge weights
The calculation of edge weight includes Pij and Mij.
Pij is the transmission active power of edge i − j and can be calculated from the power flow or obtained from the pre-blackout monitor. In power networks, edges with vast transmission power are the critical edges. Hence, the physical characteristic of power systems can be evaluated by the active power value of edges.
The edge betweenness Mij is usually used to evaluate the hub of edge i − j in a network Lin et al., 2011 The larger Mij of edge i − j, the greater role that edge plays in the network. It reflects the importance of edge i − j in the network and can be calculated by
where σij denotes the number of shortest paths from node i to node j and σij(e) represents the number of shortest paths from node i to node j when edge i − j is removed.
Thus, considering the topological and physical characteristics of edges for partitioning, this paper improves the weight Bij of edge i − j as:
where ω1 and ω2 are the weight coefficient, which can be obtained by the entropy weight method.
2.3 Node importance
The node importance is assessed by Si, S0, and Ndi.
S0 is the base capacity. Si is the sum of the rated capacities of all connecting edges between nodes i and j, and Sij is the rated capacity of all connecting edges between nodes i and j.In power systems, the node capacity ratio si is a significant physical factor for evaluating node i’s importance. The large value of si means that node i has a high transmission power ratio and plays an important role in the power system. It can be obtained by the power flow calculation or the pre-outage monitor, i.e.,
Ndi represents node contraction. In power systems, Ndi refers to the degree of contraction between nodes connected in the power system. The larger the Ndi, the greater the competitiveness of nodes in the network, reflecting the importance of nodes in ensuring network connectivity in the power system. Ndi involves the connectivity and topological structure between nodes. It can be obtained by:
where Ti denotes the actual number of edges between the neighboring nodes of node i, and ki represents the number of neighboring nodes of node i.
Thus, considering the topological and physical characteristics of nodes, the improved node importance of node i is described as:
where ω3 and ω4 are the weight coefficient, which can be obtained by entropy weight method.
In general, Bij reflects the tightness and the energy flow capacity between the corresponding nodes. It is used to calculate the weighted adjacency matrix W. Ci considers the node degree and the power capacity. It is used to compute the node subsystem influence indicator Kis. Then, W and Kis are utilized for iterative computation of the label propagation matrix P. Hence, the topological and the physical characteristics of power systems are considered comprehensively.
3 Partitioning methodology
This section presents the proposed partitioning method based on the label propagation algorithm and the cooperative game theory for parallel restoration. First, the generation of partitioning strategies by using the label propagation algorithm is presented. Then, the determination of boundary of subsystems based on the cooperative game theory is introduced. Finally, the flowchart of the proposed method is given, including the examination of constraints.
3.1 The partitioning strategies based on label propagation algorithm
3.1.1 Theoretical basis
In networks, each node can propagate its label to its neighboring nodes and update its label by the influence of its neighboring nodes. The label propagation process continues until labels of all nodes in the network do not change Zhu and Ghahramani, 2002. There are two issues in the label propagation algorithm: the label information and the label propagation path.
3.1.1.1 Label information
This paper considers the generated subsystems as the information of labels, i.e., a type of label represents a subsystem. For representing the labels of n buses in a power systems, this paper defines a subsystem discriminant matrix F = [fis]n×s.
where S is the number of subsystems and should not be larger than the number of BS units.
3.1.1.2 Label Propagation path
The influence of labels depends on the weight of propagation paths. For an edge with a large weight, the relation of the two nodes at both ends is close. Thus, the effect of one node’s label on the other node is significant. According to Formula 1, the weighted adjacency matrix W of the power network is expressed as:
where wij is the weight between bus i and bus j. The weight of each propagation path depends on the weighted adjacency matrix W.
3.1.2 The generation of partitioning strategies
Based on the number and the location of BS units, the number of subsystems is determined, and the initial subsystem discriminant matrix F0 is obtained.
The weighted adjacency matrix W based on Formula 8 and the set of the node importance C = {C1, C2, … , Cn} based on Formula 6 are calculated. An influence index Kis is proposed to evaluate the effect of the current label on bus i. The propagation matrix P is constructed according to W and Kis, and is updated with the iterations. After each iteration of label propagation, for node i where label changes occurred in this iteration, the influence degree of the current updated subsystem label on node i is accumulated to Kis. For the tth iteration,
where yt,is is the total influence of label s, i.e., subsystem s, on bus i. The influence matrix Y can be calculated by
It is worth noting that K0,is and yt,is are equal to 0. Ft is determined according to the maximum of rows in Yt. Labels propagate among different buses by Pt, until Ft does not change.
The sluggishness in restoring load step-by-step can be attributed to the abundance of discrete variables associated with feeders and loads Ghiasi et al., 2021. Therefore, the oscillation with multiple labels is easy to occur during the process of labels propagating. It reduces the speed and accuracy of convergence. The reason is that the propagation of subsystem labels only considers the influence of neighboring buses. If the influence between two adjacent buses is close, the label oscillation of corresponding buses occurs. Thus, the label propagation algorithm cannot be applied directly to the problem of generating multiple subsystems.
3.2 Determination of boundaries based on cooperative game theory
By using the label propagation algorithm, some buses occur oscillation, which results in the inability to determine the boundaries of subsystems. Which subsystem the oscillation bus should be divided into can be modeled as a cooperative game problem.
Cooperative game theory can determine the cooperation between players and coalitions (groups of players). The cooperation between players and coalitions can in-crease the coalitions’ total profit. A hierarchical clustering algorithm for the cooperative game was proposed to reveal the network community Zhou et al., 2015. A community formation game-theoretic framework with the gain function and the loss function was proposed to evaluate the possibility of nodes joining a community Chen et al., 2011.
In a coalition, the profit is allocated to different players according to the distribution agreement. Shaply value is the only definite solution for transferable profit with coalitions. It provides a unique and fair solution to the cooperation among the players in a cooperative game, considering the relative importance of each player to the game. Thus, the Shapley value of a player accurately reflects the marginal value that the player contributes to the game. The larger the Shapley value of the player, the greater contribution of that to the coalition.
A cooperative game strategy Cg=(n, v) consists of n players and a characteristic function v. The Shapley value of player i in coalition s, i.e., X (s,i), is represented as:
where |s| is the number of players in the coalition s; v(s) is the cooperation profit of coalition s including player i, whereas v(s\i) is that without player i; W (|s|) is the average contribution factor. “!” represents the calculation of factorial. The more contributions of player i, the more profits can be obtained by player i. Thus, the Shapley value of play i can be used as the average of the marginal contributions of player i joining in each possible coalition.
For the partitioning problem of a power system in this paper, buses are regarded as the players, and subsystems are treated as the coalitions. Each bus tries to join in each subsystem to cooperate with the other buses in the corresponding subsystem. The Shapley value represents the closeness of a bus and the other buses in the same subsystem. Thus, it indicates the contribution of buses for system partitioning. If the Shapley value of a bus in one of all subsystems is larger than that of the bus in the other subsystems, the bus should be divided into the corresponding subsystem.
According to the partitioning result in each iteration of labels propagating, this paper uses the dynamic load rate Ri,s and the node contraction Ndi for evaluating the profit of each subsystem:
where aij denotes the connection between buses i and j. If there is an edge between i and f, aij = 1; otherwise, aij = 0. The importance degree f(i) of bus i in subsystem s is defined as:
where Ls is the total loads in subsystem s; PDi is the load at bus i. If bus i is not in subsystem s, Ri,s equals 0.Ndi can be obtained by Formula 5.
Here is a small test system for explaining how boundaries of subsystem are determined by the Shapley values. Figure 1 shows that the IEEE 9-bus test system is divided into two subsystems, including 3 generators, 9 buses, 3 transformers, and 6 lines. According to the label propagation algorithm, buses 1, 3, 4, 5, 6, and 9 are located in subsystem S1, while buses 2, 7, and 8 are located in subsystem S2. The X values of buses are
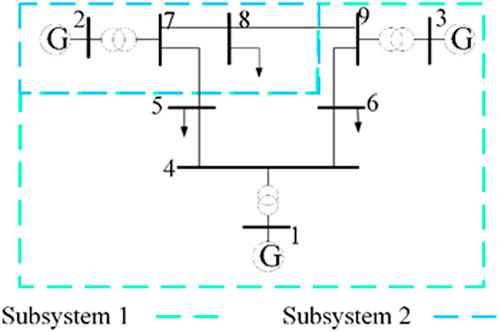
Figure 1. The partitioning scheme of the IEEE 9-bus system.
In the next iteration of label propagation, the X values of buses 1, 2, 3, 4, and 6 do not increase further. However, if bus 9 is divided into subsystem 2, its X value is 1.175, which is smaller than that of 2.37 in subsystem 1. Thus, bus 9 should return subsystem 1. Moreover, if bus 5 is divided into subsystem 2, its X value is 1.29, which is greater than that of 1.105 in subsystem 1. Thus, bus 5 should be divided into subsystem 2. Ultimately, the X values of all buses do not increase with the propagation of labels. The partitioning strategy is S1 =
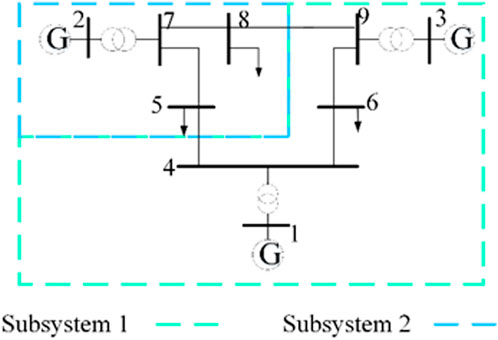
Figure 2. The improved partitioning scheme of the IEEE 9-bus system.
3.3 Flow chart
Based on the label propagation algorithm and the cooperative game theory, this paper proposed a novel partitioning method for parallel restoration. The label propagation algorithm with the characteristic of low computational complexity can reduce the solution space of the cooperative game, and avoid huge subsystems or meaningless subsystems. Especially, the Shapley value of buses can deal with the label oscillation, which is a common disadvantage of the label propagation algorithm. Hence, the proposed partitioning method for parallel restoration has low complexity, excellent classification ability, and fast convergence speed.
The proposed partitioning approach is shown in Figure 3, including 6 steps.

Figure 3. The flow chart of the partitioning method.
Step 1. Initialize the edge weight Bij, node importance Ci, and weighted adjacency matrix W. Data about the topology and the operating condition before the blackout are input to construct the label propagation matrix P0 and the subsystem discriminant matrix F0. Initial subsystems are determined based on the BS units.
Step 2. Initialize the X value of all buses. In the initial stage of labels propagating, only the buses of BS units have the subsystem labels. It means that each initial subsystem has a bus. The BS unit-bus in each subsystem cannot cooperate with other buses out of the corresponding subsystem. Thus, their X values are 0, i.e., X(s0,i) = 0. For other buses, they do not belong to anyone subsystem. Hence, the initial X value of every bus except the BS unit-bus is also equal to 0.
Step 3. Construct the label propagation strategy base on Formula 11.
Step 4. A bus marked by the label can cooperate with each subsystem in each label propagation process. The X value of each bus is calculated based on Formula 12. According to the maximum X value of a bus cooperating with different subsystems, the affiliation of the corresponding bus is determined.
Step 5. The feasibility of the generating partitioning strategy is evaluated by partitioning constraints, including BS constraint, power balance constraint, subsystem size constraint, observability constraint, and network topology connectivity constraint. If all constraints are met, go into step 6; otherwise, return to step 3 for the next iteration without updating P.
Observability constraint: Since the system condition should be monitored during the process of power system restoration, all buses should be observed by the phasor measurement units (PMUs). Although the outage system is divided into multiple subsystems for parallel restoration, all buses in each subsystem should be also observed by PMUs. The observability constraint is
where ri indicates whether there is a PMU at bus i. If edge i-j is within the subsystem, zij = 1; otherwise, zij = 0.
Network topology connectivity constraint: Each generated subsystem should be a connected network; otherwise, it cannot be called a subsystem.
where J is an S× S matrix. A =
Subsystem size constraints: Parallel restoration is to partition the outage system into multiple small subsystems for service restoration. The effect of parallel restoration relies on the subsystem with the longest restoration time. Huge subsystems need plenty of time to restore loads. Thus, to avoid the occurrence of huge subsystems, the subsystem size should be limited:
where mli represents the shortest path from the black start power source to bus i, Umax is the maximum allowed size of the subsystem, and ND is the set of nodes updated in each iteration process.
Power balance constraint: For a generating unit, the minimum output active power is one of the key characteristics and is determined by technical conditions. Generating units cannot be operated stably at an output lower than their minimum output power. Thus, the sum of the generating units’ minimum output in each subsystem should be less than the total load.
where α represents the minimum technical output coefficient of unit at i, PGi denotes the rated output power of unit at i, and PDi represents the load at i.
Step 6. If Ft is converged, output the node sets for each subsystem; whereas, update Pt and return to continue iteration in step 3.
4 Simulation results
The proposed partitioning method has been implemented in MATLAB R2018b. To illustrate the validity of the proposed approach, simulations are performed with the IEEE 39- and 118-bus test systems.
4.1 IEEE 39-bus test system
The IEEE 39-bus system includes 10 generators, 39 buses, 12 transformers, and 34 lines Zimmerman et al., 2011. BS units are located at buses 30, 31, and 34, respectively. The initial X values of buses 30, 31 and 34 are 0. Thus, this system is divided into three subsystems. Buses 30, 31, and 34 are in subsystems 1, 2, and 3, respectively. The constraint on the subsystem size is set as Umax = 8 Li et al., 2019. The optimal PMU locations are shown in Figure 4 Demetriou et al., 2019. The minimum technical output coefficient α of the hydropower unit is 0, while that of the thermal power unit is 0.35. The values of edge-weight in (2) and node-weight in (6) are calculated by the entropy weight method. That is, ω 1 = 0.4096, ω 2 = 0.5904, ω3 = 0.6750, and ω4 = 0.3250. The partitioning strategy by using the proposed method is shown in Figure 4.
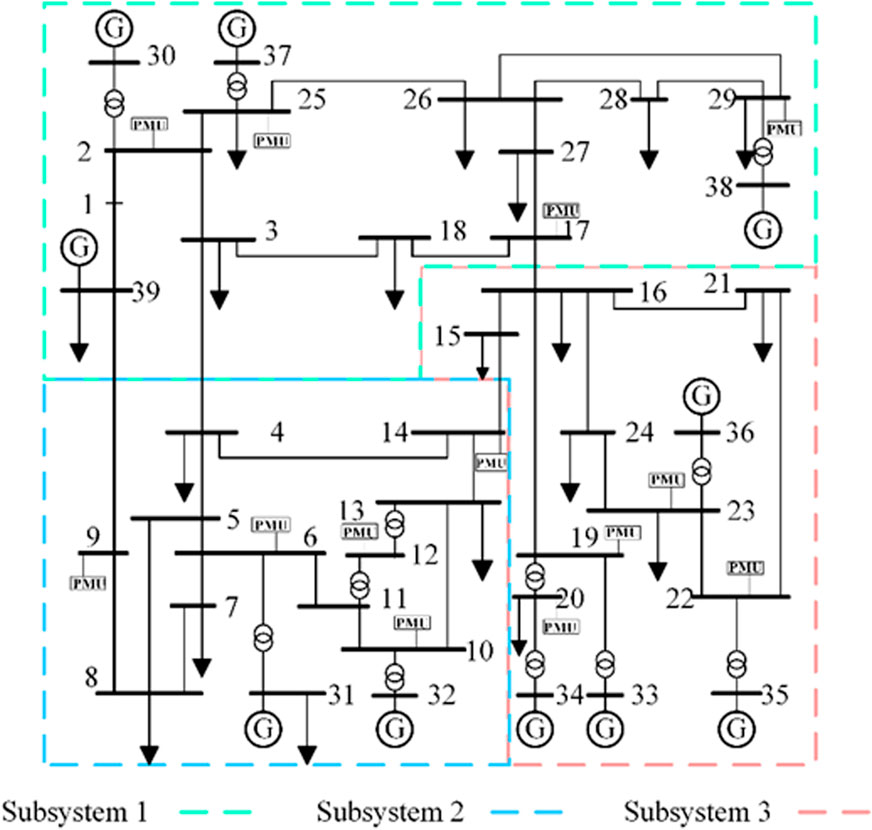
Figure 4. The partitioning strategy of the IEEE 39-bus system.
From the 1st step to the fifth step iteration, the three types of labels, representing three subsystems, propagate from buses 30, 31, and 34 to other buses. The X values of all buses are increasing. In the 6th label propagation, the X values of all buses except bus 9 do not increase. In this step, the X value of bus 9 in subsystem 1 is 1.009. If bus 9 is divided into subsystem 2, X (2, 9) is 1.032, which is greater than X (1, 9) = 1.009. Therefore, bus 9 should be divided into subsystem 2. In the end, all buses’ X values do not increase as the labels propagate.
Edges 3–4, 9–39, 14–15, and 16–17 are the tie lines of three subsystems. The buses in each subsystem are in Table 1. The X values of some buses are shown in Table 2. The sizes of subsystem 1, subsystem 2 and subsystem 3 are 5, 4, and 6, respectively. The size of each subsystem is roughly balanced.
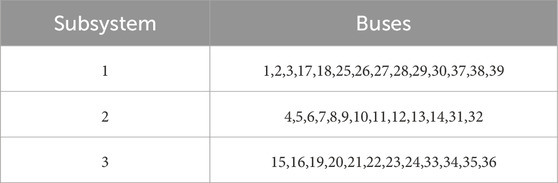
Table 1. The buses in each subsystem of the IEEE 39-bus system.
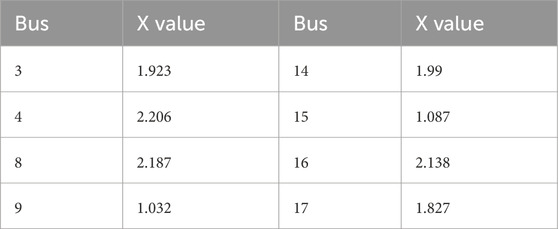
Table 2. X value of some buses in the IEEE 39-bus system.
Since the power system has obvious small-world network characteristics, the index of modularity, namely Q, can be used to evaluate the rationality of the generating subsystems Newman and Girvan, 2004. In order to reflect the electrical connection of the power system, this paper takes the active power of buses as the weight to construct the weighted graph. For an actual network, the value of Q is generally between 0.3–0.7 Lin et al., 2011.The Q value of this partitioning strategy is 0.638. It indicates that the partitioning strategy is reasonable. Figure 5 shows that each subsystem has sufficient generation capacity to match the load consumption. All buses in each subsystem are entirely observable. Thus, the three formed subsystems in this strategy satisfy the partitioning constraints. The partitioning strategy obtained by this method is beneficial to the parallel restoration after a power outage.
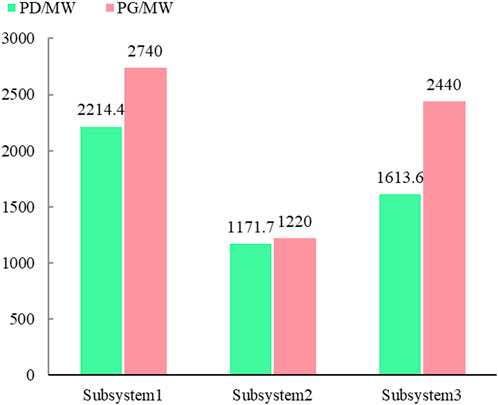
Figure 5. The information within each subsystem for the IEEE 39-bus system.
Figure 6 and Table 3 shows the comparison of the proposed method and the other three methods in Lin et al., 2011, Quirós-Tortós et al., 2014; Sun et al., 2016 References Lin et al., 2011and Quirós-Tortós et al., 2014 both employed algorithms based on complex network theory, focusing solely on the partitioning from the network’s topological characteristics. Reference Lin et al., 2011 utilized the GN algorithm to obtain the partitioning results with relatively high modularity, while reference Quirós-Tortós et al., 2014 used the cut-set theory to achieve the partitioning strategies with fewer interval connection lines. Reference Sun et al., 2016, on the other hand, employed the mathematical optimization method, considering power flow calculations, to obtain the partitioning results with the minimal interval transmission exchange power. In Figure 6, references Lin et al., 2011 and Quirós-Tortós et al., 2014represent comparison method 1, while reference Sun et al., 2016 represents comparison method 2. The number of tie lines obtained in this paper is the same as Lin et al., 2011; Quirós-Tortós et al., 2014, but smaller than that of Sun et al., 2016. A small number of tie lines indicates that the complexity of reconnecting subsystems is low. It helps improve the success of the third stage of parallel restoration. The Q value of the partitioning strategy in this paper is 0.6380, which is the largest Q of the strategies obtained by using methods in Figure 6, indicating that the partitioning characteristics of the strategy developed by the proposed method are obvious. The small power exchange among different subsystems helps the power balance of each subsystem Qing, 2015, Demetriou et al., 2019. The power exchange between subsystems is less, the connection between subsystems is weaker. The absolute value of power exchange among subsystems obtained by the proposed method is 339.04 MW, the smallest value of the three strategies. Overall, the proposed method has a good performance of system partitioning.
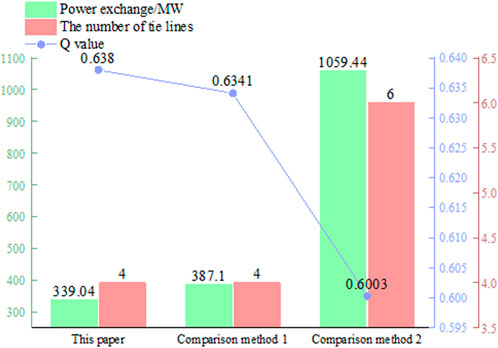
Figure 6. Comparison of different partitioning methods.
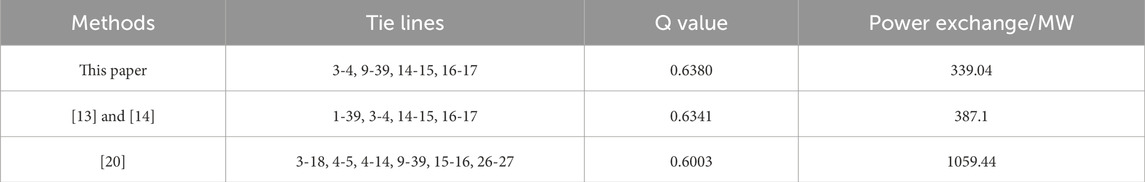
Table 3. Comparison of different partitioning methods.
4.2 IEEE 118-bus test system
The IEEE 118-bus system has 54 generators, 9 transformers, 118 buses, and 186 branches. The BS units are located at buses 12, 25, 55, 66, and 100, respectively. The initial X values of buses 12, 25, 55, 66, and 100 are equal to 0. The IEEE 118-bus system is sectionalized into 5 subsystems. Buses 12, 25, 55, 66, and 100 are in subsystems 1, 2, 3, 4, and 5, respectively. The optimal PMU locations for this test system are shown in Demetriou et al., 2019.
The label oscillation among buses in the label propagation algorithm is shown in Table 4. For instance, buses 19, 30, and 31 are marked by subsystem 1-based label or subsystem 2-based label repeatedly. The label propagation algorithm is not converged, and the partitioning strategy cannot be generated. Thus, the buses with label oscillation should be merged into suitable subsystems to develop the final partitioning strategy.
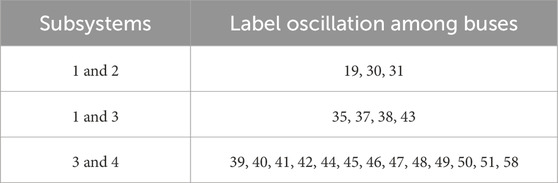
Table 4. The label oscillation among buses in the label propagation algorithm.
The X values of some buses are shown in Table 5. For bus 74, it is marked by subsystem 2- or 5-based labels repeatedly. Thus, there are two types of label oscillation in bus 74. By applying the proposed cooperative game strategy, X (2, 74) and X (5, 74) are 0.998 and 0.912, respectively. Since X (2, 74) is larger than X (5, 74), bus 74 is merged into subsystem 2. The other buses with label oscillation are cooperated with each subsystem and divided into the subsystem with the maximum Shapley value.
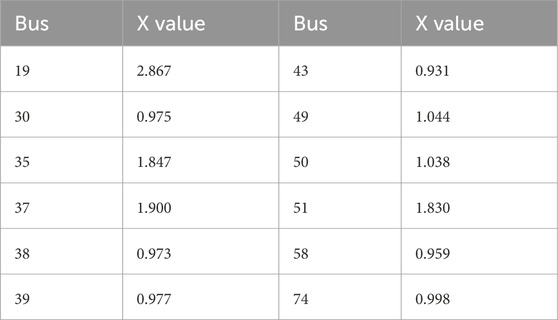
Table 5. X values of some buses in the IEEE 118-bus system.
Figure 7 shows the final partitioning strategy. Edges 8–30, 17–30, 17–31, 17–113, 19–20, 30–38, 34–43, 37–38, 37–39, 37–40, 49–54, 49–51, 50–57, 59–60, 59–61, 63–64, 69–70, 70–75, 74–75, 68–81,69–75, and 69–77 divide the system into 5 subsystems. The absolute value of power exchange among subsystems is 1474.03 MW. The number of buses in each subsystem is not much different. The sizes of subsystems 1, 2, and 5 are all equal to 5, and that of subsystems 3 and 4 are 3 and 4, respectively, as shown in Table 6. The size of each subsystem is roughly same. The Q value of the partitioning strategy is 0.605, indicating that the partitioning characteristics of the strategy developed by the proposed method are obvious. Figure 8 shows that each subsystem has sufficient generation capacity to match the load consumption. All the generated subsystems are completely observable. The results indicate that the method proposed in this paper is effectively applied to the partitioning problem of large power systems.
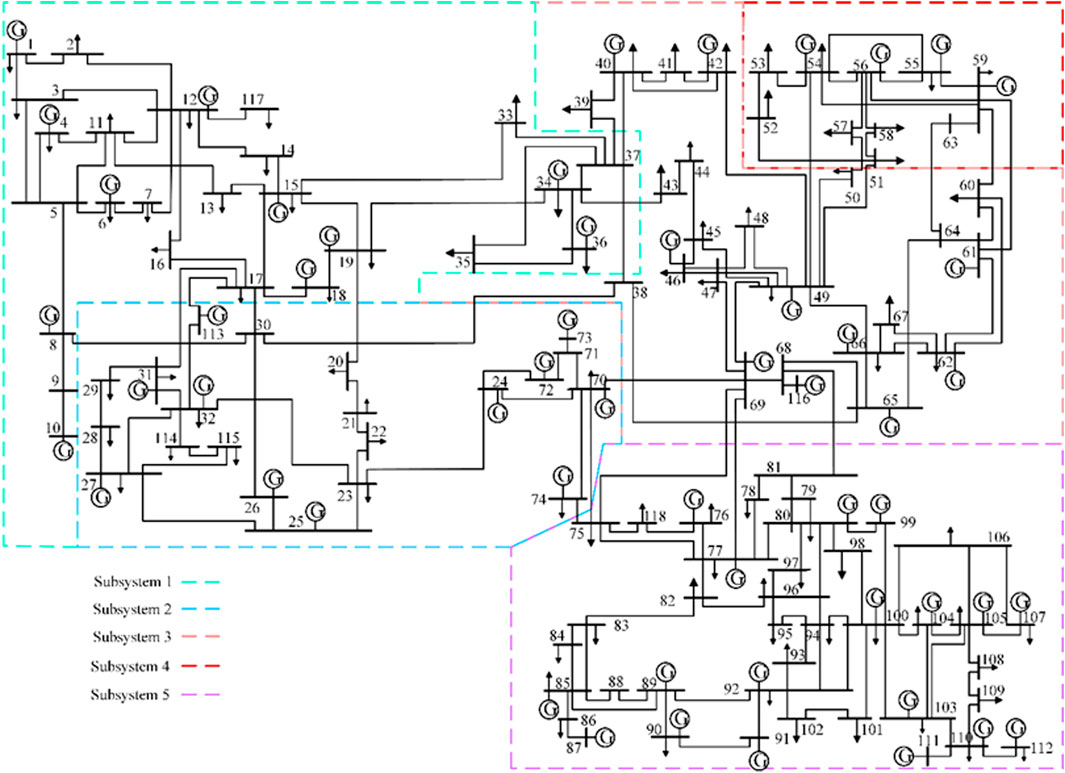
Figure 7. The partitioning strategy of the IEEE 118-bus system.
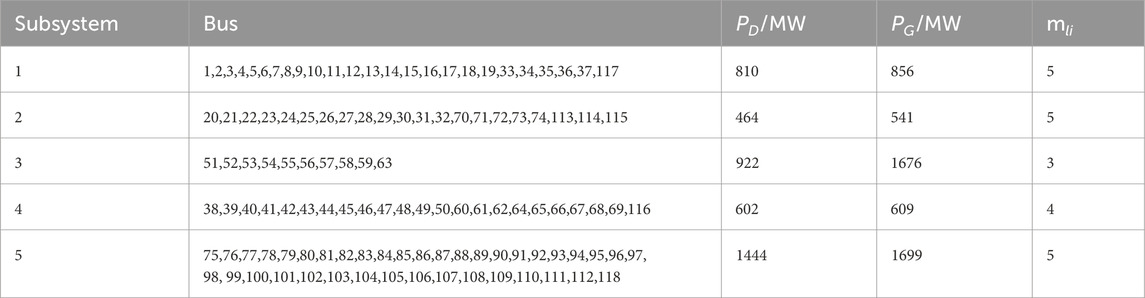
Table 6. The information within each subsystem of the IEEE 118-bus system.

Figure 8. The information within each subsystem for the IEEE 118-bus system.
4.3 An urban power grid in South China
An urban power grid in South China is used to verify the effectiveness of the proposed method on practical power systems. Only 500 kV and 220 kV networks are considered, as shown in Figure 9. This grid has 7 power plants with a total installed capacity of 5100 MW. The total load is 3507.7 MW. The BS units are located at plant-buses 10, 22, and 29, respectively. The initial X value of each bus is 0.
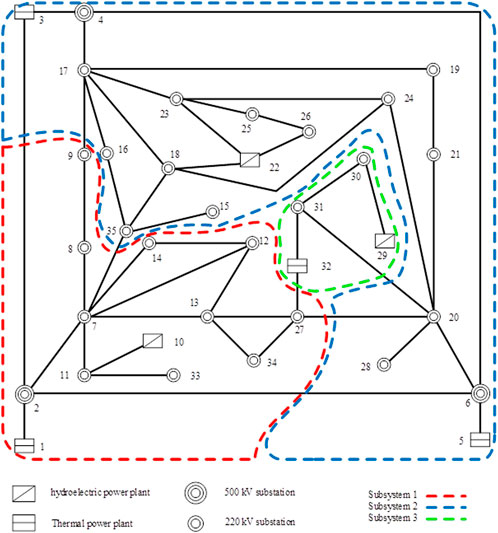
Figure 9. The partitioning strategy of an urban power system in South China.
By using the proposed method, the grid is partitioned into 3 subsystems. The tie lines are edges 2–3, 2–6, 7–35, 9–17, 20–27, 20–31, and 32–27, as shown in Figure 9. The Q value of the partitioning strategy is 0.413, indicating that the partitioning characteristics of the strategy developed by the proposed method are obvious. The size of subsystem 1 is 5, subsystem 2 is 3, and subsystem 3 is 5respectively, as shown in Table 7. The size of each subsystem is almost the same as that of others. Each subsystem contains a BS unit and has sufficient generation capacity to match the load consumption. The results indicate that the method proposed in this paper can be effectively applied to the partitioning problem of practical power systems.
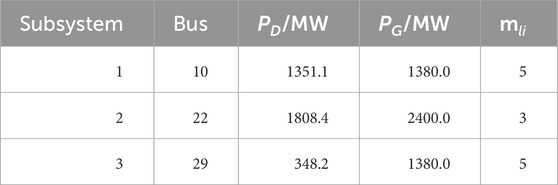
Table 7. The information within each subsystem for the actual urban power grid.
5 Conclusion
This paper proposes a label propagation algorithm and the cooperative game theory-based partitioning method for parallel restoration. The topological and physical characteristics of power systems are considered comprehensively for overcoming the shortcomings of only considering one of them to partition the power system. In the proposed approach, we applied the cooperative game to improve the label impact strategy by using the maximum Shapley value of buses. It can restrict the label oscillation in the problem of generating multiple subsystems. The proposed approach is tested by the IEEE 39- and 118-bus test systems. Simulation results show that the proposed method can effectively determine a partitioning strategy for parallel restoration.
This paper only focuses on the partitioning strategy. The second step of parallel restoration, i.e., the restoration process of subsystems, is beyond the scope of this paper. However, the existing parallel restoration methods mainly develop the independent restoration strategies of each subsystem, ignoring the interaction impact between neighboring subsystems. Thus, our future work investigates the coordinated multiple stages of partitioning and inter-subsystem restoration.
Data availability statement
The original contributions presented in the study are included in the article/Supplementary material, further inquiries can be directed to the corresponding author.
Author contributions
XW: Methodology, Writing–original draft. LP: Software, Writing–original draft. DX: Project administration, Writing–review and editing. SY: Supervision, Writing–review and editing. BW: Formal Analysis, Writing–review and editing.
Funding
The author(s) declare that financial support was received for the research, authorship, and/or publication of this article. Technology project of Guangxi power grid, Grant No. 046000KK52222022.
Conflict of interest
The authors declare that the research was conducted in the absence of any commercial or financial relationships that could be construed as a potential conflict of interest.
The authors declare that this study has received funding from Guangxi Power Grid. The funders had the following involvement in the study: they provided data support for this study.
Publisher’s note
All claims expressed in this article are solely those of the authors and do not necessarily represent those of their affiliated organizations, or those of the publisher, the editors and the reviewers. Any product that may be evaluated in this article, or claim that may be made by its manufacturer, is not guaranteed or endorsed by the publisher.
References
Adibi, M. M., Clelland, P., Fink, L. H., Happ, H., Kafka, R., Raine, J., et al. (1987). Power system restoration - a task force report. IEEE Trans. Power Syst. 2, 271–277. doi:10.1109/tpwrs.1987.4335118
Amraee, T., and Saberi, H. (2017). Controlled islanding using transmission switching and load shedding for enhancing power grid resilience. Int. J. Elecr. Power Energy Syst. 91, 135–143. doi:10.1016/j.ijepes.2017.01.029
Arif, F. M., Hazlie, M., Nurulafiqah, N. M., Jasrul, J. J., Wang, L., and Munir, A. M. (2023). Power distribution system outage management using improved resilience metrics for smart grid applications. Energies 16, 3953. doi:10.3390/en16093953
Chen, W., Liu, Z. M., Sun, X. R., and Wang, Y. J. (2011). Community detection in social networks through community formation games. IJCAI Proceedings-International Jt. Conf. Artif. Intell. 22 (3), 2576–2581. doi:10.5591/978-1-57735-516-8/JCA111-429
Demetriou, P., Asprou, M., and Kyriakides, E. (2019). A real-time controlled islanding and restoration scheme based on estimated states. IEEE Tran. Power Syst. 34, 606–615. doi:10.1109/tpwrs.2018.2866900
Ding, T., Wang, Z. K., Qu, M., Wang, Z. Y., and Mohammad, S. (2022). A sequential black-start restoration model for resilient active distribution networks. IEEE Trans. Power Syst. 37, 3133–3136. doi:10.1109/tpwrs.2022.3164589
Ghiasi, M., Dehghani, M., Niknam, T., Baghaee, H. R., Padmanaban, S., Gharehpetian, G. B., et al. (2021). Resiliency/cost-based optimal design of distribution network to maintain power system stability against physical attacks: a practical study case. IEEE ACCESS 9, 43862–43875. doi:10.1109/access.2021.3066419
Gu, X. P., Zhou, G. Q., Li, S. Y., and Liu, T. (2019). Global optimisation model and algorithm for unit restarting sequence considering black-start zone partitioning. IET Gener. Transm. Distrib. 13, 2652–2663. doi:10.1049/iet-gtd.2018.6237
Huang, S. J., Li, C. C., Li, Z. C., Xu, W. W., and Yang, L. (2020). An improved label propagation algorithm-based method to develop sectionalizing strategies for parallel power system restoration. IEEE Access 8, 118497–118509. doi:10.1109/access.2020.3005573
Josip, T., Srdjan, S., Ljupko, T., and Mislav, B. (2022). Resilience neural-network-based methodology applied on optimized transmission systems restoration. Energies 15, 4694. doi:10.3390/en15134694
Li, S. Y., Gu, X. P., and Zhou, G. Q. (2019). Optimisation and comprehensive evaluation of alternative energising paths for power system restoration. IET Gener. Transm. Distrib. 12, 1923–1932. doi:10.1049/iet-gtd.2018.6277
Lin, Z. Z., Wen, F. S., Chung, C. Y., Wong, K. P., and Zhou, H. (2011). Division algorithm and interconnection strategy of restoration subsystems based on complex network theory. IET Gener. Transm. Distrib. 5, 674–683. doi:10.1049/iet-gtd.2010.0586
Newman, M. E. J., and Girvan, M. (2004). Finding and evaluating community structure in networks. Phys. Rev. E 69, 026113. doi:10.1103/physreve.69.026113
Ni, X. P., and Mei, S. W. (2008). A novel decomposition and coordination algorithm for complex networks and its application to power grids. J. Control Theory Appl. 6, 53–58. doi:10.1007/s11768-008-7191-y
Qing, X. (2015). Controlled islanding of power systems using label propagation. IEEJ Trans. Electr. Electr. 10, 256–261. doi:10.1002/tee.22081
Quirós-Tortós, J., Panteli, M., Wall, P., and Terzija, V. (2015). Sectionalising methodology for parallel system restoration based on graph theory. IET Gener. Transm. Distrib. 9, 1216–1225. doi:10.1049/iet-gtd.2014.0727
Quirós-Tortós, J., Wall, P., Ding, L., and Terzija, V. (2014). Determination of sectionalising strategies for parallel power system restoration: a spectral clustering based methodology. Electr. Power Syst. Res. 116, 381–390. doi:10.1016/j.epsr.2014.07.005
Raghavan, U. N., Albert, R., and Kumara, S. (2007). Near linear time algorithm to detect community structures in large-scale networks. Phys. Rev. E 76, 036106. doi:10.1103/physreve.76.036106
Sun, K., Zheng, D. Z., and Lu, Q. (2003). Splitting strategies for islanding operation of large-scale power systems using obdd-based methods. IEEE Trans. Power Syst. 18, 912–923. doi:10.1109/tpwrs.2003.810995
Sun, L., Zhang, C., Lin, Z. Z., Wen, F. S., Xue, X. S., Salam, M. A., et al. (2016). Network partitioning strategy for parallel power system restoration. IET Gener. Transm. Distrib. 10, 1883–1892. doi:10.1049/iet-gtd.2015.1082
Wang, C., Vittal, V., and Sun, K. (2011). Obdd-based sectionalizing strategies for parallel power system restoration. IEEE Trans. Power Syst. 26, 1426–1433. doi:10.1109/tpwrs.2010.2074216
Yuan, S. S., Quiring, S. M., Zhu, L., Huang, Y., and Wang, J. Q. (2020). Development of a typhoon power outage model in guangdong, China. Int. J. Electr. Power Energy Syst. 117, 105711. doi:10.1016/j.ijepes.2019.105711
Zhao, J., Wang, H. T., Hou, Y. H., Wu, Q., Hatziargyriou, N. D., Zhang, W., et al. (2020). Robust distributed coordination of parallel restored subsystems in wind power penetrated transmission system. IEEE Trans. Power Syst. 35, 3213–3223. doi:10.1109/tpwrs.2020.2971023
Zhou, L. H., Lu, K. V., Yang, P. Z., Wang, L. Z., and Kong, B. (2015). An approach for overlapping and hierarchical community detection in social networks based on coalition formation game theory. Expert Syst. Appl. 42, 9634–9646. doi:10.1016/j.eswa.2015.07.023
Zhu, X. J., and Ghahramani, Z. (2002). Learning from labeled and unlabeled data with label propagation. Ann Arbor, MI, USA: ProQuest.
Keywords: resilience, power system restoration, partitioning decision-making, cooperative game theory, label propagation algorithm
Citation: Wei X, Pan L, Xie D, Yang S and Wei B (2024) Complex network theory and game theory-based partitioning decision-making of parallel restoration for resilient power grid. Front. Energy Res. 12:1343954. doi: 10.3389/fenrg.2024.1343954
Received: 24 November 2023; Accepted: 28 February 2024;
Published: 28 March 2024.
Edited by:
Chixin Xiao, University of Wollongong, AustraliaReviewed by:
Mohammad Ghiasi, University of Regina, CanadaZiming Yan, Nanyang Technological University, Singapore
Copyright © 2024 Wei, Pan, Xie, Yang and Wei. This is an open-access article distributed under the terms of the Creative Commons Attribution License (CC BY). The use, distribution or reproduction in other forums is permitted, provided the original author(s) and the copyright owner(s) are credited and that the original publication in this journal is cited, in accordance with accepted academic practice. No use, distribution or reproduction is permitted which does not comply with these terms.
*Correspondence: Xin Wei, d2VpX3guZGRAZ3guY3NnLmNu