 Yu Xingguo
 Chong Wei
 Jasmin Niguidula4
- 1College of Internet and Communication, Anhui Technical College of Mechanical and Electrical Engineering, Wuhu, China
- 2Technological University of the Philippines, Manila, Philippines
- 3China Meteorological Administration, Meteorological Observation Center, Beijing, China
- 4Graduate Program and External Studies, Technological University of the Philippines, Manila, Philippines
Diffuse and direct radiation distribution are crucial for the design and construction of photovoltaic power systems. However, due to the high cost and relatively complex maintenance, there are relatively few observation stations for diffuse and direct radiation in China, while there are numerous stations for total radiation, making it easier to obtain total radiation data. In this study, based on the Boland Ridley Laurent (BRL) model, the atmospheric radiation transfer theory and Taylor series expansion were utilized to establish a BRL model relating the diffuse fraction to the clear-sky index and atmospheric optical thickness. Training datasets comprising radiation data at three different time scales, namely minute, 10-min, and hourly, were used to obtain the mathematical model parameters for the diffuse fraction with respect to the clear-sky index and atmospheric optical thickness through nonlinear fitting, resulting in binary BRL model. Validation datasets were created using solar radiation data from observation stations in regions with distinct climatic characteristics. The BRL model was employed to calculate the diffuse fraction, statistical analyses were conducted on the correlation coefficient, mean bias deviation (MBD), root mean squared deviation (RMSD), and t-statistic between measured and computed diffuse fraction values. The results show that the diffuse fraction values computed by the BRL model exhibited correlation coefficients above 0.8, MBD within ±0.2, RMSD within 0.25, and minimum t-statistic as low as 0.1074. This study provides a new direction for constructing diffuse radiation model, and further research should incorporate more extensive radiation data to investigate the model’s applicability across different regions.
1 Introduction
High-quality direct and diffuse radiation data are essential for the development and utilization of solar energy resources in a region and serve as important parameters to characterize its climatic features (WMO, 2014). However, in reality, direct radiation measurements require sun-tracking devices, and diffuse radiation measurements necessitate shading devices, making the cost expensive and maintenance challenging. As a result, many observation sites only conduct total solar radiation observations, making it difficult to obtain long-term series of direct and diffuse radiation data. The diffuse fraction represents the proportion of diffuse radiation relative to the total solar radiation in the sky and is closely related to both direct and diffuse radiation. The Ångström-Prescott formula indicates a linear relationship between the clear-sky index and corresponding relative sunshine hours, with a negative correlation between cloud cover and sunshine duration (Ångström, 1924; Prescott, 1940). Studying the diffuse radiation model based on known or easily accessible parameters such as the clear-sky index allows for the analysis of the diffuse fraction pattern. This research holds significant importance for the planning, design, and operation of solar power plants, as well as for studying climate change. Additionally, it plays a crucial role in enhancing the yields of agricultural and forestry crops like rice, wheat, and apples, improving building energy efficiency, and promoting the development of regional tourism and leisure industries, thereby presenting essential economic and social value.
Currently, research on the regularity of diffuse fraction mainly focuses on constructing diffuse fraction models using piecewise linear and polynomial fitting methods. Shang et al. investigated the direct and diffuse fraction models of horizontal solar radiation in low-latitude areas and established a piecewise linear regression model between atmospheric diffuse transmittance ratio and clear-sky index (Shang et al., 2017). Feng et al. compared five representative direct and diffuse fraction models in Beijing and identified the main influencing factors and the most suitable model for Beijing (Feng et al., 2015). Ma et al. improved the Erbs direct and diffuse solar radiation models by introducing the sunshine percentage and establishing a polynomial model, which enhanced the model accuracy to some extent (Ma et al., 2016). Fu et al. found that the solar radiation duration was highly correlated with the diffuse radiation ratio in regions with severe atmospheric pollution, with correlation coefficients exceeding −0.8, an increase in the concentration of aerosol particles in the air has a significant impact on sunshine duration and SDRF over China. (SDRF—defined as the diffuse solar radiation divided by the total solar radiation in conditions of sunny weather) (Fu and Dan, 2018). Zhang and Zhao conducted a study on the transmission and extinction characteristics of mid-infrared radiation in the atmosphere, analyzing the influence of different atmospheric profiles, molecular attenuation, and aerosols on radiation transmission (Zhang et al., 2017; Zhao et al., 2018). Yvonne et al. investigated the use of total radiation to invert sunshine duration through a piecewise linear model, which could be used when there was no sunshine observation data available (Yvonne and Wouter, 2007; Chong et al., 2017). Ahwide et al. studied the linear relationship between the daily average diffuse fraction and the clear-sky index, predicting the daily direct radiation and sunshine duration in Sabhā, Ghadāmis, and Tripoli in Libya (Ahwide et al., 2013). Basharat and Abid proposed a generic model for estimating diffuse fraction in India using clear-sky index and sunshine duration, based on linear and polynomial fitting methods (Basharat and Abid, 2017). Li et al. established a linear relationship between the inclined total solar radiation and sunshine duration in Hong Kong (Li et al., 2008). Manuel et al. proposed a piecewise linear effect of atmospheric diffuse, absorption, and optical quality on the relationship between total solar radiation and diffuse radiation (Manuel et al., 1991). Muneer and Munawwar developed a second-order polynomial empirical formula for the components of daily diffuse radiation using statistical methods and data from India, Japan, Spain, and the UK, including sunshine duration, cloud distribution coefficient, and clear-sky index (Muneer and Munawwar, 2007). Fu et al. analyzed the trends in sunshine duration and diffuse fraction under clear sky conditions in seven city clusters in China between 1960 and 2005 and pointed out that anthropogenic activities and air pollution, such as aerosol optical thickness and tropospheric NO2 concentration, had a highly negative correlation with sunshine duration and diffuse fraction (Fu et al., 2015). Khorasanizadeh et al. estimated the diffuse radiation in Kerman, Iran, using polynomial and exponential fitting functions, finding that a first-order linear formula performed best for daily diffuse fraction and monthly average diffuse coefficient simulations (Khorasanizadeh et al., 2016). Fan et al. estimated horizontal diffuse radiation in China’s five climatic regions using polynomial and exponential fitting functions and concluded that different function models were suitable for different climatic regions (Fan et al., 2019). Alexandre et al. proposed a fourth-order polynomial model for calculating hourly, daily, and monthly average diffuse radiation using the clear-sky index (Alexandre et al., 2014). Finally, Kambezidis et al. (2021) have determined the upper and lower limits of the diffuse fraction for classitying skies into overcast, intermediate and clear with a wordwide validation.
The Boland Ridley Laurent (BRL) model, proposed by Boland and Ridley, is a commonly used S-shaped function, namely the Sigmoid function, with values ranging between 0 and 1. Its basic form is f(x) = 1/(1 + e^ (-x)). As the independent variable approaches positive or negative infinity, the function output tends to a smooth state of 0 and 1 respectively, which is similar to the distribution of diffuse fractions, making it suitable for constructing diffuse fraction models. In 2008, Boland and Ridley utilized hourly and 15-min data from the Geelong region in Australia to propose the BRL model for diffuse radiation values (Boland et al., 2008). In 2019, they further employed this model to estimate diffuse fractions in Chile, Costa Rica, and Australia, evaluating its correlation with climate factors such as temperature, precipitation, and latitude (Rojas et al., 2019). Based on previous research (Ridley et al., 2010), compared to the traditional piecewise linear fitting and fourth-order polynomial fitting, the BRL model performs better in calculating low diffuse fractions under high clear-sky index conditions, as the former two methods exhibit underfitting issues when the diffuse fractions approach zero. Considering that the residuals between the calculated and the observed values from different models do not follow a normal distribution, the evaluation metrics selected are the median absolute percentage error for measuring the error magnitude and the median deviation for comparing the performance of different models. Research in the southern hemisphere shows that, in terms of median absolute percentage error, the BRL model is 3.07% better than the piecewise linear fitting and 15.48% better than the fourth-order polynomial fitting. Regarding the median deviation, the BRL model is 0.01 smaller than the piecewise linear fitting and 0.08 smaller than the fourth-order polynomial fitting. It is evident that the BRL diffuse fraction model has advantages in fitting performance, providing a new research direction for the study of diffuse solar radiation.
In this paper, based on the BRL model and atmospheric radiation transmission theory, the Taylor series expansion is utilized to represent the diffuse fraction relative to the clear-sky index and atmospheric optical quality. Independent model training datasets and validation datasets are established at different time scales, including minute, 10-min, and hourly data. Nonlinear fitting is performed on the training datasets to construct the binary BRL model for diffuse fractions relative to the clear-sky index and atmospheric optical quality. The validation datasets are used to calculate and analyze the correlation coefficient, average deviation, root mean square error, and t-statistic between the observed and calculated values of the diffuse fractions, thereby evaluating the effectiveness and applicability of the binary BRL model.
2 Data information
2.1 Data source
The data used in this study mainly consists of measurements of total solar radiation and diffuse radiation, obtained using an FS-S6 type pyranometer. The diffuse radiation is measured under shading conditions with a shading ball on a dual-axis sun tracker. The FS-S6 type pyranometer is a domestically produced first-class instrument with a yearly stability of 1.5% and an hourly cumulative measurement uncertainty of 8% (k = 2). The data is divided into two parts: the training dataset and the validation dataset, both of which are independent of each other.
The training dataset is derived from the solar energy resource experimental observation station in Lijiang City, Yunnan Province, China (referred to as the Lijiang station, 26.51°N, 100.12°E, 2,380.9 m). This station has abundant solar radiation, dry air, low aerosol optical thickness, and minimal obstructions. It is equipped with a complete set of meteorological radiation observation instruments and has served as the national radiation instrument comparison site, hosting multiple national direct radiation instrument comparison activities. The observed data from this station are reliable and widely used for instrument performance evaluation and academic research. The training dataset includes three different time scales: hourly radiation observations from April to August 2022, 10-min radiation data April 2022, and minute radiation data from the same month.
For the validation dataset, considerations were made for the spatial distribution of radiation data and the seasonal influence on the model. Therefore, radiation data from five stations were selected for analysis: Lijiang station in the southwest of China, Kazuo station (119.77°E, 41.12°N, 341.2 m) in the northeast, Guangzhou station (113.20°E, 23.10°N, 410.5 m) in the south, Wuhan station (114.08°E, 30.37°N, 231.2 m) in central China, and Urumqi station (87.39°E, 43.47°N, 935.3 m) in the northwest. For the Lijiang station, an alternative set of equipment was used to measure 10-min and hourly radiation data in May 2022. For the Kazuo, Guangzhou, Wuhan, and Urumqi stations, hourly radiation data July and 10-min radiation data December 2022 were chosen. Among them, Kazuo Station is located at the mountaintop with abundant sunshine and no obstructions, making it suitable for solar radiation observation with accurate and reliable data. Guangzhou, Wuhan and Urumqi Stations are all national-level meteorological radiation observation stations, their radiation observations began as early as 1959, providing accurate and reliable data.
2.2 Data quality control
To ensure the validity of the data used for model construction and validation, data quality control was performed on the data information before use. The specific steps are as follows (Xing et al., 2022; Kambezidis et al., 1997; Younes et al., 2005):
(1) Data collected before and after the occurrence of failures in data collectors, power supply, or sun trackers were excluded.
(2) Radiation data for solar altitude angles less than 7° were excluded.
(3) After performing steps (1) and (2) to exclude data, the remaining radiation data were used to calculate the clearness index (
The ground-level horizontal total solar radiation is represented by
(4) Radiation data corresponding to diffuse radiation greater than 1.1 times the total solar radiation were excluded.
(5) Radiation data corresponding to total solar radiation greater than 1.2 times the solar constant and diffuse radiation greater than 0.8 times the solar constant were excluded.
(6) The data information was sorted in ascending order based on
3 Model construction
This paper is based on the BRL model, and the ratio of the ground-level direct horizontal radiation component to the total horizontal solar radiation at the ground surface is defined as the direct fraction, as shown in Equation 5, according to the principle that the total horizontal solar radiation at the ground surface is equal to the sum of the normal direct radiation component and the scattered radiation, as given in Equations 3, 4.
In the equation,
According to the theory of atmospheric radiation transfer, solar radiation reaching the ground undergoes a complex process of attenuation as it passes through the atmosphere, particularly due to Rayleigh scattering and absorption by various components such as gases, water vapor, and aerosols present in the atmosphere. Assuming that the extinction processes, including diffuse and absorption, are mutually independent, the Lambert-Beer law is extended to a broad spectral range, and the normal direct radiation reaching the ground is given as (Ruiz–Arias et al., 2010).
In the equation,
According to Equations 6, 8 and assuming that the extinction processes are categorized into two parts, namely diffuse and absorption, the diffuse fraction can be transformed into:
In the equation,
Due to the clearness index
Equation 10 only converges when
Based on the logarithmic identity and Taylor series expansion, Equation 11 can be transformed into:
Equation 12 represents the derived diffuse fraction BRL general model, where C is a constant, and the polynomial in the exponential part approximates the extinction processes related to atmospheric diffuse and absorption. The specific model should incorporate variables that contribute significantly to atmospheric extinction in the research.
The present study proposes two main contributions. Firstly, the model incorporates the clearness index
In the equation, a1∼a5 are the models parameters, and m is the atmospheric optical mass.
The atmospheric optical mass here refers to the relative atmospheric optical mass, which represents the ratio of the distance that solar radiation travels through the atmosphere to reach the sea level to the distance it would travel through the atmosphere to reach the sea level when the sun is at the zenith. The atmospheric optical mass is closely related to the solar zenith angle and the elevation of the site, and its precise calculation requires corrections for air pressure and atmospheric refraction, which are determined through Equations 14–16 (Rigollier et al., 2000; Chen et al., 2017; Kasten et al., 1989).
In the equation,
In the equation,
Next, the model parameters are solved. Using Matlab programming, the training dataset is imported, and through nonlinear fitting, the binary BRL model function is derived. Table 1 lists the solved parameters of the binary BRL model, with one set for each of the hourly, 10-min, and minute-scale radiation data, making a total of three sets for each model. The binary BRL model surfaces are shown in Figure 1, where (a)-(c) represent the surfaces fitted to the hourly, 10-min, and minute-scale data, respectively.
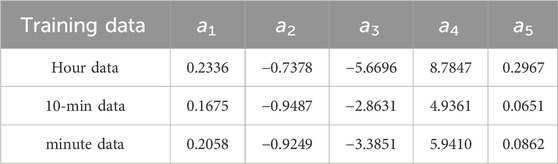
Table 1. Parameters of the binary BRL model for the diffuse fraction.
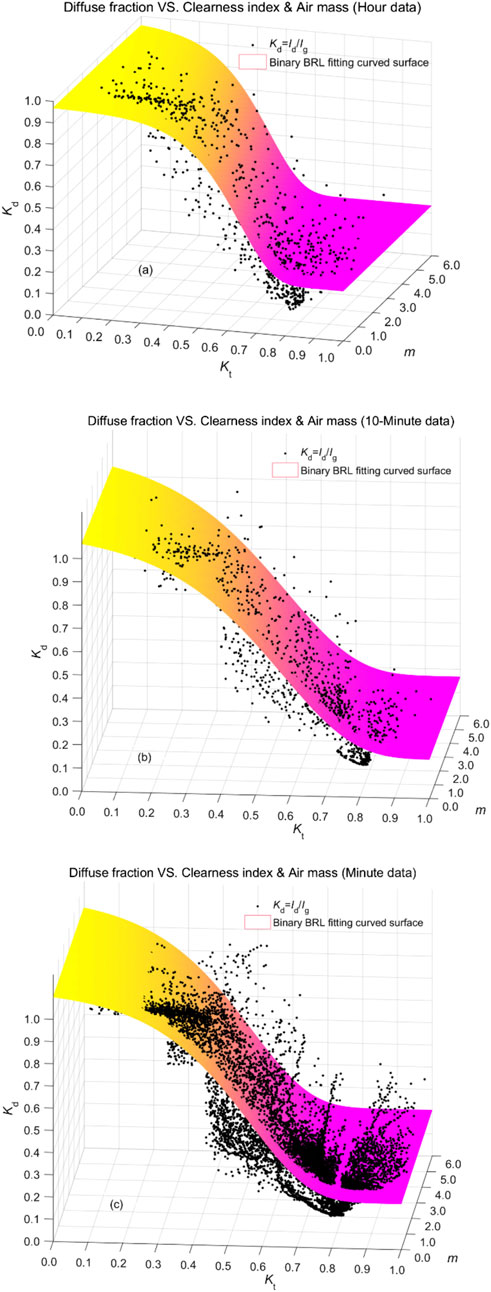
Figure 1. Fitting curve and surface of diffuse fraction binary BRL model. (A) Based on hour data (B) Based on 10-min data (C) Based on minute data.
The distribution relationship between the diffuse fraction and the clearness index (
4 Performance evaluation and discussion
To assess the performance of the binary BRL model in calculating the diffuse fraction, validation computations were conducted using a validation dataset. Since the proposed binary BRL model in this study consists of three sets of parameters obtained from hourly, 10-min, and minute-scale radiation data, the validation process required investigating the impact of different time scales on model construction. Additionally, the validation dataset considered the model’s applicability across various seasons and regions. To achieve this, a separate set of 10-min and hourly radiation data measured in May 2022 at the Lijiang station and hourly radiation data measured in July 2022 and 10-min radiation data measured in December 2022 at the Kazuo station were selected for comparison with the training data. As minute-scale data were unavailable, the 10-min data was used for validation due to its similarity to minute-scale data in model construction. The validation process employed a series of statistical analyses, including correlation coefficient
The correlation coefficient
In equation,
The Mean Bias Deviation (MBD) is used to analyze the systematic error performance of the binary BRL model in calculating the diffuse fraction. The closer the MBD value is to 0, the smaller the systematic error in the model’s calculation of the diffuse fraction. When MBD > 0, it indicates an overestimation phenomenon in the calculated diffuse fraction; when MBD < 0, it indicates an underestimation phenomenon. The MBD is calculated using Equation 18:
The Root Mean Squared Deviation (RMSD) is used to analyze the random error performance of the binary BRL model in calculating the diffuse fraction. The RMSD can be computed using Equation 19, and a smaller value indicates a lower random error in the model’s calculation of the diffuse fraction, indicating higher precision.
Although MBD and RMSD can evaluate the performance of the binary BRL model in calculating the diffuse fraction from the aspects of accuracy and precision, they have inherent limitations. For example, in cases of overall overfitting or underfitting, it is possible to observe very small RMSD values with significantly large MBD values. Additionally, when fitting a large number of discrete values that can cancel out positively and negatively, small MBD and large RMSD can coexist. Therefore, this study introduces the t-statistic, as shown in Equation 20, to comprehensively evaluate the model’s performance in calculating the diffuse fraction, considering both MBD and RMSD. A smaller t-statistic indicates better performance.
Furthermore, the skewness and kurtosis of the residuals between the measured diffuse fraction and the diffuse fraction calculated by the binary BRL model were calculated in this study. Skewness and kurtosis provide information about the symmetry and peakness of the residual distribution relative to a standard normal distribution. Ideally, the skewness and kurtosis values of a standard normal distribution are both 0. Therefore, smaller values of skewness and kurtosis indicate better performance of the model in calculating the diffuse fraction.
Table 2 presents the results of the statistical analysis between the calculated diffuse fraction using the binary BRL model and the measured diffuse fraction. All correlation coefficients are above 0.8, MBD values are within ±0.2, RMSD values are within 0.25, and the minimum t-statistic is as low as 0.1074.
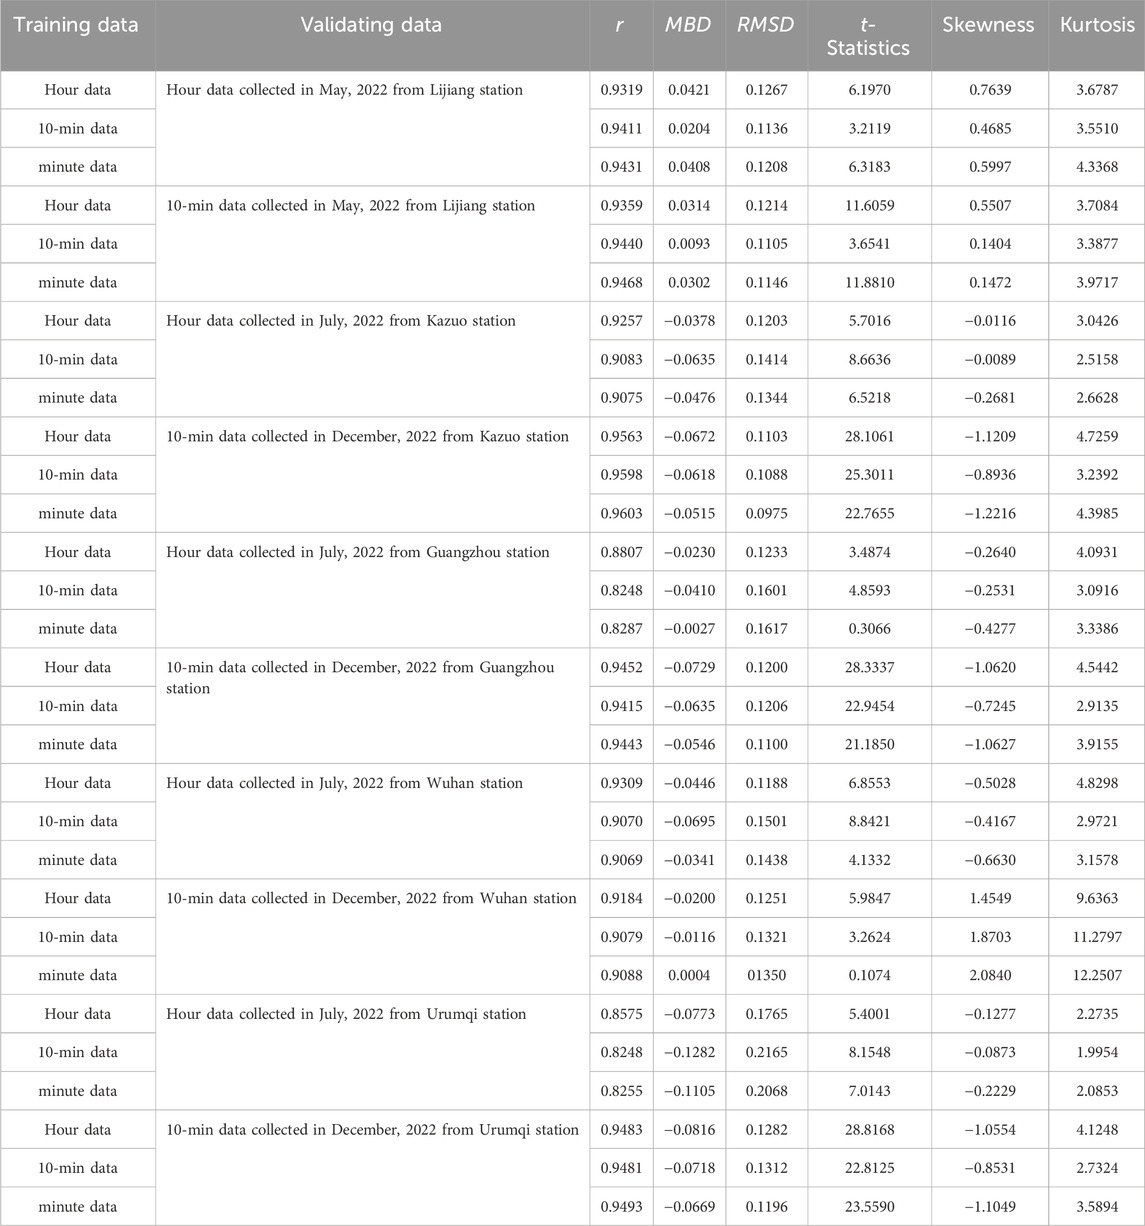
Table 2. The statistical analysis results of the diffuse fraction calculated by the binary BRL model.
When validated using the hourly and 10-min data from the Lijiang station in May 2022, the binary BRL model constructed using the 10-min training data exhibits the best overall performance, with correlation coefficients of 0.9411 and 0.9440, and t-statistic values as low as 3.2119 and 3.6541, respectively. The binary BRL model constructed using minute-scale training data follows closely, while the model constructed using hourly data shows the least satisfactory performance among the three.
When validated using the July hourly radiation data from the Kazuo station, the binary BRL model constructed using hourly training data demonstrates the best overall performance, while validated using the December 10-min data from the Kazuo station, the binary BRL model constructed using 10-min training data demonstrates the best overall performance, with correlation coefficients of 0.9257 and 0.9603, t-statistic values of 5.7016 and 22.7655, respectively. For the July hourly validation data from the Guangzhou station, the maximum correlation coefficient is only 0.8807, indicating an overall underestimation of the calculated diffuse fraction compared to the measured values. The correlation coefficient for the December 10-min validation data is above 0.9, however the corresponding t-statistic is relatively large. The validation results for the hourly and 10-min data from the Wuhan station are generally good, with correlation coefficients above 0.9. The hourly validation data from the Urumqi station shows similar performance to the hourly data from the Guangzhou station, with the maximum correlation coefficient at 0.8575. However, the 10-min data from the Urumqi station for validation exhibit correlation coefficients above 0.9, with smaller mean bias and root mean squared error compared to the 10-min data, but the t-statistic is relatively larger.
In conclusion, the binary BRL model performs well when validated with data from the Lijiang station, while the calculated diffuse fraction for data from the Kazuo, Guangzhou, Wuhan, and Urumqi stations is relatively less accurate, with MBD values generally below 0, indicating an overall underfitting state. This is attributed to the training dataset being exclusive to radiation data from the Lijiang station. Therefore, validation using data from the Lijiang station is more effective in evaluating the model’s performance. For future research, it is necessary to include cross-regional station data in the training dataset to enhance the model’s applicability.
Using the validation data from the Lijiang and Kazuo stations as examples, Figure 2 illustrate the comparative validation plots of different-parameter binary BRL models based on the aforementioned station validation datasets. The three sets of different parameters for the binary BRL model correspond to those obtained from hourly, 10-min, and minute-scale radiation data training.
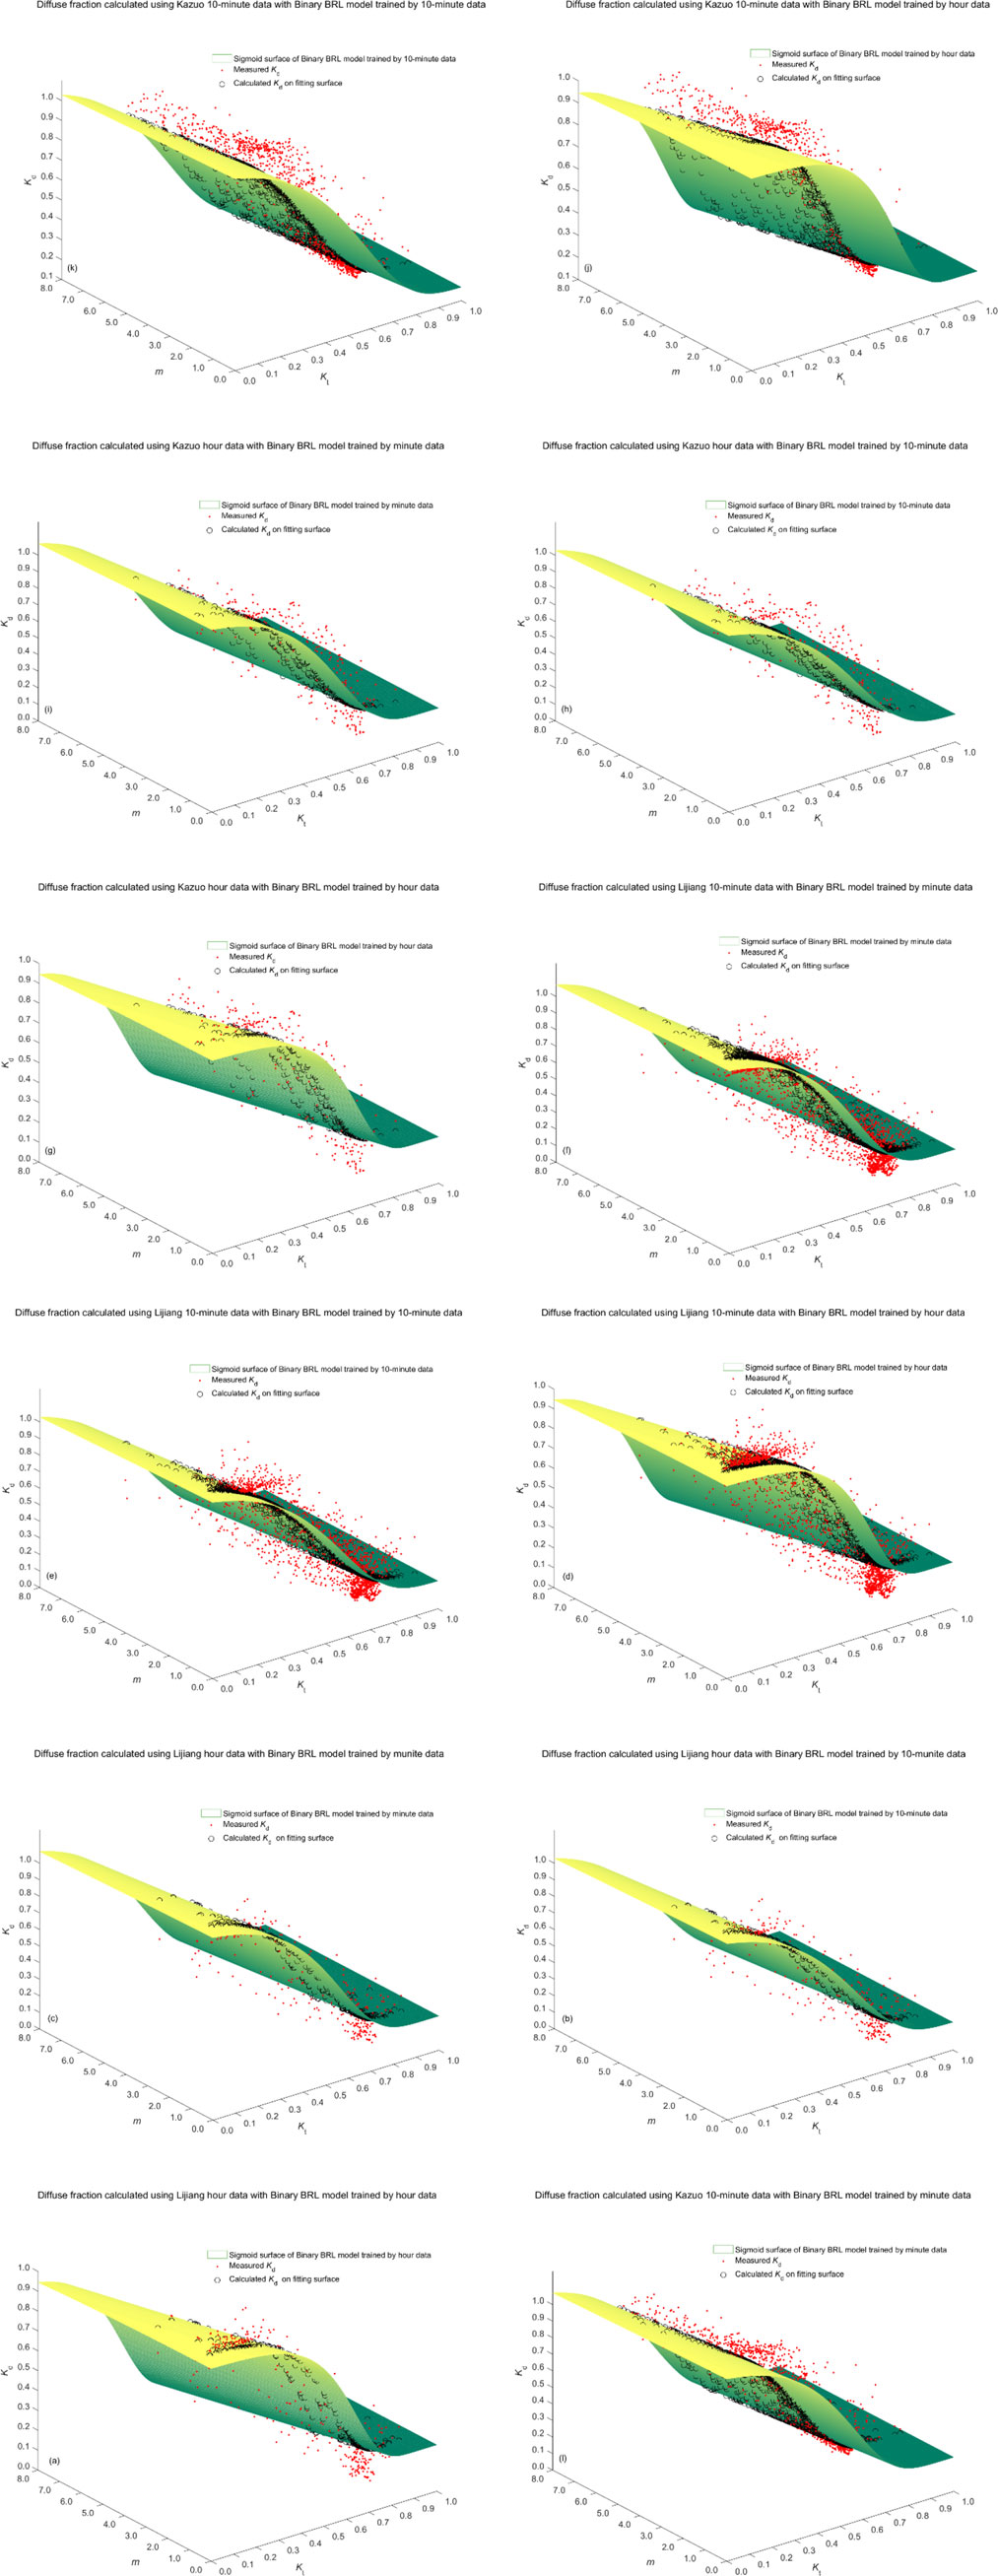
Figure 2. The validation comparison plots of different-parameter binary BRL models are presented in Figure 2. (A–C) show the validation comparison for the binary BRL model using the hourly radiation data from the Lijiang station in May 2022. (D–F) depict the validation comparison for the binary BRL model using the 10-min radiation data from the Lijiang station in May 2022. (G–I) display the validation comparison for the binary BRL model using the hourly radiation data from the Kazuo station in July 2022. Finally, (J–L) demonstrate the validation comparison for the binary BRL model using the 10-min radiation data from the Kazuo station in December 2022.
Figures 2A–F present the validation comparison plots of the diffuse fraction calculated by the different-parameter binary BRL models using the Lijiang station’s hourly and 10-min radiation data for validation. Specifically, the binary BRL models trained with 10-min and minute-scale data yield better representations of the diffuse fraction distribution. Figures 2G–L show the validation comparison plots of the diffuse fraction calculated by the different-parameter binary BRL models using the Kazuo station’s hourly radiation data in July and 10-min radiation data in December, respectively. From the figures, it is evident that the diffuse fraction calculated by the binary BRL models generally falls below the measured diffuse fraction, indicating an underfitting state.
5 Conclusion
The influence of the diffuse fraction on sunshine duration measurement was investigated in this study. Based on atmospheric radiation transfer theory and utilizing Taylor series expansion, a binary BRL model was established to relate the diffuse fraction to the clear-sky index and atmospheric optical thickness. Training datasets were created using radiation measurement data at different time scales, namely hourly, 10-min, and minute-scale, from the Lijiang station. Through non-linear fitting in Matlab, the binary BRL model was developed to estimate the diffuse fraction with respect to the clearness index and atmospheric optical thickness, providing corresponding model parameters and their corresponding two-dimensional surfaces. Validation datasets from two distinct stations, namely the Lijiang and Kazuo stations, were selected to calculate the diffuse fraction using the binary BRL model. Statistical analyses were performed to assess the correlation coefficient, mean bias deviation (MBD), root mean squared deviation (RMSD), and t-statistic between the measured and computed diffuse fraction values.
The conclusions and prospects are as follows:
(1) The diffuse-fraction values computed by the binary BRL model demonstrated correlation coefficients above 0.8, MBD within ±0.2, RMSD within 0.25, and minimum t-statistic as low as 0.1074. This indicates the suitability of the model for constructing the sky diffuse fraction and provides new insights into the study of the distribution pattern of diffuse radiation and its impact on sunshine duration measurement.
(2) The validation data from the Lijiang station showed that the binary BRL model constructed using 10-min radiation data exhibited the best performance in calculating the diffuse fraction, followed by the model using minute-scale data, and the model using hourly data performed the worst. Thus, adequate data volume is essential when constructing the BRL model to ensure its validity.
(3) The validation data from the Kazuo, Guangzhou, Wuhan, and Urumqi stations indicated that the diffuse fraction calculated by the binary BRL model was consistently lower than the measured diffuse fraction at the Kazuo station. Regarding cross-regional applicability, the binary BRL model demonstrated limited suitability, which is attributed to the absence of Kazuo radiation data in the training dataset. Therefore, future studies should incorporate radiation data from multiple stations to further enhance the model’s applicability.
Data availability statement
The original contributions presented in the study are included in the article/supplementary material, further inquiries can be directed to the corresponding author.
Author contributions
YX: Writing–original draft. CW: Writing–review and editing. JN: Writing–review and editing.
Funding
The author(s) declare that financial support was received for the research, authorship, and/or publication of this article. The authors are grateful to the Science and Technology Achievement Incubation Project of China Meteorological Administration Meteorological Observation Center (MOCFH2023307) and National Key Research and Development Program (2023YFF0312003); Provincial Quality Engineering Project of Higher Education Institutions in Anhui Province (2023jyxm1328); Anhui Province Excellent Young Talents Support Project (gxyq2022276).
Conflict of interest
The authors declare that the research was conducted in the absence of any commercial or financial relationships that could be construed as a potential conflict of interest.
Generative AI statement
The author(s) declare that no Generative AI was used in the creation of this manuscript.
Publisher’s note
All claims expressed in this article are solely those of the authors and do not necessarily represent those of their affiliated organizations, or those of the publisher, the editors and the reviewers. Any product that may be evaluated in this article, or claim that may be made by its manufacturer, is not guaranteed or endorsed by the publisher.
References
Ahwide, F., Spena, A., and El-Kafrawy, A. (2013). Correlation for the average daily diffuse fraction with clearness index and estimation of beam solar radiation and possible sunshine hours fraction in Sabha, Ghdames and Tripoli – Libya. APCBEE Procedia 5, 208–220. doi:10.1016/j.apcbee.2013.05.037
Alexandre, D. P., João, F. E., Enzo, D. P., and dos Santos, C. M. (2014). Estimation of hourly, daily and monthly mean diffuse radiation based on MEO shadowring correction. Energy Procedia 57, 1150–1159. doi:10.1016/j.egypro.2014.10.102
Basharat, J., and Abid, T. S. (2017). Generalized models for estimation of diffuse solar radiation based on clearness index and sunshine duration in India Applicability under different climatic zones. J. Atmos. Solar–Terrestrial Phys. 157–158, 16–34. doi:10.1016/j.jastp.2017.03.013
Boland, J., Ridley, B., and Brown, B. (2008). Models of diffuse solar radiation. Renew. Energy 33 (4), 575–584. doi:10.1016/j.renene.2007.04.012
Chen, S., Hu, M., Zeng, R., Li, Q., and Wang, Y. (2017). Measurement error of PM2.5 concentration based on side diffuse lidar. Acta Opt. Sin. 37 (12), 1201003.
Chong, W., Lv, W. H., and Ding, L. (2017). Study on estimation method for sunshine duration using global radiation. J. Electron. Meas. Instrum. 31 (10), 1543–1548. doi:10.13382/j.jemi.2017.10.002
Fan, J. L., Wu, L. F., Zhang, F. C., Cai, H., Ma, X., and Bai, H. (2019). Evaluation and development of empirical models for estimating daily and monthly mean daily diffuse horizontal solar radiation for different climatic regions of China. Renew. Sustain. Energy Rev. 105, 168–186. doi:10.1016/j.rser.2019.01.040
Feng, W., Dong, H., Yang, L., and Liu, J. (2015). Comparison of the fraction model of direct and diffuse solar radiation–Taking Beijing area as an example. J. Civ. Archit. and Environ. Eng. 37 (1), 12–17.
Fu, C. B., and Dan, L. (2018). Influence of intensified air pollution on the sunny diffuse radiation fraction in China. Chin. Sci. Bull. 63 (25), 2655–2665. doi:10.1360/n972018-00177
Fu, C. B., Dan, L., Chen, Y. L., and Tang, J. (2015). Trends of the sunshine duration and diffuse radiation percentage on sunny days in urban agglomerations of China during 1960–2005. J. Environ. Sci. 34, 206–211. doi:10.1016/j.jes.2014.08.027
Gueymard, C. A. (2018). A reevaluation of the solar constant based on a 42-year total solar irradiance time series and a reconciliation of spaceborne observations. Sol. Energy 168, 2–9. doi:10.1016/j.solener.2018.04.001
Kambezidis, H., Kampezidou, S. I., and Kampezidou, D. (2021). Mathematical determination of the upper and lower limits of the diffuse fraction at any site. Appl. Sci. 11, 8654. doi:10.3390/app11188654
Kambezidis, H. D. (2021). The solar radiation climate of Greece. Climate 9, 183. doi:10.3390/cli9120183
Kambezidis, H. D., and Papanikolaou, N. S. (1990). Solar position and atmospheric refraction. Sol. Energy 44 (3), 143–144. doi:10.1016/0038-092x(90)90076-o
Kambezidis, H. D., Psiloglou, B. E., and Synodinou, B. M. (1997). Comparison between measurements and models for daily solar irradiation on tilted surfaces in Athens, Greece. Renew. Energy 10 (4), 505–518. doi:10.1016/s0960-1481(96)00045-6
Kasten, F., and Young, A. T. (1989). Revised optical air mass tables and approximation formula. Appl. Opt. 28 (22), 4735–4738. doi:10.1364/ao.28.004735
Khorasanizadeh, H., Mohammadi, K., and Goudarzi, N. (2016). Prediction of horizontal diffuse solar radiation using clearness index based empirical models; A case study. Int. J. Hydrogen Energy 41 (47), 21888–21898. doi:10.1016/j.ijhydene.2016.09.198
Li, D. H. W., Lam, T. N. T., and Chu, V. W. C. (2008). Relationship between the total solar radiation on tilted surfaces and the sunshine hours in Hong Kong. Sol. Energy 82, 1220–1228. doi:10.1016/j.solener.2008.06.002
Ma, N. J., Li, F., and Bian, Z. Q. (2016). Comparative study of solar beam–diffuse radiation separated model. Water Resour. Power 34 (4), 211–214.
Manuel, V., Valeriano, R., and Richard, P. (1991). The roles of scattering, absorption, and air mass on the diffuse-to-global correlations. Sol. Energy 47 (3), 181–188. doi:10.1016/0038-092x(91)90077-a
Muneer, S., and Munawwar, T. (2007). Statistical approach to the proposition and validation of daily diffuse irradiation models. Appl. Energy 84, 455–475. doi:10.1016/j.apenergy.2006.08.001
Prescott, J. A. (1940). Evaporation from a water surface in relation to solar radiation. Trans. R. Soc. S. Aust. 64, 114–118.
Ridley, B., Boland, J., and Lauret, P. (2010). Modelling of diffuse solar fraction with multiple predictors. Renew. Energy 35, 478–483. doi:10.1016/j.renene.2009.07.018
Rigollier, C., Bauer, O., and Wald, L. (2000). On the clear sky model of the ESRA–European solar radiation Atlas–with respect to the heliosat method. Sol. Energy 68 (1), 33–48. doi:10.1016/s0038-092x(99)00055-9
Rojas, R. G., Alvarado, N., Boland, J., Escobar, R., and Castillejo-Cuberos, A. (2019). Diffuse fraction estimation using the BRL model and relationship of predictors under Chilean, Costa Rican and Australian climatic conditions. Renew. Energy 136, 1091–1106. doi:10.1016/j.renene.2018.09.079
Ruiz–Arias, J. A., Alsamamra, H., Tovar–Pescador, J., and Pozo-Vázquez, D. (2010). Proposal of a regressive model for the hourly diffuse solar radiation under all sky conditions. Energy Convers. Manag. 51, 881–893. doi:10.1016/j.enconman.2009.11.024
Schmutz, W., Fehlmann, A., Finsterle, W., Kopp, G., and Thuillier, G. (2013). Total solar irradiance measurements with PREMOS/PICARD. AIP Conf. Proc. 1531, 624–627. doi:10.1063/1.4804847
Shang, K., Liu, Y., Wang, D., and Li, T. (2017). Study of separation model of direct and diffuse solar radiation on horizontal surface in low latitude area. Acta Energiae Solaris Sin. 38 (12), 3332–3338.
WMO (2014). Guide to meteorological instruments and methods of observation (WMO-No. 8/2014 edition). Geneva: World Meteorological Organization, 274–276.
Xing, H. Y., Chong, W., Sha, Y. Z., and Lv, W. (2022). Model for correcting global solar irradiance measured with rotating shadowband radiometer. Opt. Eng. 5 (4), 046001.
Younes, S., Claywell, R., and Muneer, T. (2005). Quality control of solar radiation data: present status and proposed new approaches. Energy 30, 1533–1549. doi:10.1016/j.energy.2004.04.031
Yvonne, B. L. H., and Wouter, H. K. (2007). Comparison of pyranometric and pyrheliometric methods for the determination of sunshine duration. J. Atmos. Ocean. Technol. 24, 835–846. doi:10.1175/jtech2013.1
Zhang, F., Qi, L. L., Ji, W., and Wang Ju, 王. (2017). Influence of atmosphere in different areas on middle-far infrared radiation transmission. Acta Opt. Sin. 37 (4), 0401002. doi:10.3788/aos201737.0401002
Keywords: atmospheric radiation, diffuse fraction, BRL model, clearness index, air mass
Citation: Xingguo Y, Wei C and Niguidula J (2025) Assessment of the diffuse-fraction estimation in China using the binary BRL model. Front. Energy Res. 12:1349889. doi: 10.3389/fenrg.2024.1349889
Received: 05 December 2023; Accepted: 29 November 2024;
Published: 01 September 2025.
Edited by:
Ahmed Amine Hachicha, University of Sharjah, United Arab EmiratesReviewed by:
Harry D. Kambezidis, National Observatory of Athens, GreeceShi Liu, Changchun University of Technology, China
Copyright © 2025 Xingguo, Wei and Niguidula. This is an open-access article distributed under the terms of the Creative Commons Attribution License (CC BY). The use, distribution or reproduction in other forums is permitted, provided the original author(s) and the copyright owner(s) are credited and that the original publication in this journal is cited, in accordance with accepted academic practice. No use, distribution or reproduction is permitted which does not comply with these terms.
*Correspondence: Chong Wei, Y2hvbmd3ZWlAY21hLmNu