 Brennan Harris
 Donna Post Guillen
 Asa Monson1
 Jonathan Sampson
- 1Idaho National Laboratory, Idaho Falls, ID, United States
- 2Massachusetts Institute of Technology, Cambridge, MA, United States
A digital process was developed to facilitate additive manufacturing for ceramic materials using digital light processing (DLP). A numerical model that predicts DLP sample properties can be generated from manufacturing inputs to forecast the effect of resin age on mechanical strength of the printed part based on data collected from experiments. Key parameters for printing the green bodies included determining the depth of cure, layer thickness, material composition, and solids loading. Thermogravimetric analyses were used to develop debinding and sintering curves. Debinding is used to remove the volatile organics comprising the photopolymer resin. Sintering is performed after debinding to increase density and mechanical strength of the printed parts. The sintered parts were then subjected to characterization and mechanical testing. The ensemble of data for various DLP-printed ceramic materials were added to a database. A design of experiments can be generated from the manufacturing process defined in the database with selected changeable parameters randomized over a range. Because the database is defined with an architecture to capture manufacturing processes, it can persist as a more generic platform for manufacturing digital twins. This can ease the development of future digital twins and can grow as a common repository for the insights gained from manufacturing research. Creating a digital twin of a DLP system for 3D printing parts enables manufacturers to simulate and assess the impact of resin age on printing parameters and part quality, facilitating optimization, predictive maintenance, and cost reduction.
1 Introduction
Additive manufacturing, a revolutionary approach to fabricating complex structures, has found a niche in ceramic materials through the advent of Digital Light Process (DLP) printing. This innovative digital process has been tailored to facilitate the additive manufacturing of ceramics, specifically Yttria-stabilized Zirconia (YSZ). In this study, we delve into the development of a digital model capable of predicting the properties of DLP-printed YSZ samples. The model’s foundation lies in manufacturing inputs and key parameters governing the production of ceramic-resin green bodies.
Following the printing process are the stages of debinding and sintering, which contribute to the enhancement of density and mechanical strength in the final printed parts. Following the manufacturing process, the sintered parts underwent comprehensive characterization and mechanical testing. While other studies have been performed using DLP for YSZ printed parts, the effect of resin age on the mechanical properties has not been evaluated. This study compares the mechanical strength of resin at 114 days from production to 324 days from production. Understanding how resin age affects printing quality can help in forecasting when maintenance or resin replacement might be needed in the actual system. This predictive maintenance approach can save time and resources by avoiding unexpected downtimes, part failures, and procurement inefficiencies. Assessing the effect of resin age digitally can potentially save costs associated with physical testing and experimentation. It enables fabricators of 3D printed parts to identify optimal resin usage strategies and minimize waste, thus reducing overall production costs.
In this study, sample characterization results were uploaded to a unique digital model built around a data ontology specific to advanced manufacturing methods. The use of a data ontology allows the data to be managed in a manner that both strictly controls the validity and completeness of the manufacturing data, but also provides the flexibility to define variants of This digital twin framework organized the varying manufacturing inputs, detected factors that changed between experiments, and generated a predictive model of YSZ strength in bending based on days since material feedstock synthesis and ambient humidity. The ontology is explored in its role to define both the data that is involved in the details of manufacturing and also the performance characteristics of interest with specific designs of experiment that tie them together.
The digital twin framework realized several advantages that would not be accomplished traditionally: the completeness of the data was enforced by the ontology meaning each experiment is fully defined with material properties, preform geometry, and all manufacturing settings, which is important for future reuse of data; the data was preprocessed automatically for analysis with a Gaussian process model; and, data entry efforts resulted in a queryable model that would return the predicted strength in bending value of YSZ samples (and accompanying measure of uncertainty) for a given combination of ambient humidity and days since synthesis of feedstock materials.
The predictive model resulting from the digital twin was tested with a random sampling of characterization results withheld from the modeling engine and used as a verification set. The model is reliable within the bounds of uncertainty returned by the Gaussian process. While a trend of decreasing strength was observed in the samples due to both increasing humidity and feedstock age, the strength of the whole set of materials was well below results expected based on published performance characteristics of YSZ. A discussion of factors that likely led to under performance is included. Future work should take greater care to apply a debinding/sintering heat treatment sourced from literature instead of manufacturer-supplied settings.
2 Materials and methods
2.1 Yttria-stabilized zirconia
YSZ is a material of interest for the design and manufacture of various energy systems. YSZ has unique balance of physical properties, encompassing electrical (Lanagan et al., 1989), thermal (Tojo et al., 1999; Hayashi et al., 2005), mechanical (Ren and Pan, 2014), and optical (Alaniz et al., 2009) properties. Because of its electrical performance it has been implemented in energy products such as solid oxide fuel cells (Butz, 2009) and because of its mechanical resilience at high temperatures it has been used as a thermal barrier coating (Zhao et al., 2006; Liu et al., 2019; Chen, 2006), both of which are of interest for energy applications. YSZ has been manufactured via traditional sintering (Laberty-Robert et al., 2003), colloidal suspension extrusion (Peng et al., 2018; Ghazanfari et al., 2017), and digital light processing (Coppola et al., 2022). In this study, 3 mol% YSZ was used for the DLP printing. Biomedical applications for this material include dental crowns Snyder (2022).
The YSZ used in this study was used to generate samples via a three-dimensional printing method that cures layers of photosensitive resin. As such, the green body for samples generated in this study makes use of granular YSZ suspended in a slurry of photosensitive resin which creates a layer-by-layer scaffolding to define geometry. The organic resin scaffold is later removed via postprocessing techniques, leaving only the YSZ in the final sample.
2.2 Digital light processing
DLP is an additive manufacturing method that uses ultraviolet light to cure thin layers of photosensitive liquid polymer resin to form solid samples (Zhao et al., 2020). Thanks to the possibility for far greater light intensity than other photocuring techniques, DLP printing can be used to fabricate parts from resin slurries that are made semiopaque through the addition of ceramic and metallic powders. The cured polymer-ceramic/metallic green bodies resultant from printing can then undergo the subsequent postprocesses of debinding to remove the polymer matrix and sintering to solidify the remaining material, resulting in printed parts consisting purely of the ceramic or metal. This method has been successfully applied to alumina (Santoliquido et al., 2019; Shuai et al., 2020), silicone oxycarbide (Schmidt and Colombo, 2018; He et al., 2020), zeolite (Guillen et al., 2023), zirconia compounds and barium titanate (Mamatha et al., 2022; Mu et al., 2022). An illustration of the components of the printing stage of the process is shown in Figure 1.
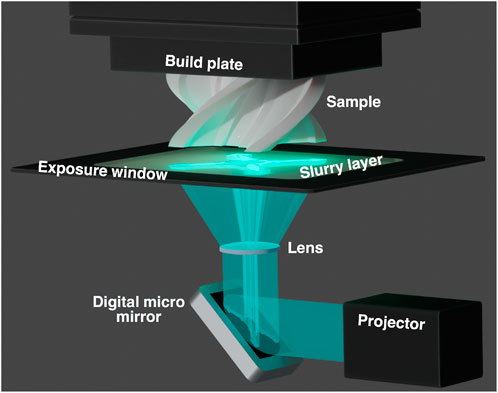
Figure 1. Components of digital light processing (printing stage).
2.2.1 Resin matrix
The photosensitive resin that acts as a temporary matrix for the YSZ acts is hardened via the interaction of the resin polymer and an additive photoinitiator. The photoinitiator is a constituent that is reactive to light exposure. When the photoinitiator is activated by light energy it generates molecular constituents that attract areas of the free floating polymer chains that make up the resin. The photoinitiators selected for these resins bind to them in such a way that multiple polymer chains can bind to a single activated element (Allen, 1996). As free floating polymers in the path of the directed light are bound together in large networks with cross linked elements, the engineering-scale effect of this process is that the material is hardened and fixed in those regions. These photoinitiating additives are known to degrade along with other resin elements over time after the resin mixture is formulated (Nagaoka et al., 2020).
2.3 Digital representation of manufacturing processes
2.3.1 Ontology
A digital approach to manufacturing often raises the issue of ontologies. An ontology is a set of concepts and classes that define the entities in a domain, their relationships, and their properties. Ontologies in manufacturing have been explored as a method to query information from manufacturing data (Usman et al., 2013), to automate manufacturing design and decision making (Sanfilippo et al., 2019), and to create interoperability among different manufacturing design software applications (Chungoora et al., 2013).
While efforts to create an ontology to link design engineering and manufacturing methods (Chhim et al., 2019) have been explored, the ontology efforts of this project are geared toward making a single model of a manufacturing process that can be be used for experimental design generation (via the response surface method), manufacturing, and simulation, all in the service of sample performance prediction. The ontology is called Advanced Manufacturing Basic Entity Relationships (AMBER) and is based on the ontology Data Integration Aggregated Model and Ontology for Nuclear Deployment (DIAMOND), funded by an award from the Department of Energy’s Office of Nuclear Energy (Browning et al., 2020). Both ontologies make use of the Basic Formal Ontology (BFO) entities (Arp et al., 2015) near the root for future interoperability with other BFO-compatible models. A diagram of the classes in the ontology is shown in Figure 2.
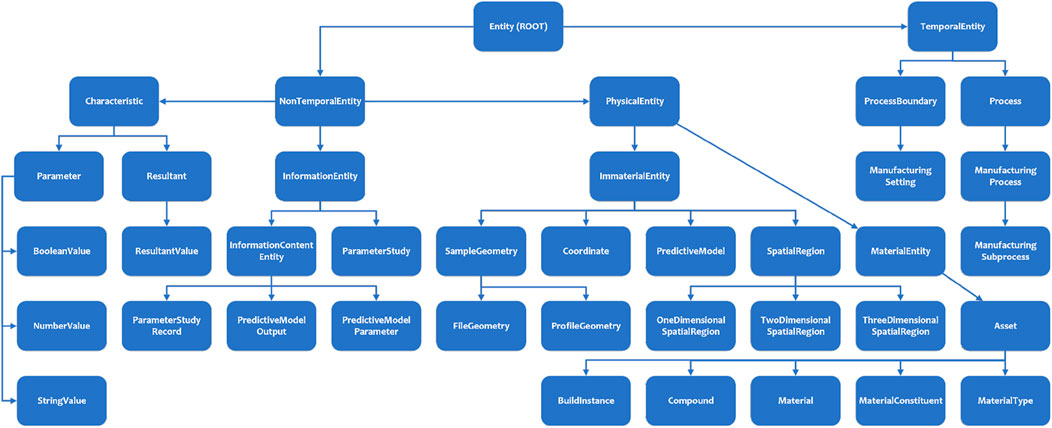
Figure 2. The inheritance relationships among the classes of the AMBER ontology.
The classes in the ontology are built around representing the properties and relationships that describe factors relevant both to the manufacturing of samples with DLP, and also the data modeling activities and numeric models necessary for making predictions from the relationship between these factors and the resultant performance of the samples.
The AMBER ontology is implemented in the Deep Lynx data lake (Darrington et al., 2020), a DOE-funded open source software utility. Deep Lynx allows ontologies to initialize a database, which can be used for storage, querying, and version control. For this project, the elements of a manufacturing build, decomposed by the definition and constraints of the process that generated it, feedstock material properties, and preform geometry, are all located in the same knowledge graph. The ontology also defines entities to store the resultant characteristics, that may be physical or simulated, and the predictive models themselves that are generated from the relationship between manufacturing inputs and outputs.
2.3.2 Predictive modeling
The response surface method (RSM) has been used widely in the search for optimal manufacturing parameters (Sik Shim, 2021; Geng et al., 2017; Al-Ahmari et al., 2016; Seo et al., 2017; Jagadish et al., 2016; Öktem et al., 2005). The method uses a constellation of techniques to systematically approach the discovery of optimal resultants in parameterized systems; the components of modern RSM involve generating a design of experiments, carrying out the designs, and using statistical techniques to correlate the relationship between design parameters and experimental resultant values. Typically, for techniques in which design parameters can be set continuously and independently within a set of ranges, the designs are generated using the central composite design or Box-Behnken design (de Oliveira et al., 2019). These methods define efficient designs that explore the contribution of parameters of interest across their available ranges. An alternative experimental design method was used for this study due to the constraints imposed by the manufacturing technique. Although layer height is of interest, batches of samples printed together must have the same basic layer height in order to print together. Because manufacturing was carried out in batches, there are discrete layer heights. As such the design method used in this study is a single parameter design.
Typically, once the experiments are carried out and the results recorded, the response surface is generated using a simple least squares regression. This study opts instead for a Gaussian Process Model (GPM), in order to create surfaces that not only predict regions of results inside the design envelope but also return uncertainty measurements as surfaces that bound the prediction surface. The RSM models were generated using utilities on the stochastic tools module (Slaughter et al., 2023) of the Multiphysics Object-Oriented Simulation Environment (MOOSE) simulation library (Lindsay et al., 2022). The library’s GPM is implemented as follows:
Given a set of input parameters
In much the same way a multivariate Gaussian distribution is fully defined by its mean and covariance matrix, the Gaussian Process [shown in Equation 1] is defined by two functions: the mean function and the covariance function, where
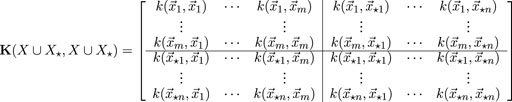
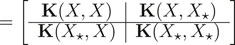
The mean function returns the mean value for any combination of parameters. The covariance function is meant to describe the relationship that the input parameters in the study have to one another. The output of the covariance function (also called a kernel function) is a covariance matrix that describes the complete set of parameters (every parameter’s relationship to every other parameter). The complete set of covariance matrices available from the kernel function are as follows in Equations 2–4:
With this definition of the covariance function and its output, along with the assumption that the distribution of the training data and the evaluation data will be roughly the same the model can undergo conditioning. The Gaussian Process Model starts with an infinite collection of functions such that any random selection of output variables from the collection will produce a normal distribution. In the conditioning process functions are winnowed down from the infinite set to only those functions that agree with the training and evaluation sets, according to the following in Equations 5, 6:
and the output of the model will be given as shown in Equation 7
The particular kernel function used for this study was the radial basis function. It contains the additional terms (or hyperparameters)
where
In this study’s implementation, the Gaussian process pulls its training data from the digital representation of a set of experiments. It prompts the user for initial hyperparameter values, trains the model, and stores the model executable in the graph for future reference and execution. Although the Gaussian process requires more data preparation and more operations than a simple fit using linear or polynomial regression, the digital twin framework uses the GPM in order to deliver models that return uncertainty bounds along with every point of evaluation. In the digital twin’s implementation, the manual data management usually involved with using the Gaussian model is handled by an interface that automates most onerous data preparation tasks.
2.4 Manufacture of physical samples
2.4.1 Sample geometry
Miniature three-point bend bars (25 mm × 4 mm x 1 mm) were printed using an Admatec Admaflex 130 DLP printer with commercially available photocurable YSZ resin (Admatec, Alkmaar, Netherlands). The samples printed in the study were designed using the ASTM C1161-18 design specification (ASTM International, 2018). This is a prismatic geometry optimized for testing the flexural strength of ceramic samples at ambient temperatures. The tesselated geometry was stored in the digital twin architecture as an STL file and also exported as a batch to the printer. Since the Admatec 130 build plate can accommodate 20 samples arranged in a grid pattern, 20 became the batch size wherein the layer height was held constant.
2.4.2 Feedstock formulation and print settings
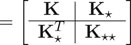
The print settings given in Table 1 were applied to all samples.
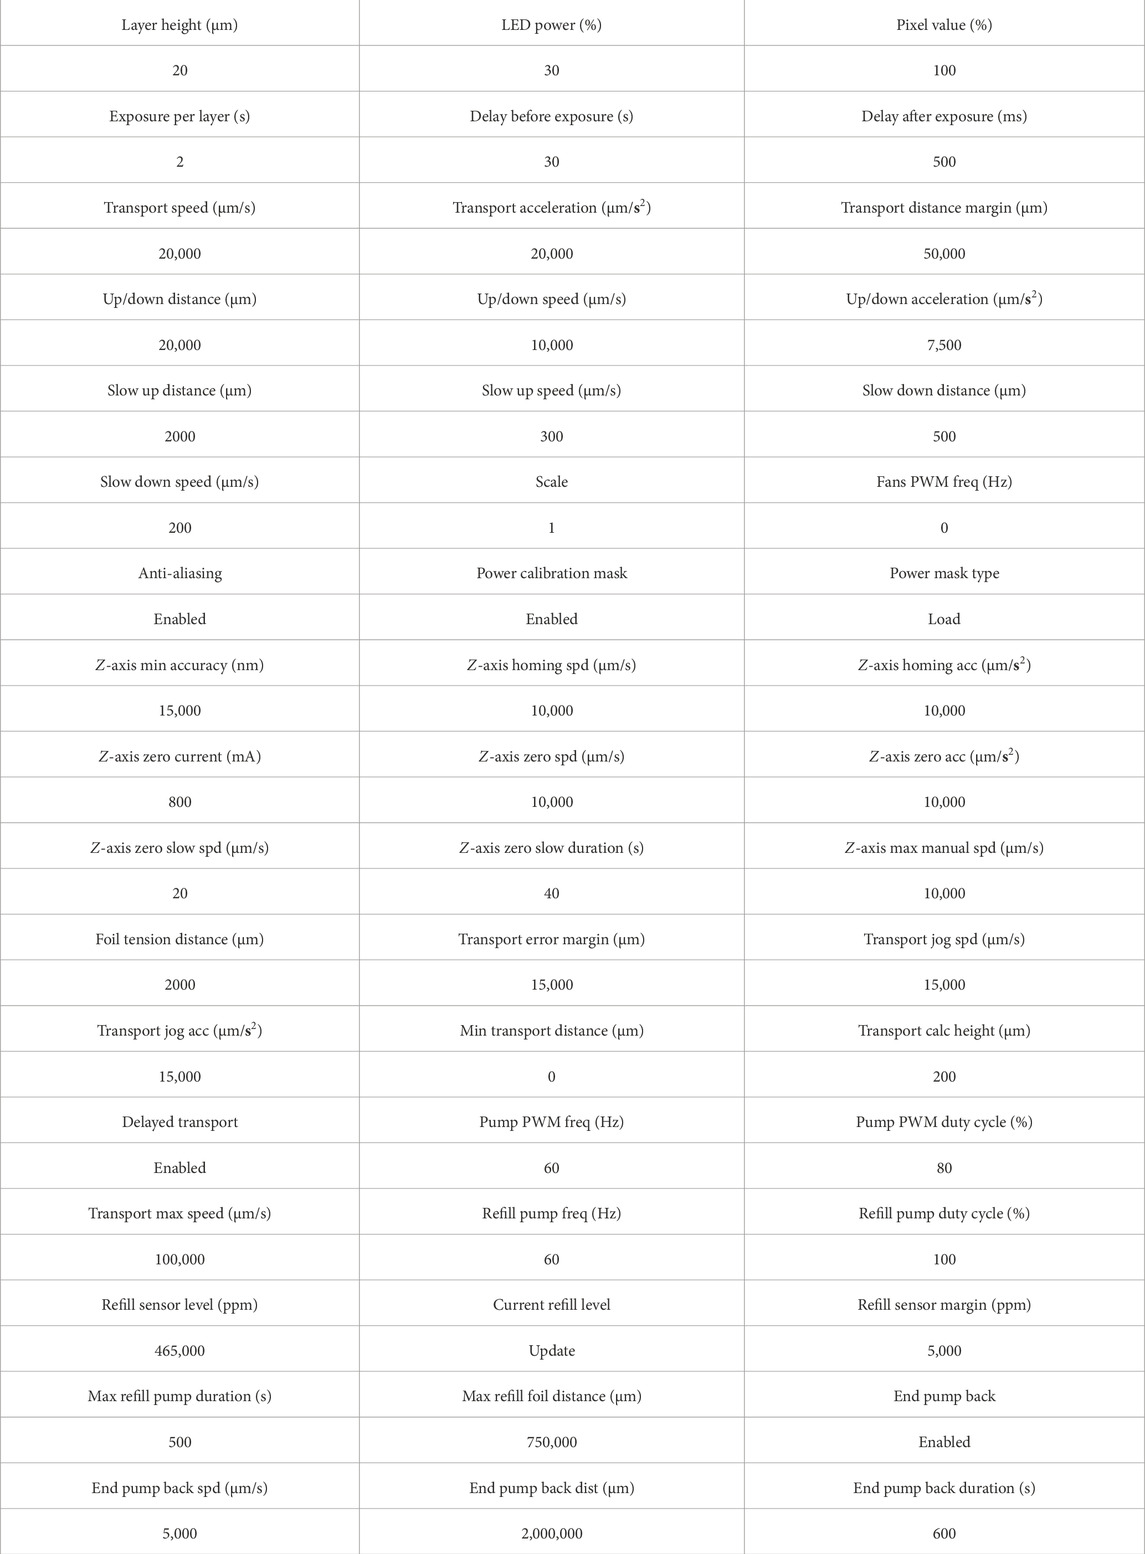
Table 1. Printing parameters used across all samples in the study.
The layer height was determined by a depth of cure test in which a small amount of the slurry is placed on the printing surface and exposed to a certain duration of light exposure. The cured material is measured from the printing base After printing, each sample was post-processed with the same thermal treatment that debinds the organic resin matrix and then sinters the remaining ceramic material to its final density. The profile of this heat application is listed in Table 2.
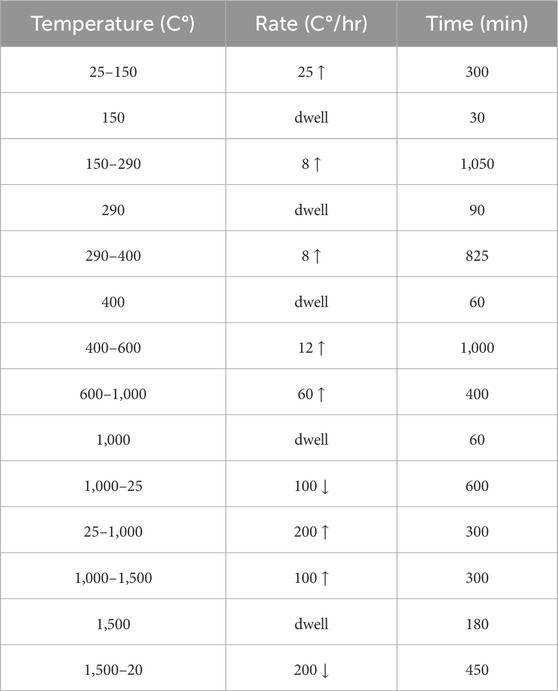
Table 2. Debind/sinter profile, shaded cells indicate the sintering phase.
One of the factors impacting the quality of printed samples is exposure to atmospheric humidity. The room in which the printing took place did not have a dehumidifier for the printing area nor for the lab space. Because of this, average humidity values during the time of printing (from 12:00 to 18:00, each day) was considered as a variable in the modeling effort, and as an element of the digital twin framework.
2.5 Mechanical testing
2.5.1 Flexural strength
Flexural strength is the ultimate strength (the stress at which a tested sample breaks or cracks) when subjected to a bending load. The flexural strength and the tensile strength of a material, especially a ceramic, are correlated values (Leguillon et al., 2015). The general standard practice for materials that are brittle, such as ceramics, is to use determine material performance for an application from flexural strength, as these measures tend to be the most representative of application performance (Yamaguchi et al., 2019).
Samples were measured for flexural strength using a three-point configuration as illustrated in Figure 3. Conducting three-point bend tests on ceramic materials, as opposed to tensile tests, is driven by several considerations rooted in the inherent characteristics of ceramics. Primarily, ceramics exhibit brittleness, and their tensile strength is notably lower than their compressive strength. Tensile loading can lead to premature and catastrophic failure due to the limited capacity of ceramics to withstand tensile stress. The high friction jaws used in tensile testing lead to many samples cracking, making this technique impractical for this study. In contrast, three-point bend tests provide a controlled environment for studying fracture mechanics, including crack initiation and propagation, which is essential for understanding how ceramics fail. Fracture mechanics in ceramics are better captured through three-point bend tests, as these tests facilitate the controlled study of crack propagation. Tensile tests may not effectively capture critical flaw sizes or stress intensity factors crucial for assessing the fracture process in brittle materials.
Figure 3. Three-point bend test frame.
Practically, ceramics are often employed in structural applications where they experience bending or flexural loads rather than tension. three-point bend tests simulate these real-world loading conditions, offering more relevant insights into how ceramics behave in practical applications. Additionally, the geometry of ceramic components frequently involves bending, making three-point bend tests more representative of actual service conditions. Moreover, the size and shape of samples for three-point bend tests are more manageable, requiring smaller specimens compared to the larger cross-sectional areas needed for tensile tests. Interpreting data from three-point bend tests is often more straightforward, with a more uniform stress distribution across the sample compared to tensile tests. This simplicity aids in relating the test results to the material’s properties.
Standardization further supports the preference for three-point bend tests in ceramics. Widely recognized testing methods, such as ASTM C1161-18, recommend three-point bend tests as the preferred approach for determining flexural strength and modulus of rupture. This standardization ensures consistency and comparability of results across different studies and laboratories, contributing to the robustness of data obtained from such tests.
3 Results
3.1 Sample performance
Seven sets of samples were printed from the same slurry batch which was synthesized on 15 May 2023. The sets were printed at the following days since synthesis: 114, 143, 175, 205, 236, 273, and 324. The long gap between synthesis and the first batch print was due do a shipping delay with the Admatech slurry. The flexural strength values from each sample are shown in Table 3. Each set was subjected to the interquartile range test for outliers, and the outliers were thrown out of the model development and analysis. The general trend of the progressively older samples is decreasing strength. Another thirteen samples were randomly selected and withheld as validation samples to test the confidence interval.
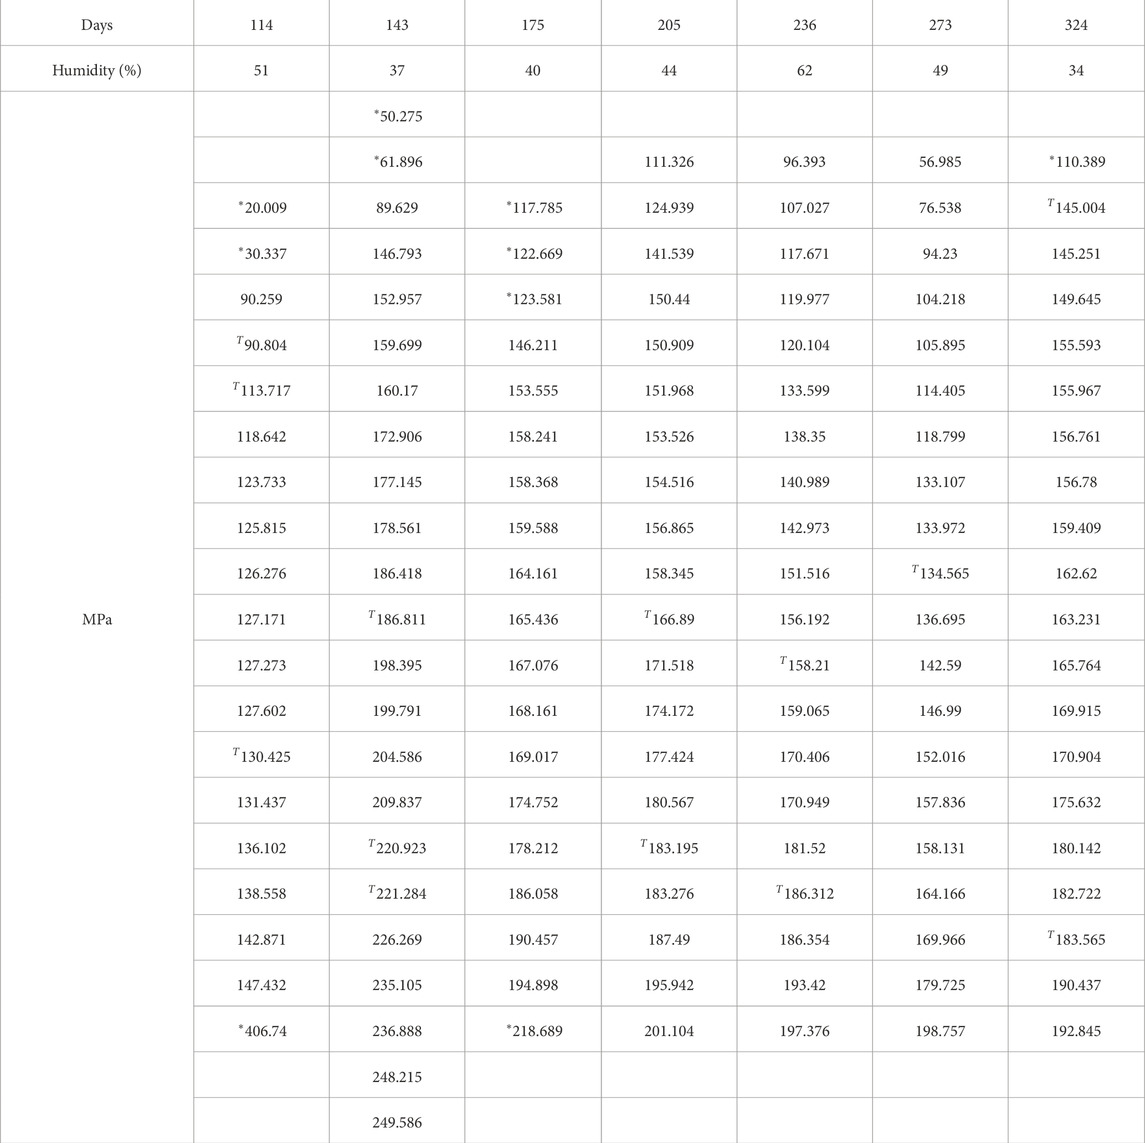
Table 3. Per-sample flexural strength values (MPa) gathered from bending tests organized by days since slurry synthesis. Outlier values are marked with an asterisk *. Validation samples are marked with a T.
The observed strength of the samples is well under the strength in bending for DLP-printed samples previously committed to literature. (Coppola et al., 2022; Zhang et al., 2020). The average strength in bending for samples in this study is about 160 MPa, while published results for DLP-printed samples for 3% mol YSZ have exceeded 350 MPa by Zhang et al. and exceeded 750 MPa by Coppola et al. Beyond humidity control, it is likely that the debind-sintering profile suggested by the manufacturer (shown in Table 2) led to poor densification of the material. Both listed studies sintered samples at a higher temperature than that suggested for our slurry by the manufacturer. Future work should control for the humidity during printing and also use the heat treatment parameters that led to optimum performance in published studies instead of slurry supplier recommendations.
3.2 Digital twin
The use of the term “twin” in digital twin implies the that there is another entity to which the digital system is coupled. Each digital twin should have a corresponding physical twin or process twin. Digital twins are digital representations of the state of a physical system, but also “designed around a two-way flow of information that occurs when object sensors provide relevant data to the system processor and then happens again when insights created by the processor are shared back with the original source object.” (IBM, 2021) AMMONOID, in this study, becomes a digital twin as it mirrors the features of the materials, geometry, and manufacturing parameters and records characterized data, but also exports control settings from the digital twin to the DLP printer to manufacture the samples according to the design of experiments generated in the digital system. In this study, all the material parameters, printer settings, and preform geometry values are saved such that the experiments could be replicated. The Gaussian model takes in ambient humidity and days since sythesis as inputs and predicts strength in bending as the output.
The use of the AMMONOID digital framework to record and model the experimental work resulted in a knowledge graph of the sample geometry, material properties, settings, post-processes, and experimental results of characterization. The graph also holds the resulting predictive model files that were generated using the GPM. A representation of the digital model is shown in Figure 4.
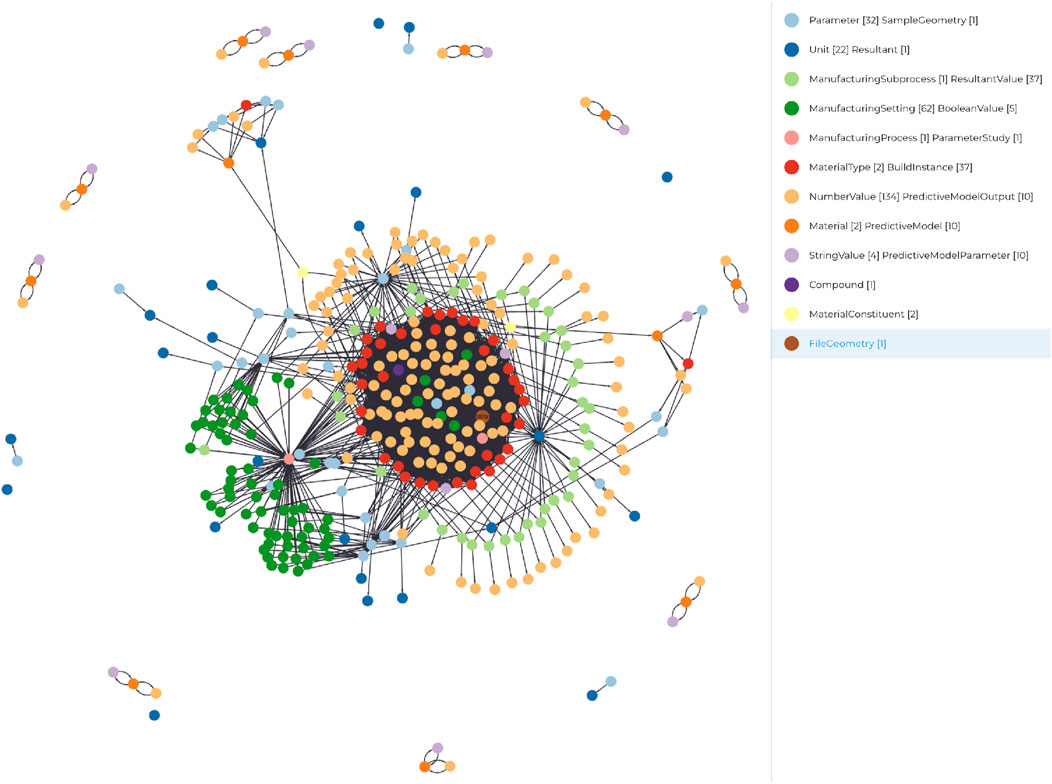
Figure 4. Graph view of the data making up the YSZ manufacturing model.
The digital model functions to store and query the manufacturing data, but also to prepare the manufacturing data for use by the GPM. The digital twin enforces completeness of the input parameters and resultant data, then formats the data as input to the modeling engine. Figure 4 shows nodes colored by their class types from the AMBER ontology (which are all displayed in Figure 2). This graph organization allows the data to be saved in a context outside of any particular study or design of experiment. Future studies that add more data with similar or dissimilar manufacturing parameters, materials, or preform geometry can find their way in the graph. By forced gathering of all manufacturing parameters in the study, future models that focus on parameters beside humidity and days since expiration for YSZ can make use of the data. This framework also creates a clear thread between the particular components of inputs and methods that generated a predictive model and the model itself. Changes to the upstream data can trigger a notification that a component of the model has been altered and that the model needs to be refit. This framework led to a progressive set of models that became more and more refined as new characterization results were added to the platform.
3.3 Outcome of RSM model
Different iterations of the model were trained until the 95% confidence intervals captured 95% of values. The final hyperparameter values are shown in Table 4. A randomized set of 10% of the characterized values was withheld from the model to use as a validation set. Twelve of the thirteen samples fell within the bounds of the 95% confidence interval, for a capture rate of 92%. The only sample to fall outside the interval is the sample with the strength of 90.804 in the 114 days set.
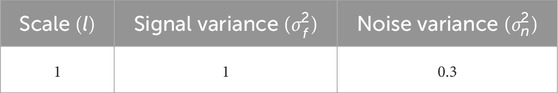
Table 4. Printing parameters used across all samples in the study.
Since the model was trained on both humidity and days since synthesis, the resultant model can be viewed as a 3D response surface, or as a 2D graph with one value held constant. The output of the GPM is shown in Figure 5. The model demonstrates the GPM’s ability to return confidence data which narrows in regions where training data is richer.
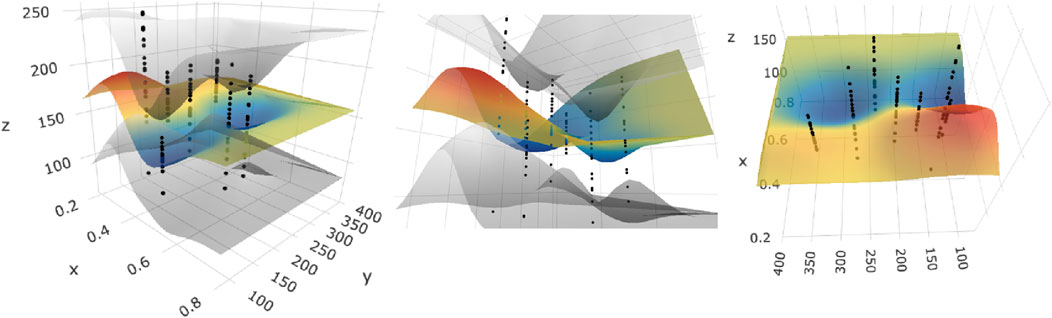
Figure 5. The results of the GPM shown inside the range of non-constant output. The color surface represents the predicted strength in bending value. The x-axis represents humidity and the y-axis represents days since synthesis. The grey surfaces represent the upper and lower 95% confidence bounds. The black dots are measured experimental values.
The 3D model, unsurprisingly, shows a peak in sample performance when both the humidity and the days since synthesis are lowest. Figure 6 shows the 2D cross sections of the surface at various single-value selections of the parameter that demonstrate trends for each variable, and also variability in the model results for different regions of the parameter space. The model demonstrates both a general negative correlation between humidity and strength and days since synthesis and strength. The areas of highest confidence (as represented by the narrowest confidence interval bands) show the decline in strength most strongly.
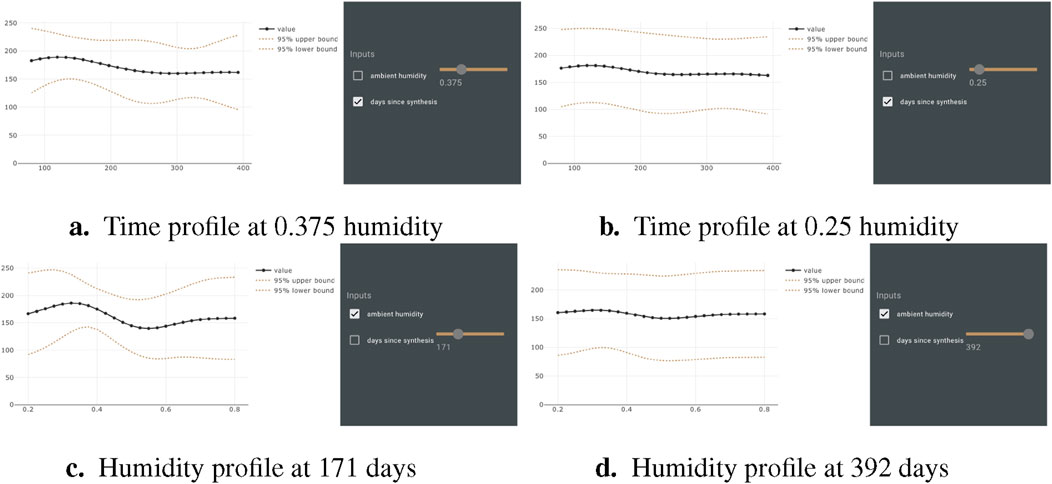
Figure 6. 2D profiles for days since synthesis and humidity with each paired parameter locked at a specific value. (A) Time profile at 0.375 humidity (B) Time profile at 0.25 humidity (C) Humidity profile at 171 days (D) Humidity profile at 392 days
The outcome of the experimental results, the digital twin, and the RSM show that the use of these research modalities in conjunction provide a unique enabling of advanced manufacturing research for high energy applications. Manufacturing researchers and technicians, in the normal course of sample production, create a searchable knowledge graph of their data for future study. They also are able to create data-driven predictive models of the performance characteristics of the samples they are creating. In summary, creating a digital twin of a DLP system for 3D printing allows for comprehensive exploration and understanding of how resin age affects printing performance and part quality, leading to more efficient and optimized production processes.
Data availability statement
The raw data supporting the conclusions of this article will be made available by the authors, without undue reservation.
Author contributions
BH: Conceptualization, Data curation, Funding acquisition, Methodology, Project administration, Software, Visualization, Writing–original draft, Writing–review and editing. DP: Conceptualization, Methodology, Writing–original draft, Writing–review and editing. AM: Data curation, Formal Analysis, Methodology, Writing–review and editing. JS: Data curation, Software, Writing–review and editing.
Funding
The author(s) declare that financial support was received for the research, authorship, and/or publication of this article. The authors gratefully acknowledge support from Idaho National Laboratory’s Laboratory Directed Research and Development Program, project identifier 22A1059-044FP. This manuscript has been authored by Battelle Energy Alliance, LLC under Contract No. DE-AC07-05ID14517 with the US Department of Energy. The funder was not involved in the study design, collection, analysis, interpretation of data, the writing of this article, or the decision to submit it for publication.
Conflict of interest
The authors declare that the research was conducted in the absence of any commercial or financial relationships that could be construed as a potential conflict of interest.
The reviewer VY declared a shared affiliation with the Authors VH, DPG, & AM to the handling editor at the time of review.
Publisher’s note
All claims expressed in this article are solely those of the authors and do not necessarily represent those of their affiliated organizations, or those of the publisher, the editors and the reviewers. Any product that may be evaluated in this article, or claim that may be made by its manufacturer, is not guaranteed or endorsed by the publisher.
References
Al-Ahmari, A., Ashfaq, M., Alfaify, A., Abdo, B., Alomar, A., and Dawud, A. (2016). Predicting surface quality of γ-tial produced by additive manufacturing process using response surface method. J. Mech. Sci. Technol. 30, 345–352. doi:10.1007/s12206-015-1239-y
Alaniz, J., Perez-Gutierrez, F., Aguilar, G., and Garay, J. (2009). Optical properties of transparent nanocrystalline yttria stabilized zirconia. Opt. Mater. 32, 62–68. doi:10.1016/j.optmat.2009.06.004
Allen, N. S. (1996). Photoinitiators for uv and visible curing of coatings: mechanisms and properties. J. Photochem. Photobiol. A Chem. 100, 101–107. doi:10.1016/S1010-6030(96)04426-7
Arp, R., Smith, B., and Spear, A. (2015). Building ontologies with basic formal ontology. The MIT Press.
ASTM International (2018). “Standard test method for flexural strength of advanced ceramics at ambient temperature,”. ASTM International, West Conshohocken, PA. (ASTM Standard No. C1161-18).
Browning, J. M., Al Rashdan, A. Y., Ritter, C. S., Settle, J., Gracely, J., and of Nuclear Energy, U. O. (2020). Data integration aggregated model for nuclear deployment. doi:10.11578/dc.20200501.1
Butz, B. (2009). Yttria-doped zirconia as solid electrolyte for fuel-cell applications. Ph.D. thesis. Karlsruher Institutes für Technol. doi:10.5445/IR/1000015724
Chen, L. (2006). Yttria-stabilized zirconia thermal barrier coatings — a review. Surf. Rev. Lett. 13, 535–544. doi:10.1142/S0218625X06008670
Chhim, P., Chinnam, R., and Sadawi, N. (2019). Product design and manufacturing process based ontology for manufacturing knowledge reuse. J. Intelligent Manuf. 30, 905–916. doi:10.1007/s10845-016-1290-2
Chungoora, N., Young, R., Gunendran, G., Palmer, C., Usman, Z., Anjum, N., et al. (2013). A model-driven ontology approach for manufacturing system interoperability and knowledge sharing. Comput. Industry 64, 392–401. doi:10.1016/j.compind.2013.01.003
Coppola, B., Schmitt, J., Lacondemine, T., Tardivat, C., Montanaro, L., and Palmero, P. (2022). Digital light processing stereolithography of zirconia ceramics: slurry elaboration and orientation-reliant mechanical properties. J. Eur. Ceram. Soc. 42, 2974–2982. doi:10.1016/j.jeurceramsoc.2022.01.024
Darrington, J., Browning, J., Ritter, C., of Energy Efficiency, U. O., and Energy, R. (2020). Deep lynx: digital engineering integration hub. doi:10.11578/dc.20200929.1
de Oliveira, L., de Paiva, A., Balestrassi, P., Ferreira, J., da Costa, S., and da Silva Campos, P. (2019). Response surface methodology for advanced manufacturing technology optimization: theoretical fundamentals, practical guidelines, and survey literature review. Int. J. Adv. Manuf. Technol. 104, 1785–1837. doi:10.1007/s00170-019-03809-9
Geng, H., Xiong, J., Huang, D., Lin, X., and Li, J. (2017). A prediction model of layer geometrical size in wire and arc additive manufacture using response surface methodology. Int. J. Adv. Manuf. Technol. 93, 175–186. doi:10.1007/s00170-015-8147-2
Ghazanfari, A., Li, W., Leu, M., Watts, J., and Hilmas, G. (2017). Additive manufacturing and mechanical characterization of high density fully stabilized zirconia. Ceram. Int. 43, 6082–6088. doi:10.1016/j.ceramint.2017.01.154
Guillen, D. P., Monson, A., and Urban-Klaehn, J. (2023). Sintering study of digital light process printed zeolite by positron, thermogravimetric and x-ray techniques. Next Mater. 3, 100066. doi:10.1016/j.nxmate.2023.100066
Hayashi, H., Saitou, T., Maruyama, N., Inaba, H., Kawamura, K., and Mori, M. (2005). Thermal expansion coefficient of yttria stabilized zirconia for various yttria contents. Solid State Ionics 176, 613–619. doi:10.1016/j.ssi.2004.08.021
He, C., Ma, C., Li, X., Yan, L., Hou, F., Liu, J., et al. (2020). Polymer-derived sioc ceramic lattice with thick struts prepared by digital light processing. Addit. Manuf. 35, 101366. doi:10.1016/j.addma.2020.101366
Jagadish, R., Bhowmik, S., and Ray, A. (2016). Prediction and optimization of process parameters of green composites in awjm process using response surface methodology. Int. J. Adv. Manuf. Technol. 87, 1359–1370. doi:10.1007/s00170-015-8281-x
Laberty-Robert, C., Ansart, F., Deloget, C., Gaudon, M., and Rousset, A. (2003). Dense yttria stabilized zirconia: sintering and microstructure. Ceram. Int. 29, 151–158. doi:10.1016/S0272-8842(02)00099-8
Lanagan, M., Yamamoto, J., Bhalla, A., and Sankar, S. (1989). The dielectric properties of yttria-stabilized zirconia. Mater. Lett. 7, 437–440. doi:10.1016/0167-577X(89)90047-5
Leguillon, D., Éric, M., and Lafarie-Frenot, M.-C. (2015). Flexural vs. tensile strength in brittle materials. Comptes Rendus Mécanique 343, 275–281. doi:10.1016/j.crme.2015.02.003
Lindsay, A. D., Gaston, D. R., Permann, C. J., Miller, J. M., Andrš, D., Slaughter, A. E., et al. (2022). 2.0 - MOOSE: enabling massively parallel multiphysics simulation. SoftwareX 20, 101202. doi:10.1016/j.softx.2022.101202
Liu, Q., Huang, S., and He, A. (2019). Composite ceramics thermal barrier coatings of yttria stabilized zirconia for aero-engines. J. Mater. Sci. and Technol. 35, 2814–2823. Ultra High Temperature Ceramic Matrix Composites Design and Application. doi:10.1016/j.jmst.2019.08.003
Mamatha, S., Biswas, P., and Johnson, R. (2022). Digital light processing of ceramics: an overview on process, materials and challenges. Prog. Addit. Manuf. 8, 1083–1102. doi:10.1007/s40964-022-00379-3
Mu, Y., Chen, J., An, X., Liang, J., Li, J., Zhou, Y., et al. (2022). Defect control in digital light processing of high-solid-loading ceramic core. Ceram. Int. 48, 28739–28744. doi:10.1016/j.ceramint.2022.06.141
Nagaoka, H., Bishop, S., and Roberts, H. (2020). Flexural performance of direct resin composite restorative materials past expiration date. Eur. J. Dent. 14, 217–223. doi:10.1055/s-0040-1709922
Öktem, H., Erzurumlu, T., and Kurtaran, H. (2005). Application of response surface methodology in the optimization of cutting conditions for surface roughness. J. Mater. Process. Technol. 170, 11–16. doi:10.1016/j.jmatprotec.2005.04.096
Peng, E., Wei, X., Garbe, U., Yu, D., Edouard, B., Liu, A., et al. (2018). Robocasting of dense yttria-stabilized zirconia structures. J. Mater. Sci. 53, 247–273. doi:10.1007/s10853-017-1491-x
Ren, X., and Pan, W. (2014). Mechanical properties of high-temperature-degraded yttria-stabilized zirconia. Acta Mater. 69, 397–406. doi:10.1016/j.actamat.2014.01.017
Sanfilippo, E., Belkadi, F., and Bernard, A. (2019). Ontology-based knowledge representation for additive manufacturing. Comput. Industry 109, 182–194. doi:10.1016/j.compind.2019.03.006
Santoliquido, O., Colombo, P., and Ortona, A. (2019). Additive manufacturing of ceramic components by digital light processing: a comparison between the “bottom-up” and the “top-down” approaches. J. Eur. Ceram. Soc. 39, 2140–2148. doi:10.1016/j.jeurceramsoc.2019.01.044
Schmidt, J., and Colombo, P. (2018). Digital light processing of ceramic components from polysiloxanes. J. Eur. Ceram. Soc. 38, 57–66. doi:10.1016/j.jeurceramsoc.2017.07.033
Seo, J., Kim, J., Lee, M., You, K., Moon, J., Lee, D., et al. (2017). Multi-objective optimization of tungsten cmp slurry for advanced semiconductor manufacturing using a response surface methodology. Mater. and Des. 117, 131–138. doi:10.1016/j.matdes.2016.12.066
Shuai, X., Zeng, Y., Li, P., and Chen, J. (2020). Fabrication of fine and complex lattice structure al2o3 ceramic by digital light processing 3d printing technology. J. Mater. Sci. 55, 6771–6782. doi:10.1007/s10853-020-04503-y
Sik Shim, D. (2021). Effects of process parameters on additive manufacturing of aluminum porous materials and their optimization using response surface method. J. Mater. Res. Technol. 15, 119–134. doi:10.1016/j.jmrt.2021.08.010
Slaughter, A. E., Prince, Z. M., German, P., Halvic, I., Jiang, W., Spencer, B. W., et al. (2023). Moose stochastic tools: a module for performing parallel, memory-efficient in situ stochastic simulations. SoftwareX 22, 101345. doi:10.1016/j.softx.2023.101345
Snyder, N. (2022) “Digital light processing (dlp) of yttria-stabilized-zirconia (ysz),”. University of Nebraska-Lincoln, Lincoln, NE.
Tojo, T., Atake, T., Mori, T., and Yamamura, H. (1999). Heat capacity and thermodynamic functions of zirconia and yttria-stabilized zirconia. J. Chem. Thermodyn. 31, 831–845. doi:10.1006/jcht.1998.0481
Usman, Z., Young, R., Chungoora, N., Palmer, C., Case, K., and Harding, J. (2013). Towards a formal manufacturing reference ontology. Int. J. Prod. Res. 51, 6553–6572. doi:10.1080/00207543.2013.801570
Yamaguchi, H., Tatami, J., and Iijima, M. (2019). Measurement of mechanical properties of batio3 layer in multi-layered ceramic capacitor using a microcantilever beam specimen. J. Ceram. Soc. Jpn. 127, 335–338. doi:10.2109/jcersj2.19030
Zhang, K., He, R., Ding, G., Feng, C., Song, W., and Fang, D. (2020). Digital light processing of 3y-tzp strengthened zro2 ceramics. Mater. Sci. Eng. 774, 138768. doi:10.1016/j.msea.2019.138768
Zhao, H., Yu, F., Bennett, T., and Wadley, H. (2006). Morphology and thermal conductivity of yttria-stabilized zirconia coatings. Acta Mater. 54, 5195–5207. doi:10.1016/j.actamat.2006.06.028
Keywords: digital twin, digital light processing, ceramics, additive manufacturing, response surface modeling
Citation: Harris B, Post Guillen D, Monson A and Sampson J (2024) Digital light processing of yttria-stabilized zirconia: Modeling photoinitiator decay. Front. Energy Res. 12:1356571. doi: 10.3389/fenrg.2024.1356571
Received: 15 December 2023; Accepted: 13 September 2024;
Published: 30 September 2024.
Edited by:
Carlo Fiorina, Texas A and M University, United StatesReviewed by:
Vaibhav Yadav, Idaho National Laboratory (DOE), United StatesYusheng Shi, Huazhong University of Science and Technology, China
Copyright © 2024 Harris, Post Guillen, Monson and Sampson. This is an open-access article distributed under the terms of the Creative Commons Attribution License (CC BY). The use, distribution or reproduction in other forums is permitted, provided the original author(s) and the copyright owner(s) are credited and that the original publication in this journal is cited, in accordance with accepted academic practice. No use, distribution or reproduction is permitted which does not comply with these terms.
*Correspondence: Brennan Harris, YnJlbm5hbi5oYXJyaXNAaW5sLmdvdg==