 Pablo A. García-Salaberri
 Prodip K. Das
 Antonio M. Chaparro
- 1Departamento de Ingeniería Térmica y de Fluidos, Universidad Carlos III de Madrid, Leganés, Spain
- 2School of Engineering, University of Edinburgh, Edinburgh, United Kingdom
- 3Departamento de Energía, Centro de Investigaciones Energéticas, Medioambientales y Tecnológicas, Madrid, Spain
Next-generation polymer electrolyte fuel cells (PEFCs) require an integral design of the porous structure of electrodes at different scales to improve performance and enlarge durability while reducing cost. One of today’s biggest challenges is the stable, high-performance operation at low Pt loading due to the detrimental effect of the local oxygen transport resistance caused by ionomer around catalyst sites. Hindered local oxygen transport arises from sluggish kinetics at the local reaction environment, that comprises adsorption at (wet) ionomer and Pt interfaces, and diffusivity of gas species in ionomer and water. Diverse factors affect oxygen transport, including operating conditions (relative humidity, temperature, and pressure), ionomer content and morphology, ionomer heterogeneity, porosity of carbon support, catalyst dispersity, and flooding. To attain performance and durability targets, it is essential to maximize the oxygen utilization of the catalyst layer by implementing enhanced membrane electrode assembly architectures. This involves employing advanced catalyst layer preparation techniques, including electrospraying, to generate optimized highly porous morphologies. Furthermore, achieving these targets necessitates the development of new materials with tailored properties, such as high permeability and porous ionomers, among other innovative strategies.
1 Introduction
Polymer electrolyte fuel cells (PEFCs) stand at the forefront of sustainable energy technologies, holding the promise to revolutionize the landscape of power generation and transportation. As we navigate an era marked by the urgent need for cleaner and more efficient energy sources, PEFCs emerge as a beacon of innovation, offering a pathway toward reduced greenhouse gas emissions and enhanced energy security through the use of clean hydrogen as fuel (Fan et al., 2021; Yue et al., 2021). The appeal of PEFCs extends beyond their high energy conversion efficiency. Their scalability, rapid start-up times, and low operating temperatures make them well-suited for diverse applications, ranging from portable electronic devices to stationary power generation and fuel cell vehicles (Wee, 2007). Although the first demonstration of a fuel-cell passenger car dates back several decades, only two car manufacturers (Toyota and Hyundai) are actively producing fuel-cell cars at present (Das et al., 2023). Their market reach is constrained by various factors. One significant obstacle is the inadequate availability of hydrogen infrastructure and renewable hydrogen. However, perhaps the most pivotal impediment is the performance, durability, and cost of fuel-cell vehicles. Currently, these factors do not match up competitively with internal combustion engine (ICE) vehicles (Pollet et al., 2019; Whiston et al., 2019). To attain a more substantial market share and facilitate widespread commercialization of fuel cell vehicles (FCVs), there is a pressing need for enhancements that bring their performance, durability, and cost more in line with conventional ICE vehicles.
The primary performance, cost, and durability metrics for the PEFC system are detailed in Table 1, projecting values for both 2030 and 2050 as interim and ultimate targets, respectively. The data in Table 1 are a durability-adjusted cost of an 80-kWnet PEFC system based on a projection to high volume manufacturing at 100,000 units/year (Das et al., 2023; U.S. Department of Energy, 2022; James et al., 2021). The data underscore notable advancements in both performance and durability over recent decades, with the current status closely approaching the 2030 targets set by the U.S. Department of Energy (Das et al., 2023; U.S. Department of Energy, 2022). Despite these positive strides, the present cost of PEFC systems for passenger cars remains above US$50/kW, necessitating a further 40% reduction to meet the ultimate target of US$30/kW (Cullen et al., 2021; James et al., 2021).

Table 1. Key target metrics for performance, cost, and durability of PEFC system for 2030 (interim) and 2050 (ultimate) (Das et al., 2023).
While the cost, performance, and durability of fuel cells are intricately linked, there is a noteworthy effort to decrease the cost of fuel cell materials of the membrane electrode assembly (MEA), with a specific focus on Pt catalysts, given their substantial contribution to overall fuel cell cost (Nonoyama et al., 2011; Kongkanand and Mathias, 2016; Ganesan and Narayanasamy, 2019; Jiao et al., 2021). Many researchers and FCV manufacturers have already provided avenues for reducing Pt loading in catalyst layers, including Nissan, Toyota, and General Motors. They also noted that there is a lack of understanding about the performance of low Pt-loaded electrodes, which stems from the concentration polarization at low Pt loading. As shown in Figure 1A, when the Pt loading decreases, the local oxygen transport resistance through the thin ionomer film covering the Pt particles increases significantly (Sakai et al., 2009; Ono et al., 2010; Nonoyama et al., 2011; Greszler et al., 2012; Owejan et al., 2013; Kongkanand and Mathias, 2016; Schuler et al., 2019). Consequently, the local oxygen transport resistance at low Pt loading has been attributed to the ionomer coating around the Pt surface. Efficient proton conduction at low Pt loading can be achieved by adjusting the ionomer-to-carbon weight ratio in the catalyst layer (Sabarirajan et al., 2020). However, achieving optimal oxygen transport simultaneously is complicated.
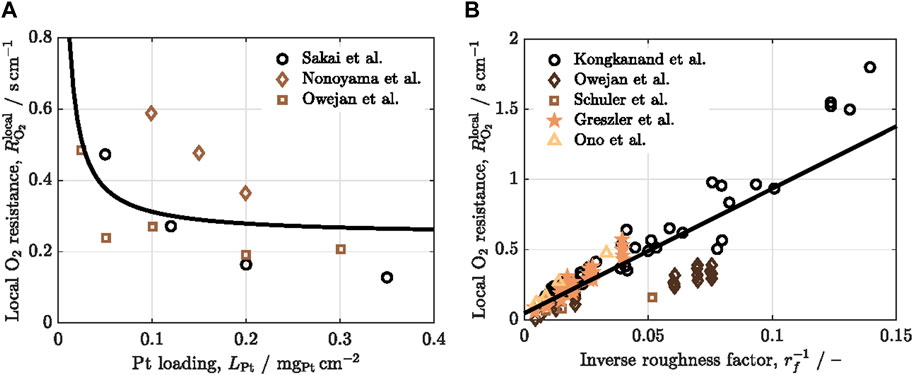
Figure 1. Variation of the local oxygen transport resistance,
The efficient transport of oxygen to the catalyst sites is crucial for minimizing activation and concentration polarizations as well as ensuring the availability of oxygen for the electrochemical reaction during the reduction of oxygen molecules at the cathode catalyst layer. As shown in Figure 2, oxygen transport within the catalyst layer is intricately connected to both the adsorption of oxygen from the gas phase onto the catalyst surface through the ionomer and the subsequent diffusion of oxygen within the ionomer (Nonoyama et al., 2011). Experimental measurement of oxygen transport resistance in the catalyst layer involves distinguishing between molecular/Knudsen diffusion and local resistance through the thin ionomer films to the catalyst surface (Nonoyama et al., 2011; Weber et al., 2012; Wang et al., 2017). Researchers have utilized various methods to assess oxygen transport resistance in the catalyst layer, among which are the gas crossover method (Iden et al., 2013a) and the limiting current method (Baker et al., 2009; Nonoyama et al., 2011; Greszler et al., 2012).
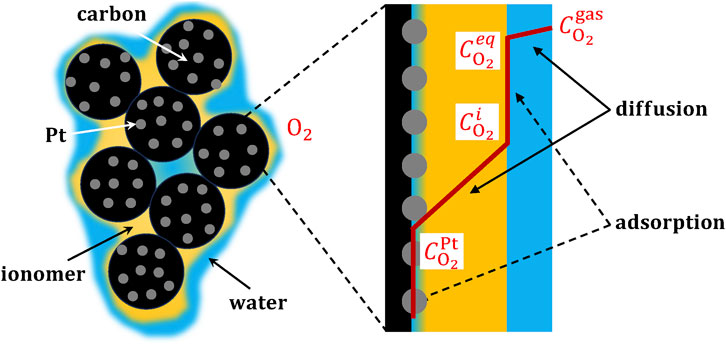
Figure 2. Schematic of the local oxygen transport resistance, composed of adsorption at (wet) ionomer and Pt interfaces, and diffusion across water and ionomer thin films.
Greszler et al. (Greszler et al., 2012) emphasized that the partial pressure of oxygen at the Pt surface can experience a notable reduction at low Pt loading. This reduction can result in severe performance degradation of fuel cells, particularly during high-power operations. It was concluded that oxygen transport resistance is inversely proportional to Pt loading or Pt surface area. Nonoyama et al. (Nonoyama et al., 2011) experimentally measured oxygen transport resistance using limiting current density. They identified three components of oxygen transport resistance: molecular diffusion, Knudsen diffusion, and permeation through the ionomer film. Their findings indicated that the primary contributor to the transport resistance is the permeation through the ionomer film. Wang et al. (Wang et al., 2017) similarly concluded that local transport significantly influences the oxygen transport resistance to active catalyst sites. They found that it could account for up to 77% of the total cathode catalyst layer resistance when Pt loading is reduced to 0.05 mgPt cm−2. Although previous studies associated performance loss with low Pt loading due to local transport resistance, Owejan and colleagues delved deeper into the matter (Owejan et al., 2013). They emphasized that transport resistance through the ionomer coating is not solely a function of Pt loading but is also influenced by both Pt surface area and particle dispersion. Indeed, as shown in Figure 1B, the local oxygen transport resistance depends linearly on the roughness factor, defined as the product of the Pt loading and the electrochemical surface area (ECSA). Moreover, factors such as oxygen mole fraction, relative humidity, operating pressure, and temperature have been identified as influencing local transport resistance (Choo et al., 2015; Shen et al., 2017). Researchers have proposed that the local oxygen transport resistance may not solely arise from oxygen transport within the thin ionomer film. Instead, it might be an apparent interfacial resistance resulting from the interaction between the acid site of the ionomer and the polarized catalyst (Liu et al., 2015).
Certainly, the intricate dynamics of oxygen transport resistance, involving factors such as electrode thickness, Pt loading, Pt surface area, and particle dispersion, pose a substantial challenge that can hinder the overall performance of fuel cells. Consequently, it is crucial to delve into the specifics of local oxygen transport resistance, emphasizing its origin, dependencies, and potential strategies for mitigation. Understanding these intricacies is paramount for enhancing and optimizing fuel cell performance and reducing cost. Indirect strategies to improve oxygen transport, such as flow-field design, are not addressed here.
2 Dependencies
The most influential factors on the local oxygen transport resistance are discussed below, including: i) relative humidity, temperature and pressure, ii) ionomer content and morphology, iii) ionomer distribution, iv) carbon porosity, and v) additional factors. The factors organized in order of their impact on the local oxygen transport resistance are listed in Table 2. The most influential factors appear to be those related to the amount and permeability of ionomer surrounding catalyst particles and the number of electrochemically activated sites (i.e., ionomer porosity, I/C ratio, and relative humidity).
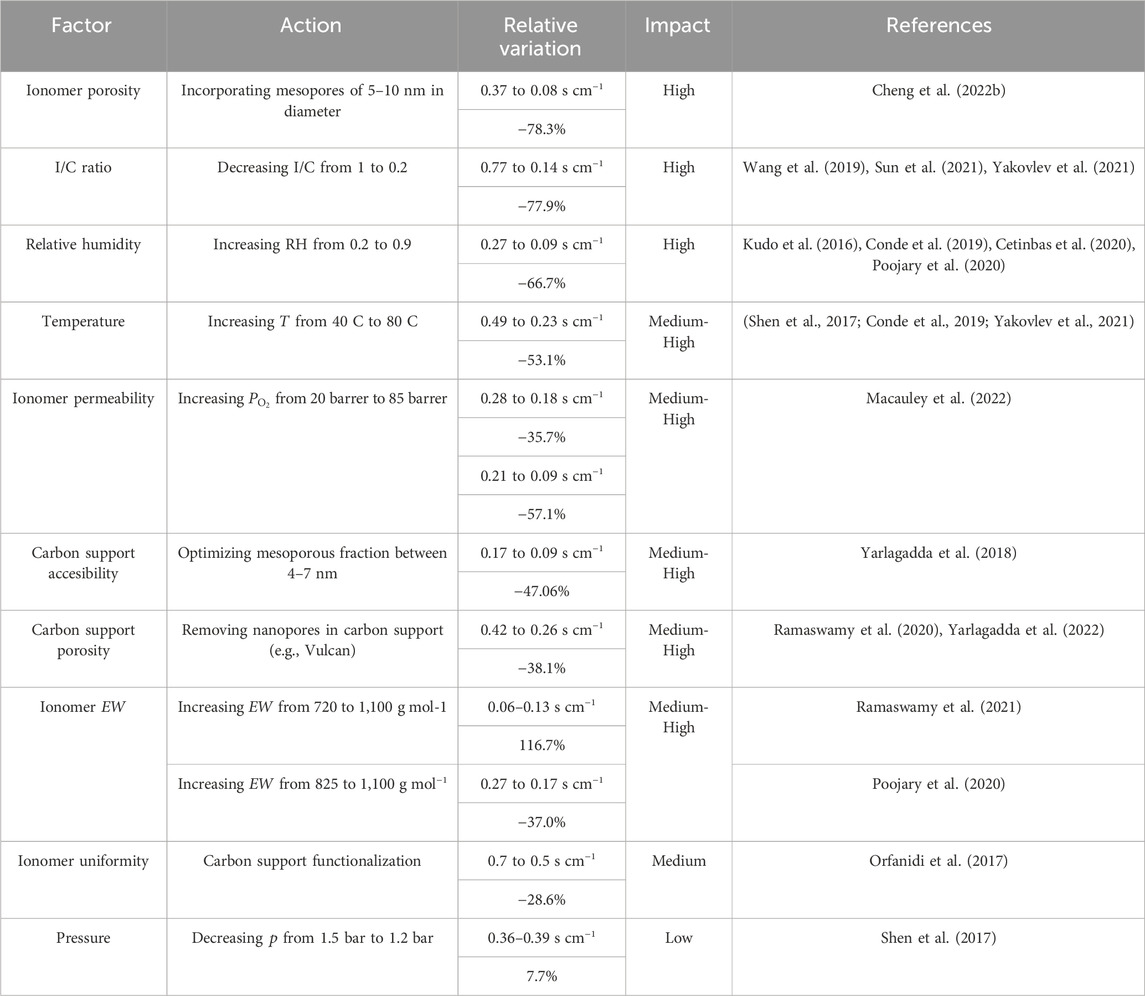
Table 2. Impact of factors that affect the local oxygen transport resistance, according to the relative variation of the resistance value. The impact is categorized as low, medium, medium-high and high.
2.1 Effect of relative humidity, temperature and pressure
The oxygen flux from the bulk gas space toward the catalyst surface can be decomposed into three mechanisms (see Figure 2): i) oxygen adsorption from the gas phase into the ionomer, ii) oxygen diffusion inside the ionomer, and iii) oxygen adsorption from the ionomer to the catalyst surface (Nonoyama et al., 2011). In a first approximation, the contribution of water films present at either the inner and/or outer surfaces of the ionomer film is neglected due to their lower effect on the local oxygen transport resistance compared to the above three mechanisms. The expressions of the oxygen flux,
where
The equilibrium oxygen concentration,
where
Considering that the above three transport processes are arranged in series, the overall oxygen transport resistance is
which can be re-expressed in terms of the oxygen equilibrium concentration,
The relationship between the equilibrium and bulk oxygen concentrations is given by the adsorption isotherm at the gas/ionomer interface. Considering a Langmuir-type isotherm,
where
The local oxygen resistance per unit of active catalyst surface area,
where
Introducing the above relationship,
which is inversely proportional to the roughness factor, as observed in previous experimental studies (see Figure 1B) (Greszler et al., 2012; Weber and Kusoglu, 2014).
The effect of the main operating conditions, relative humidity, temperature and pressure, on the local oxygen transport resistance reported by various authors is shown in Figure 3 (Kudo et al., 2016; Shen et al., 2017; Garsany et al., 2018; Conde et al., 2019; Cetinbas et al., 2020; Poojary et al., 2020; Sun et al., 2020; Yakovlev et al., 2021; Cheng et al., 2022a). The fitting curves are added to the collected datasets.
where
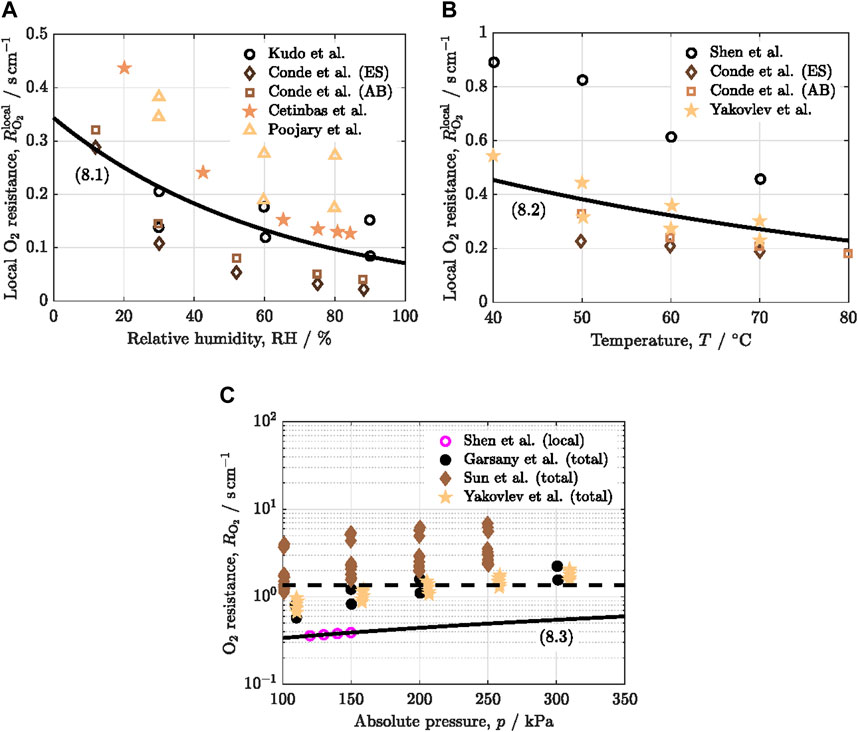
Figure 3. Variation of the local oxygen transport resistance,
The positive effect of relative humidity on reducing
The reduction of
The adverse effect of pressure on
2.2 Effect of ionomer content and morphology
The concentration and morphology of the ionomer play a key role on
where
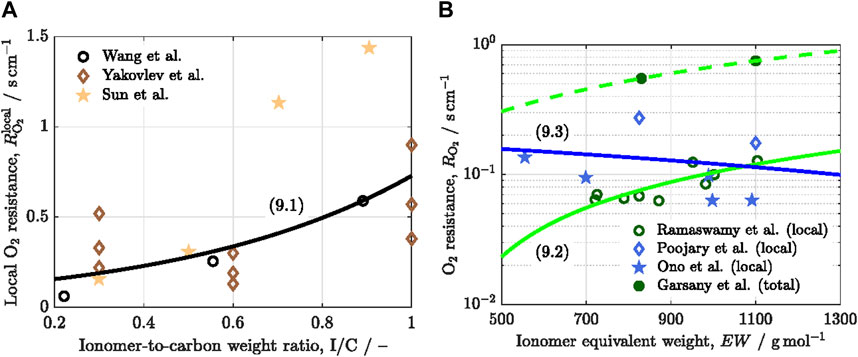
Figure 4. Variation of the local oxygen transport resistance,
The detrimental effect of
A decrease of
Increasing oxygen permeability by modification of ionomer chemical structure provides a straightforward approach to reduce
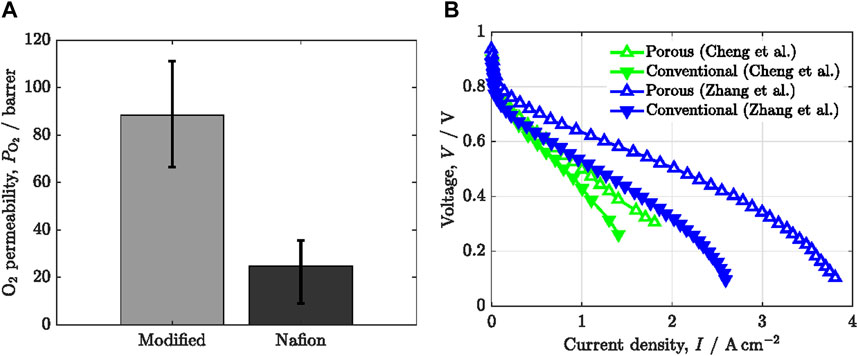
Figure 5. (A) Oxygen permeability,
The design of porous ionomers is also a powerful approach, as an alternative to the modification of ionomer chemical structure (Cheng et al., 2022b; Zhang et al., 2022). Recently, Cheng et al. (Cheng et al., 2022b) developed nanoporous ionomers by regulating the nanoscale distribution of Nafion using a sacrificial pore-forming agent. The introduction of nanoporosity on/in Nafion films significantly increased the number of triple-phase points for oxygen reduction reaction (ORR) and decreased
2.3 Effect of ionomer distribution on catalyst particles
Apart from ionomer thickness, the ionomer distribution on the carbon support plays an important effect on local oxygen transport. In the last years, several researchers have investigated the use of functionalized carbon supports with nitrogen-containing surface groups to tailor ionomer distribution (Orfanidi et al., 2017; Ott et al., 2020). Orfanidi et al. (Orfanidi et al., 2017) examined the performance of animated Vulcan compared to conventional non-functionalized carbon supports at low Pt loading (
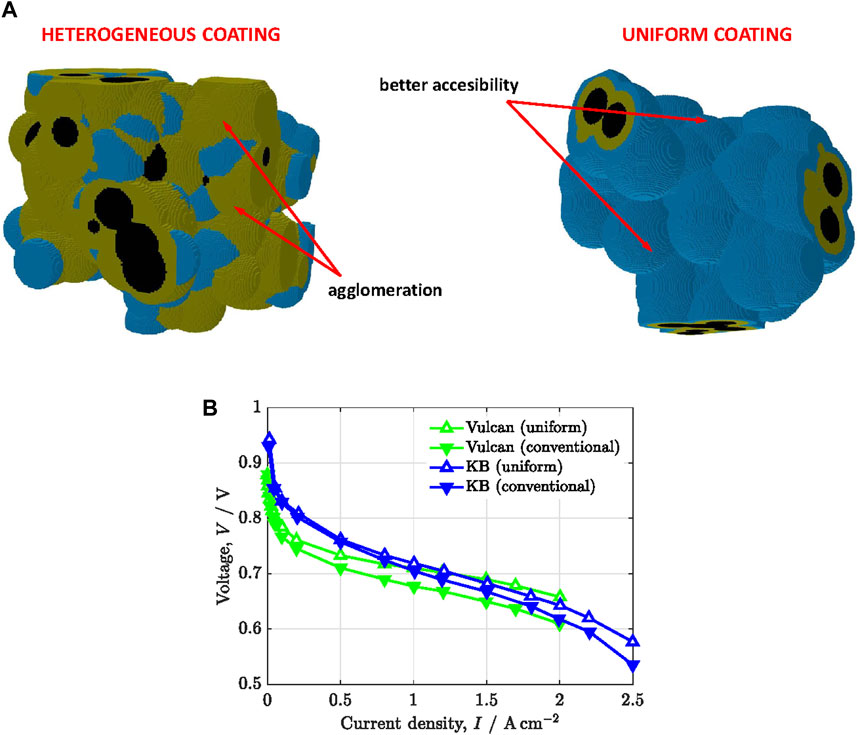
Figure 6. (A) Microstructure of catalyst layers with heterogeneous and uniform ionomer distributions. Blue: water, orange: ionomer, black: carbon. (B) Polarization curves,
2.4 Effect of carbon porosity
Two types of carbon supports are commonly used depending on their porosity: i) Vulcan or solid carbon with virtually no porosity, and ii) high surface area, micro/mesoporous carbon, such as ketjenblack. Previous work has shown that local oxygen transport is dependent on the location of catalyst nanoparticles in the carbon support. As shown in Figure 7A, the solid surface of Vulcan allows an external location of Pt nanoparticles, while ketjenblack shows catalyst nanoparticles both in the inner micro/mesopores and the external surface. Usually, most of the nanoparticles in porous carbon are located in the inner surface (>60%) (Padgett et al., 2018). Harzer et al. (Harzer et al., 2018) tuned the preferential location of Pt nanoparticles in ketjenblack by varying the synthesis method. They found that
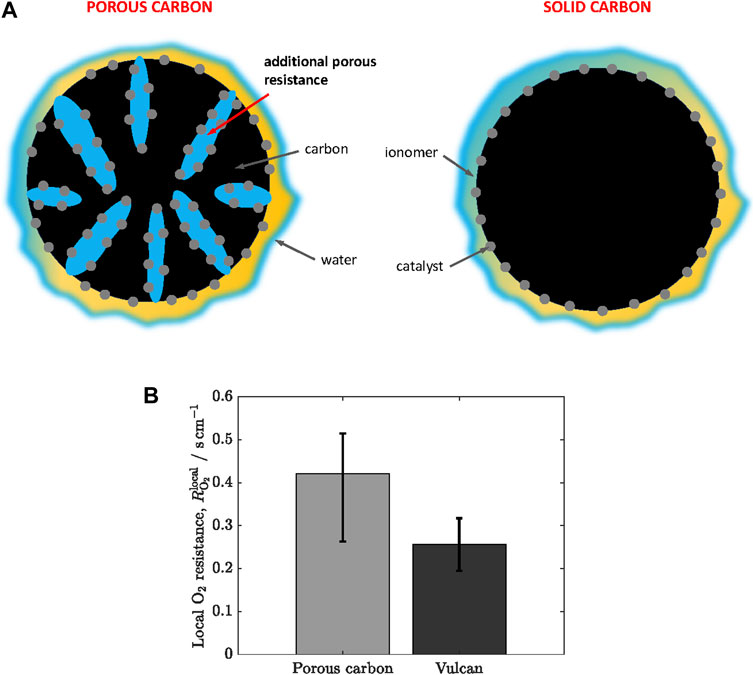
Figure 7. (A) Schematic of the microstructure of porous and solid (Vulcan) carbon supports. Blue: water, orange: ionomer, grey: catalyst, black: carbon. (B) Local oxygen transport resistance,
Despite the increase of
2.5 Additional factors
Other aspects that have shown a significant influence on
The effect of Pt dispersity was examined by Sun et al. (Sun et al., 2020) using catalyst layers with constant thickness and different Pt-to-carbon weight ratios,
3 MEA design and mitigation strategies
As discussed in previous sections, at intermediate and high current densities, mass transport resistances limit power production in a PEFC. Different transport processes are responsible for these resistances, and involving different species, as summarized in Table 3. This part of the revision will provide some experimental strategies proposed recently for the mitigation of transport resistances associated with some of the processes in Table 3, especially those involving local oxygen mass transport in the porous media of the electrodes which correspond to processes 3, 4 and 5 of Table 3. A conventional PEFC electrode structure will be assumed, having three serial porous layers, namely, the gas diffusion layer (GDL), microporous layer (MPL), and catalyst layer (CL).
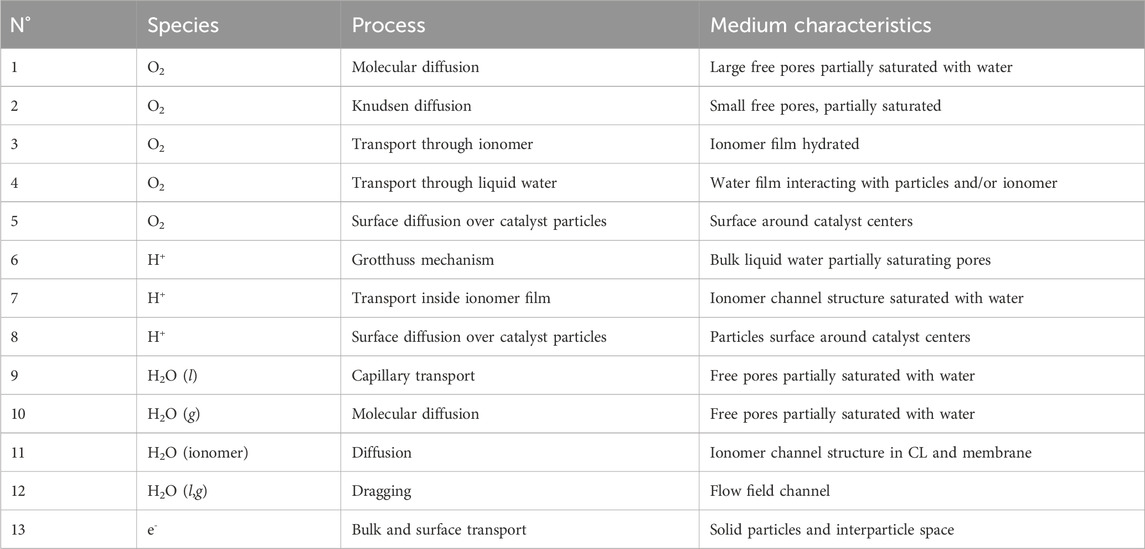
Table 3. Summary of transport processes in the electrode of a PEFC.
Among the different processes in Table 3, of special importance is the transport of liquid water inside the pore structure of the electrodes (processes 9 and 10) due to the large impact on other transport processes of O2, H+, e− and on the electrochemical kinetics (Li et al., 2008; Das et al., 2010; Iranzo et al., 2016; Lübben et al., 2023). The slowness of water transport, which is dominated by capillary forces in the porous layers of the MEA (Gostick, 2013; Mulone and Karan, 2013; Zapardiel and García-Salaberri, 2022), makes an important contribution to the transport resistances in a PEFC. Water is the product of the ORR in the cathode and provides the medium for the ionic transport in the CLs and the membrane; on the other hand, liquid water in flooded pores becomes a barrier for the access of gas molecules to the catalytic centers obliging the dissolution and diffusion of gas molecules into the liquid, which is four orders of magnitude slower than their diffusion in the free pore space.
Another important source of mass transport resistance in a PEFC is the local access of gas molecules to the reaction sites, principally oxygen in the cathodic CL, understanding for ‘local’ the nanometric scale comprising the ionomer thickness and the catalyst particle, corresponding to processes 3, 4 and 5 in Table 3 (see Figures 2, 8). Since the Pt surface must be closely interacting with the proton conductor, i.e., the ionomer phase, this same phase may cause partial blockage of the reaction sites that is revealed as a mass transport resistance. The problem is especially severe at low Pt loadings in the CL since such ‘local transport resistance’ depends on the inverse of the CL thickness (Pt loading) (Schuler et al., 2019).
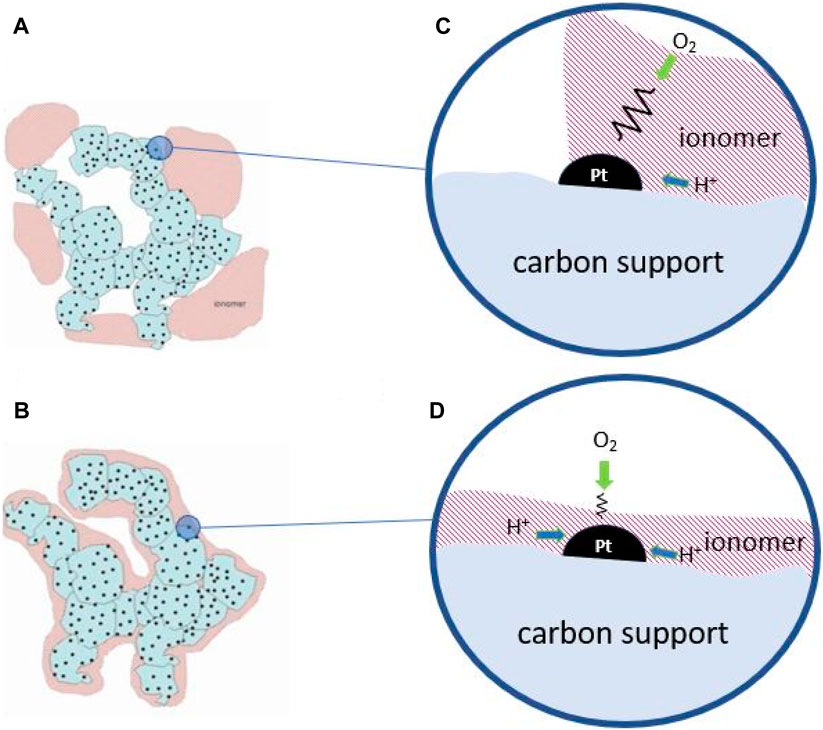
Figure 8. Drawings of Pt/C catalyst aggregates with (A) inhomogeneous, and (B) homogeneous ionomer distributions. (C) and (D) are local reaction environment for each case showing local mass transport resistance.
Therefore, the reduction of mass transport resistance in a PEFC concerns actuations at different scales in the MEA. On the one hand, the management of liquid water in porous layer requires its removal at the highest rate but leaving steady partially saturated pores to preserve ionic conduction. Most strategies to achieve this ideal situation rely on tuning the hydrophilic-hydrophobic properties of the pore walls and appropriate ionomer distribution (Figure 8B) able to keep partially saturated pores in the CL and to favor capillary transport and water diffusion. New electrode structures have also been envisaged to favor transport processes (Schuler et al., 2019). At the same time, mass transport at the local, nanoscale level, very close to the reaction sites, must be accelerated which should address the local reaction environment and the ionomer distribution to allow fast simultaneous accessibility of protons and gas molecules (cf. Figures 8C,D).
Some recent strategies to improve mass transport properties are described below.
3.1 Mass transport resistance mitigation
The strategies for mass transport improvement in a PEFC can be classified into three types regarding different scales in an MEA:
a) Materials of porous layers (GDL, CL, MPL).
b) Structure of the porous layer and fabrication process.
c) Membrane-electrodes assembly configuration.
Actuations at one level may have an impact on transport at the other levels, as well as on materials costs, performance, and cell durability. Their implementation should be preceded, therefore, by a comprehensive analysis including the different aspects.
3.1.1 Materials of the porous layers
Carbon materials. Microporous carbon particles make up the larger proportion of the electrode mass, so it should not be surprising that their properties have a large impact on transport processes. Its surface chemistry governs the interaction of water in the porous layers through polar substituents that provide variable hydrophilicity (Shen et al., 2008; Khodabakhshi et al., 2020), whereas porosity and pore size distribution have strong effects on proton conduction, ORR kinetics, and electrode durability (Uchida et al., 1995a; Liu et al., 2011a). The surface composition of carbon can be modified before the electrode preparation to tailor water interaction properties.
Enhancing the hydrophobic character of carbon surface, i.e., decreasing wettability, has been shown to improve, in general, liquid water transport (McNeary et al., 2020). Among different treatments, thermal and chemical treatments are preferred for surface modification (Shen et al., 2008). Thermal treatments in inert atmospheres or H2, decrease the number of polar surface groups and increase hydrophobicity, which is beneficial for water transport in the CL, MPL and GDL. Another means to provide hydrophobic character to the porous carbon structure is by adding hydrophobic agents. The most used is PTFE (Teflon), which is normally applied to the MPL and GDL. It has also been used inside the CL, however, here it has negative impacts on other properties, like electrical conductivity, porosity, and ECSA (Avcioglu et al., 2015). As a consequence, PTFE has been applied to the CL together with other treatments. Hydrophobic and porosity of the CL and MPL were tested by Mohseninia et al. (Mohseninia et al., 2020) using PTFE and pore formers, respectively, and water accumulation followed in situ with the neutron tomography technique. The results showed that a high hydrophobicity of the cathodic MPL increases water flooding and decreases performance, whereas more porous layers provide superior performance at high current density with oxygen transport occurring through small pores and water through larger pores. A new method for hydrophobization of a porous layer, without adding new chemicals to the preparation process, is by using the electrospray deposition technique that will be described in the next section (Conde et al., 2021).
Certain strategies to improve water transport in the electrode are based on a combination of hydrophilic and hydrophobic treatments to induce different water interactivity in different parts of the electrode, which could accelerate water drainage (Roh et al., 2018). With this aim, hydrophilicity is enhanced with acidic treatments, like using nitric or sulfuric acid, which results in partial surface oxidation due to an increase in the amount of oxygen polar groups (Shen et al., 2008). A similar effect can be obtained from a thermal treatment in an oxidative atmosphere. Mild hydrophilicity can be attained by catalyst treatments with soft chemicals, which improves ionomer dispersibility and is beneficial for PEFC performance (Nagamori et al., 2023). However, the hydrophilic character of the carbon surface is normally a result of PEFC operation under stressing conditions (like start-up and shut-down), which favors flooding and lower interparticle electric contact leading to a decrease in performance, so it becomes one principal cause for PEFC aging (Borup et al., 2020).
Together with surface chemistry, the structure and morphology of the carbon material have an influence on transport properties in the CL. The size of grain aggregates, the microporosity, or the total area may change water interaction and, with it, transport properties in the porous layers (Uchida et al., 1995a; Uchida et al., 1996). These parameters are also related to other important aspects, like chemical stability, catalyst particle interaction, and electrical conductivity, so their selection must be carried out on a general optimization plan. Hence, the synthesis method of the Pt/C catalyst may determine the transport resistance, since Pt particles may be distributed in different locations over the carbon surface, with different accessibility. Pt particles inside nanopores are prone to have better catalytic activity but poorer oxygen mass transport (Harzer et al., 2018) (see Figure 7).
Primary pores and surface chemistry of the carbon phase govern Pt growth during Pt/C synthesis, and properties, like particle size, dispersion, and location. Growth inside carbon micropores may lead to poorly accessible Pt and important losses due to mass transport and electrochemical surface area availability (Iden et al., 2013b). Such effect has been recently studied on high performance electrodes, like those used for the Toyota Mirai fuel cell, showing that primary pores with limited accessibility determine local oxygen transport resistance, as well as the ionomer phase characteristics (Cetinbas et al., 2020). The latter is a result of the interaction of the ink with the carbon surface (Liu et al., 2011b; Uchida, 2020; Woo et al., 2020; Cheng et al., 2021) and the deposition process as will be discussed below.
Certain nanostructured carbon materials may favor the transport properties of electrodes and catalysis when they have a stable and uniform decoration with Pt nanoparticles (Sharma and Pollet, 2012; Zhu et al., 2013). Nanofibers and nanotubes (single and multi-walled) have been extensively studied in this sense, and have accomplished important technical targets for the PEFC technology (Jha et al., 2013). Such carbon morphologies favor a decrease in the tortuosity and in the interparticle connection resistances, leading to improved mass transport (molecular and Knudssen diffusion), as well as better ionic and electronic conductivities of the CL (Kannan et al., 2007; Vairavapandian et al., 2008). To our knowledge, the effect on the local oxygen transport resistance is less studied. Graphene and graphene oxides as Pt support provide large electrochemical surface area and stability, but mild improvements in PEFC performance have been obtained so far compared with carbon blacks (Daş et al., 2017; Işıkel Şanlı et al., 2017; Grigoriev et al., 2018; Kim et al., 2019).
Ionomer phase. The ionomer is the component of the CL that, upon absorption of liquid water in its polymeric structure, generates an aqueous path for proton conductivity within the CL. It has other roles, like surfactant in the catalytic ink, and particle binder in the CL (Kusoglu and Weber, 2017). Most ionomer chemistries contain a backbone perfluorinated chain with acidic groups in side-chains, normally sulfonic (-SO3H), that are responsible for water interaction and ionic conductivity. Of special impact on transport properties is the ionomer distribution and configuration within the CL, and the interaction of sulfonic groups with Pt surface. An additional oxygen transport resistance arises because of the ionomer phase close to Pt sites, called ‘local mass transport resistance’, which has an important impact on performance especially when trying to decrease the catalyst loading in the CL (Sun et al., 2023) (see Figure 8).
Different strategies have been proposed to mitigate such ionomer-induced mass transport resistance. The use of hydrophobic agents, C16HS, during CL deposition was attempted by Sun et al. (Sun et al., 2023) to reduce the sulfonic group interaction with Pt, leading to an important increase in performance in rotating disk electrode (RDE) and single-cell studies. Orfanidi et al. (Orfanidi et al., 2017) changed the distribution of the ionomer in the CL by introducing nitrogen-containing surface groups on the carbon support surface. The procedure led to a decrease in the pressure-independent oxygen transport resistance of the layer, which is the resistance due to transport within the ionomer film and related to the local transport resistance. Changing the ionomer chemistry is another way to mitigate the interaction of sulfonic groups with Pt. Rolfi et al. (Rolfi et al., 2018) attained a 20% increase in oxygen permeability that gave rise to lower mass transport resistance, by using a modification of Aquivion with a steric hindered monomer. Garsany et al. (Garsany et al., 2018) observed a decrease in the resistances of proton transport, oxygen transport, and charge transfer when changing from an ionomer with a long side chain, like Nafion, to a shorter side chain like Aquivion.
3.1.2 Structure of the porous layer and fabrication process
The morphology of the porous layers, especially the CL, has a major impact on water management in the cell (Litster and McLean, 2004; Conde et al., 2019; Chen et al., 2020; Liu S. et al., 2023; Tempelaere et al., 2023). Morphology is characterized by several parameters, including agglomerate size, secondary pore size and density, thickness, and tortuosity. The first principle numerical simulation shows that better transport properties and high performance in the CL require high porosity and low tortuosity in the CL (García-Salaberri, 2023b).
Strategies to improve the morphology address principally the procedure used for the porous layer deposition. Most used preparation methods, and closer to large-scale electrode manufacture, are those based on the deposition of a suspension (‘ink’) of the catalyst and the ionomer in a solvent, to produce a thin, porous film (Litster and McLean, 2004). By these means, different film properties can be obtained depending on the suspension chemistry, deposition parameters, and substrate.
The ink properties have an impact on the resulting morphology of the porous layer. Suspension chemistry mostly concerns the solvent and concentrations of particles and ionomer, which determine the stability of the suspension, their mutual interactions, and the state of the ionomer in the ink (Uchida et al., 1995b; Berlinger et al., 2021; Guo et al., 2021). The latter governs distribution and morphology within the deposited catalyst layer, and, ultimately, secondary pores (meso and microporosity) and transport properties. A solvent with a high dielectric constant favors the dissolved ionomer state, i.e., isolated chains fully interacting with the solvent, whereas decreasing values will favor their aggregation towards colloidal and solid particle states. However, the effect of the dielectric constant on catalyst layer morphology is unclear (Berlinger et al., 2021). The interaction of the ionomer with the particles in the ink is a matter of numerous studies since it will determine CL morphology and component distribution in ink deposition by spray coating (Berlinger et al., 2021).
The substrate used for CL deposition has also an influence on porous layer morphology and transport properties. For CL deposition, the MPL or the membrane can be used, or an external substrate to transfer the CL to the MEA (decal method) (Cho et al., 2009). Easier experimental handling results from using the MPL, where deposition can be carried out at different scales and using fast techniques, like spray coater in automatic roll-to-roll configurations, so it is probably preferred in commercial products (‘catalyst covered GDLs’). The deposition on the membrane is experimentally more difficult due to the management of the hydrophilic polymer membrane when receiving the sprayed ink, which may crease easily and become damaged by solvent absorption and reactivity. On the other hand, it is demonstrated that on-membrane deposition provides better ionic contact between the membrane and the CL, which results in an important reduction of the cell’s internal resistance (Chaparro et al., 2011). To proceed with this strategy, decal methods have the advantage of using a sacrificial substrate where the solvent can be eliminated before transferring the CL to the membrane. A different option for on-membrane deposition is using a ‘dry ink deposition method’, like electrospray (Chaparro et al., 2011). In addition, electrospray results in new CL transport properties that mitigate transport resistances as described below.
The ink deposition method is very determining for the CL morphology and transport properties. Ink deposition methods have been used in different types, from pure impregnation (Benítez et al., 2005), to airbrushing or ultrasonic spray (Jao et al., 2013; Turtayeva et al., 2022), ink-jet (Shukla et al., 2014), roll-to-roll (Liu P. et al., 2023), electrospinning (Brodt et al., 2015), and electrospray deposition (Martin et al., 2010; Takahashi et al., 2016; Folgado et al., 2018; Cho et al., 2020; Yoshino et al., 2020; Conde et al., 2021). Impregnation and spray coating techniques are widely used due to their fast deposition rate, easier experimentation and availability of commercial equipment that can be used for laboratory work and large-scale electrode production. Their main drawbacks are poor film morphology control and reproducibility, which depends on careful ink preparation and coating equipment, notwithstanding personnel experience and skills. It may have low catalyst yield deposition, especially in small areas, leading to the waste of expensive material (platinum and ionomer) and an increase in costs. Ink-jet technology like used in commercial printers has been applied to improve process reproducibility and yield, but with a minor impact on film transport properties (Shukla et al., 2014).
Different CL morphology and transport properties are obtained by using electrospinning and electrospraying deposition techniques. Both are based on spraying the catalytic ink under the influence of a strong electric field, which is an additional parameter for the control of the deposition process. Under the electric field, droplet ejection may result in the growth of a thin filament or the generation of a progeny of droplets, due to the opposing effects of Coulomb repulsion and surface tension. In the first case, electrospinning deposition occurs with the formation of microwires of the catalyst and the ionomer that improve connectivity among particles, oxygen accessibility and water transport properties of the films (Brodt et al., 2015) (see Figure 9).
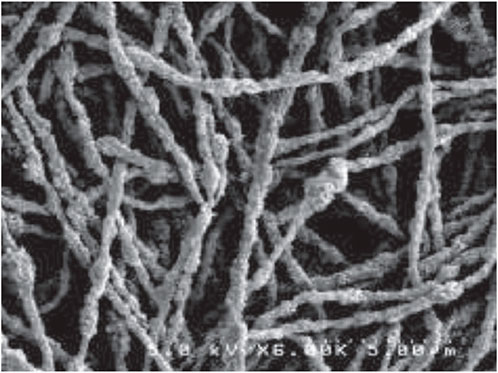
Figure 9. SEM image of an electrospun nanofiber mat. From Ref. (Brodt et al., 2015).
The electrospray deposition occurs when Coulombic and surface tension opposing forces favor the fission of the ejected droplets (Figure 10), which gives rise to completely different CL morphology and transport properties (Folgado et al., 2018; Conde et al., 2019; Conde et al., 2021). During electrospray, the fission of ink droplets in-flight, after ejected, accelerates solvent evaporation, favoring catalyst and ionomer particles arrival at the substrate free of solvent (‘dry deposition’) (see Figure 10A). This makes a substantial difference compared with other ink deposition techniques. Dry catalyst particles and ionomer are deposited under the influence of electrostatic and image forces instead of ink interactions governing spray deposition, which results in a particular porous morphology (Higuera, 2018). The accommodation of particles and the ionomer gives rise to a macroporous and dendritic structure that renders superhydrophobic pores walls (Cassie–Baxter type) (see Figure 10B). Electrospray is very appropriate for deposition on membrane substrate due to the arrival of particles without solvent, yielding lower CL-membrane contact resistivity (Chaparro et al., 2011). Transport is enhanced in electrosprayed layers due to their more homogeneous ionomer distribution (Figures 8B,D). Local oxygen transport is also favored by the probably different ionomer structure and local reaction environment around catalyst sites, as reflected by a significant reduction in the local transport resistance (Conde et al., 2019), and improvement in fuel cell response (see Figure 11) (Chaparro et al., 2016). The characteristics of the electrosprayed ionomer structure and local reaction environment are a matter of present research. Electrospray properties also concern electrode’s durability and material costs (Conde et al., 2021), which increase the interest for the industrial manufacture of PEFC electrodes.
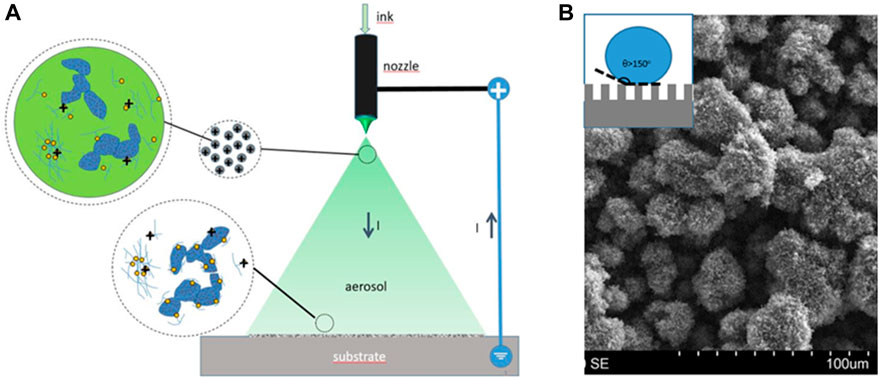
Figure 10. (A) Scheme of electrospray deposition, showing droplet details close to the ejector and the substrate. (B) SEM image of the deposited film with superhydrophobic character according to Cassie–Baxter model (inset).
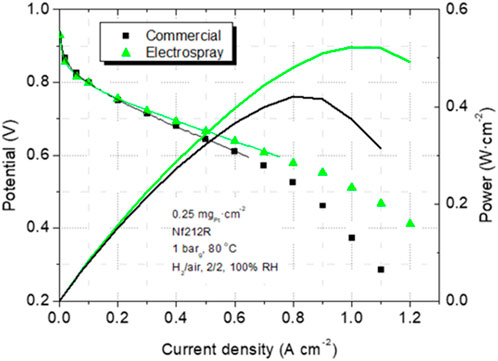
Figure 11. Polarization and power density curves of two MEAs, one with commercial and the other with electrosprayed cathode catalyst layer (from Ref (Chaparro et al., 2016).).
Appart from using different ink deposition methods, different CL structures may be obtained with improved transport properties by other means. Including ordering and 3D structuring in the CL has shown a positive impact on mass transport properties and catalyst utilization, as highlighted in a recent review (Tempelaere et al., 2023), due to a decrease in tortuosity and enhanced Pt accessibility in ordered structures. Ordering in CL relies on more involved synthesis and deposition processes, compared with ink deposition, which must be comprehensively analyzed if attempting the transfer from laboratory to industrial fabrication. Carbon nanotubes have been vertically aligned over the membrane surface, and MEAs of up to 236 cm2 have been tested with showing exceeding performance beyond US-DOE targets for Pt mass activity (Yarlagadda et al., 2018). The alignment is a result of a carbon deposition on a sacrificial substrate (stainless steel), followed by Pt and Nafion depositions, and a decal transfer to the membrane. Ordered CLs of microscale arrays of Pt/C disks, and arrays of holes on Pt/C films, have been prepared by lithographic technique, leading to improvements in water transport and mass activity in single PEFC, but having crossover and short-circuiting issues caused by the inherent compression inhomogeneities (Paul et al., 2020). Introducing profiles in parameters of the CL, like ionomer and catalyst concentration, normally in the through plane direction, has also been demonstrated to improve transport properties. In this case, the effect favors gradient forces for water transport, like capillary-driven flow and phase-change induced transport, leading to a reduction of mass transport losses (Cetinbas et al., 2014; Chen et al., 2017; Nguyen et al., 2022).
3.1.3 Membrane-electrodes assembly configuration
At the MEA level, an appropriate combination of anode and cathode properties may maximize water gradients and accelerate water transport and removal. With this aim, different combinations of CLs have been tested in single PEFCs, and their water management studied (Folgado et al., 2018). The use of superhydrophobic CLs in the cathode in front of hydrophilic CLs in the anode has shown enhancement of water transport from the cathode to the anode (see Figure 12). This configuration favors high anode humidification and avoids cathode flooding at high current densities, which gives rise to a notable increase in peak power density, above 20% compared with standard, symmetrical, configurations where cathode and anode have similar hydrophilicity (Figure 11). On the other hand, the reverse case, i.e., a superhydrophobic anode in front of a hydrophilic cathode, increases the possibility of severe membrane drying close to the anode and its damaging. These results are valid for self-humidified cell operation under rather common excess flow rate stoichiometry H2/O2 of 1.5/3.0 in anode and cathode.
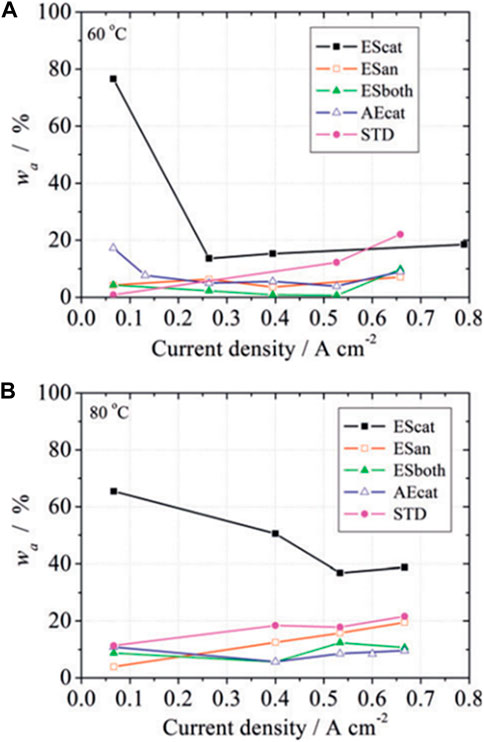
Figure 12. Water recovered fraction from the anode exit of a PEFC (wa) having variable catalyst layers configuration in the MEA: electrosprayed cathode (EScat), electrosprayed anode (Esan), electrosprayed anode and cathode (ESboth), airbrushed cathode (AEcat), and a commercial cathode (STD). Measurements at two cell temperatures: (A) 60°C and (B) 80°C (from Ref (Folgado et al., 2018).
The optimal MEA configuration must take into account the operating conditions in a PEFC. For example, two radically different operating conditions are the convective and the passive feeding in a PEFC. The first is the conventional operation mode where reactant gases are kept flowing parallel to the electrode plane to accelerate the transport of water and removal from the cell. This mode requires additional system components to keep the flow regimes and allows for high power production. On the other hand, the passive feeding mode does not require forced convection of gases but relies on passive forces for transport processes: capillarity, diffusion, evaporation, gravity, and natural convection. A passive PEFC has an air-breathing cathode in contact with ambient air, and a dead-end anode, where water transport rates are typically lower than in a convective cell, as well as the power attained, but the system is simpler and can avoid auxiliary consumptions. The MEA design also differs in both, convective and passive cells, to take into account the different transport regimes. Whereas a more hydrophobic cathode will be preferred for the convective operation for the reasons explained in the previous section (Figures 11, 12), the passive operation benefits from having larger hydrophobicity in the anode to avoid excess humidification and passing of liquid water to the anodic chamber coming from the air-breathing cathode. Passive cell operation is of higher technological interest in small and portable applications (Neaţu et al., 2021).
4 Summary and outlook
Lowering Pt loading in next-generation polymer electrolyte fuel cells (PEFCs) is a priority to reduce their cost and make them more competitive. However, achieving high performance and durability at low Pt loading is hindered by significant local oxygen transport resistance around catalyst sites. The major contributors to local oxygen blockage are: i) oxygen adsorption at ionomer and Pt interfaces, and ii) oxygen diffusion across ionomer and water films, especially the former. The local oxygen transport resistance largely depends on operating conditions (relative humidity and temperature), ionomer content, morphology and uniformity, porosity of carbon support, and catalyst dispersity. Improving oxygen transport at low Pt loading demands an optimized design of the multiscale pore structure of the membrane electrode assembly (MEA), with a focus on the catalyst layer (CL). Operating conditions, materials cost, and components manufacture must be considered simultaneously.
At the smallest, nanometric scale, optimal accessibility of reaction sites to gas molecules and protons is the main objective. With this aim, appropriate starting materials (carbon support, ionomer), catalyst (Pt/C) synthesis method, and CL deposition methods may lead to the desired reduction in mass transport resistances. Appropriate disposition of the ionomer phase around the catalyst particles should be achieved to minimize transport resistances around the local reaction environment, especially at low catalyst loadings. Liquid water management must be adequate to provide protonic conductivity in the CL through a liquid path but avoiding pore flooding. With this aim, the use of deposition techniques for CL preparation, such as electrospraying, gives rise to a very convenient porous morphology with lower mass transport resistance.
Author contributions
PG-S: Conceptualization, Data curation, Formal Analysis, Funding acquisition, Investigation, Methodology, Project administration, Resources, Software, Supervision, Validation, Visualization, Writing–original draft, Writing–review and editing. PD: Conceptualization, Data curation, Formal Analysis, Investigation, Methodology, Resources, Validation, Visualization, Writing–original draft, Writing–review and editing. AC: Conceptualization, Data curation, Formal Analysis, Funding acquisition, Investigation, Methodology, Resources, Validation, Visualization, Writing–original draft, Writing–review and editing.
Funding
The author(s) declare that financial support was received for the research, authorship, and/or publication of this article. This work was supported by projects PID2019-106740RBI00 and PORHYDRO1 TED2021-131620B-C21 of the Spanish Research Council, and by project PORHYDRO2 TED2021-131620B-C22/AEI European Union NextGenerationEU/PRTR, of the Ministry of Science and Innovation of Spain, Spanish Research Council.
Conflict of interest
The authors declare that the research was conducted in the absence of any commercial or financial relationships that could be construed as a potential conflict of interest.
The author(s) declared that they were an editorial board member of Frontiers, at the time of submission. This had no impact on the peer review process and the final decision.
Publisher’s note
All claims expressed in this article are solely those of the authors and do not necessarily represent those of their affiliated organizations, or those of the publisher, the editors and the reviewers. Any product that may be evaluated in this article, or claim that may be made by its manufacturer, is not guaranteed or endorsed by the publisher.
References
Avcioglu, G. S., Ficicilar, B., Bayrakceken, A., and Eroglu, I. (2015). High performance PEM fuel cell catalyst layers with hydrophobic channels. Int. J. Hydrogen Energy 40, 7720–7731. doi:10.1016/j.ijhydene.2015.02.004
Baker, D. R., Caulk, D., Neyerlin, K. C., and Murphy, M. W. (2009). Measurement of oxygen transport resistance in PEM fuel cells by limiting current methods. J. Electrochem. Soc. 156, B991. doi:10.1149/1.3152226
Benítez, R., Chaparro, A. M., and Daza, L. (2005). Electrochemical characterisation of Pt/C suspensions for the reduction of oxygen. J. Power Sources 151, 2–10. doi:10.1016/j.jpowsour.2005.02.077
Berlinger, S. A., Garg, S., and Weber, A. Z. (2021). Multicomponent, multiphase interactions in fuel-cell inks. Curr. Opin. Electrochem. 29, 100744. doi:10.1016/j.coelec.2021.100744
Borup, R. L., Kusoglu, A., Neyerlin, K. C., Mukundan, R., Ahluwalia, R. K., Cullen, D. A., et al. (2020). Recent developments in catalyst-related PEM fuel cell durability. Curr. Opin. Electrochem. 21, 192–200. doi:10.1016/j.coelec.2020.02.007
Brodt, M., Han, T., Dale, N., Niangar, E., Wycisk, R., and Pintauro, P. (2015). Fabrication, in-situ performance, and durability of nanofiber fuel cell electrodes. J. Electrochem. Soc. 162, F84–F91. doi:10.1149/2.0651501jes
Cetinbas, F. C., Advani, S. G., and Prasad, A. K. (2014). Investigation of a polymer electrolyte membrane fuel cell catalyst layer with bidirectionally-graded composition. J. Power Sources 270, 594–602. doi:10.1016/j.jpowsour.2014.07.148
Cetinbas, F. C., Ahluwalia, R. K., Kariuki, N. N., De Andrade, V., and Myers, D. J. (2020). Effects of porous carbon morphology, agglomerate structure and relative humidity on local oxygen transport resistance. J. Electrochem. Soc. 167, 013508. doi:10.1149/2.0082001jes
Chaparro, A. M., Ferreira-Aparicio, P., Folgado, M. A., Brightman, E., and Hinds, G. (2016). Study of superhydrophobic electrosprayed catalyst layers using a localized reference electrode technique. J. Power Sources 325, 609–619. doi:10.1016/j.jpowsour.2016.06.077
Chaparro, A. M., Ferreira-Aparicio, P., Folgado, M. A., Martín, A. J., and Daza, L. (2011). Catalyst layers for proton exchange membrane fuel cells prepared by electrospray deposition on Nafion membrane. J. Power Sources 196, 4200–4208. doi:10.1016/j.jpowsour.2010.09.096
Chen, G. Y., Wang, C., Lei, Y. J., Zhang, J., Mao, Z., Mao, Z. Q., et al. (2017). Gradient design of Pt/C ratio and Nafion content in cathode catalyst layer of PEMFCs. Int. J. Hydrog. Energy 42, 29960–29965. doi:10.1016/j.ijhydene.2017.06.229
Chen, M., Zhao, C., Sun, F., Fan, J., Li, H., and Wang, H. (2020). Research progress of catalyst layer and interlayer interface structures in membrane electrode assembly (MEA) for proton exchange membrane fuel cell (PEMFC) system. eTransportation 5, 100075. doi:10.1016/j.etran.2020.100075
Cheng, X., Shen, S., Wei, G., Wang, C., Luo, L., and Zhang, J. (2022a). Perspectives on challenges and achievements in local oxygen transport of low Pt proton exchange membrane fuel cells. Adv. Mat. Technol. 7, 2200228. doi:10.1002/admt.202200228
Cheng, X., Wei, G., Wang, C., Shen, S., and Zhang, J. (2021). Experimental probing of effects of carbon support on bulk and local oxygen transport resistance in ultra-low Pt PEMFCs. Int. J. Heat. Mass Transf. 164, 120549. doi:10.1016/j.ijheatmasstransfer.2020.120549
Cheng, X., You, J., Shen, S., Wei, G., Yan, X., Wang, C., et al. (2022b). An ingenious design of nanoporous nafion film for enhancing the local oxygen transport in cathode catalyst layers of PEMFCs. Chem. Eng. J. 439, 135387. doi:10.1016/j.cej.2022.135387
Cho, J. H., Kim, J. M., Prabhuram, J., Hwang, S. Y., Ahn, D. J., Ha, H. Y., et al. (2009). Fabrication and evaluation of membrane electrode assemblies by low-temperature decal methods for direct methanol fuel cells. J. Power Sources 187, 378–386. doi:10.1016/j.jpowsour.2008.10.111
Cho, S., Tamoto, K., and Uchida, M. (2020). Effect of an electrospray-generated ionomer morphology on polymer electrolyte fuel cell performance. Energy Fuels 34, 14853–14863. doi:10.1021/acs.energyfuels.0c02337
Choo, M. J., Oh, K. H., Park, J. K., and Kim, H. T. (2015). Analysis of oxygen transport in cathode catalyst layer of low-Pt-loaded fuel cells. ChemElectroChem 2, 382–388. doi:10.1002/celc.201402354
Conde, J., Ferreira-Aparicio, P., and Chaparro, A. (2021). Electrospray deposition: a breakthrough technique for proton exchange membrane fuel cell catalyst layer fabrication. ACS Appl. Energy Mat. 4, 7394–7404. doi:10.1021/acsaem.1c01445
Conde, J. J., Folgado, M. A., Ferreira-Aparicio, P., Chaparro, A. M., Chowdhury, A., Kusoglu, A., et al. (2019). Mass-transport properties of electrosprayed Pt/C catalyst layers for polymer-electrolyte fuel cells. J. Power Sources 427, 250–259. doi:10.1016/j.jpowsour.2019.04.079
Cullen, D. A., Neyerlin, K. C., Ahluwalia, R. K., Mukundan, R., More, K. L., Borup, R. L., et al. (2021). New roads and challenges for fuel cells in heavy-duty transportation. Nat. Energy 6, 462–474. doi:10.1038/s41560-021-00775-z
Darling, R. M., and Burlatsky, S. F. (2020). Modeling oxygen transport in high surface area carbon supports for polymer-electrolyte fuel cells. J. Electrochem. Soc. 167, 104506. doi:10.1149/1945-7111/ab9722
Daş, E., Alkan Gürsel, S., Işıkel Şanlı, L., and Bayrakçeken Yurtcan, A. (2017). Thermodynamically controlled Pt deposition over graphene nanoplatelets: effect of Pt loading on PEM fuel cell performance. Int. J. Hydrogen Energy 42, 19246–19256. doi:10.1016/j.ijhydene.2017.06.108
Das, P. K., Barbir, F., Jiao, K., Wang, Y., and Li, X. (2023). “Chapter 1 - fuel cells for transportation—an overview,” in Fuel cells for transportation. Editors P. K. Das, K. Jiao, Y. Wang, B. Frano, and X. Li (Sawston, UK: Woodhead Publishing), 1–28.
Das, P. K., Li, X., and Liu, Z. S. (2010). Analysis of liquid water transport in cathode catalyst layer of PEM fuel cells. Int. J. Hydrogen Energy 35, 2403–2416. doi:10.1016/j.ijhydene.2009.12.160
Fan, L., Tu, Z., and Chan, S. H. (2021). Recent development of hydrogen and fuel cell technologies: a review. Energy Rep. 7, 8421–8446. doi:10.1016/j.egyr.2021.08.003
Folgado, M. A., Conde, J. J., Ferreira-Aparicio, P., and Chaparro, A. M. (2018). Single cell study of water transport in PEMFCs with electrosprayed catalyst layers. Fuel Cells 18, 602–612. doi:10.1002/fuce.201700217
Ganesan, A., and Narayanasamy, M. (2019). Ultra-low loading of platinum in proton exchange membrane-based fuel cells: a brief review. Renew. Sustain. Energy 8, 18. doi:10.1007/s40243-019-0156-x
García-Salaberri, P. A. (2023a). Proton exchange membranes for polymer electrolyte fuel cells: an analysis of perfluorosulfonic acid and aromatic hydrocarbon ionomers. Sustain. Mat. Technol. 38, e00727. doi:10.1016/j.susmat.2023.e00727
García-Salaberri, P. A. (2023b). A numerical assessment of mitigation strategies to reduce local oxygen and proton transport resistances in polymer electrolyte fuel cells. Materials 16, 6935. doi:10.3390/ma16216935
Garsany, Y., Atkinson, R. W., Sassin, M. B., Hjelm, R. M. E., Gould, B. D., and Swider-Lyons, K. E. (2018). Improving PEMFC performance using short-side-chain low-equivalent-weight PFSA ionomer in the cathode catalyst layer. J. Electrochem. Soc. 165, F381–F391. doi:10.1149/2.1361805jes
Gostick, J. T. (2013). Random pore network modeling of fibrous PEMFC gas diffusion media using voronoi and delaunay tessellations. J. Electrochem. Soc. 160, F731–F743. doi:10.1149/2.009308jes
Greszler, T. A., Caulk, D., and Sinha, P. (2012). The impact of platinum loading on oxygen transport resistance. J. Electrochem. Soc. 159, F831–F840. doi:10.1149/2.061212jes
Grigoriev, S. A., Fateev, V. N., Pushkarev, A. S., Pushkareva, I. V., Ivanova, N. A., Kalinichenko, V. N., et al. (2018). Reduced graphene oxide and its modifications as catalyst supports and catalyst layer modifiers for PEMFC. Materials 11, 1405. doi:10.3390/ma11081405
Guo, Y., Pan, F., Chen, W., Ding, Z., Yang, D., Li, B., et al. (2021). The controllable design of catalyst inks to enhance pemfc performance: a review. Springer: Singapore.
Harzer, G. S., Orfanidi, A., El-Sayed, H., Madkikar, P., and Gasteiger, H. A. (2018). Tailoring catalyst morphology towards high performance for low Pt loaded PEMFC cathodes. J. Electrochem. Soc. 165, F770–F779. doi:10.1149/2.0311810jes
Higuera, F. J. (2018). Structure of deposits formed from electrosprayed aggregates of nanoparticles. J. Aerosol Sci. 118, 45–58. doi:10.1016/j.jaerosci.2018.01.007
Iden, H., Mashio, T., and Ohma, A. (2013b). Gas transport inside and outside carbon supports of catalyst layers for PEM fuel cells. J. Electroanal. Chem. 708, 87–94. doi:10.1016/j.jelechem.2013.09.011
Iden, H., Takaichi, S., Furuya, Y., Mashio, T., Ono, Y., and Ohma, A. (2013a). Relationship between gas transport resistance in the catalyst layer and effective surface area of the catalyst. J. Electroanal. Chem. 694, 37–44. doi:10.1016/j.jelechem.2013.02.008
Iranzo, A., Boillat, P., Salva, A., and Biesdorf, J. (2016). PEM fuel cell operation under air and O2 feed: analysis of cell performance and liquid water distributions. Fuel Cells 16, 463–468. doi:10.1002/fuce.201500145
Işıkel Şanlı, L., Bayram, V., Ghobadi, S., Düzen, N., and Alkan Gürsel, S. (2017). Engineered catalyst layer design with graphene-carbon black hybrid supports for enhanced platinum utilization in PEM fuel cell. Int. J. Hydrogen Energy 42, 1085–1092. doi:10.1016/j.ijhydene.2016.08.210
James, B. D., Huya-Kouadio, J. M., and Houchins, C. (2021). Final report: mass production cost estimation of direct H2 PEM fuel cell systems for transportation applications 2020. Arlington, VA, USA: Strategic Analysis Inc.
Jao, T. C., Jung, G. B., Shen, H. L., Yeh, C. C., and Su, Y. J. (2013). Ultrasonic spray coating for proton exchange membrane fuel cell. Open J. Acoust. 03, 33–37. doi:10.4236/oja.2013.33a006
Jha, N., Ramesh, P., Bekyarova, E., Tian, X., Wang, F., Itkis, M. E., et al. (2013). Functionalized single-walled carbon nanotube-based fuel cell benchmarked against US DOE 2017 technical targets. Sci. Rep. 3, 2257–7. doi:10.1038/srep02257
Jiao, K., Xuan, J., Du, Q., Bao, Z., Xie, B., Wang, B., et al. (2021). Designing the next generation of proton-exchange membrane fuel cells. Nature 595, 361–369. doi:10.1038/s41586-021-03482-7
Jinnouchi, R., Kudo, K., Kitano, N., and Morimoto, Y. (2016). Molecular dynamics simulations on O2 permeation through nafion ionomer on platinum surface. Electrochim. Acta 188, 767–776. doi:10.1016/j.electacta.2015.12.031
Kai, Y., Kitayama, Y., Omiya, M., Uchiyama, T., and Kumei, H. (2014). In situ observation of deformation behavior of membrane electrode assembly under humidity cycles. J. Fuel Cell Sci. Technol. 11, 051006. doi:10.1115/1.4028155
Kannan, A. M., Veedu, V. P., Munukutla, L., and Ghasemi-Nejhad, M. N. (2007). Nanostructured gas diffusion and catalyst layers for proton exchange membrane fuel cells. Electrochem. Solid-State Lett. 10, 47–50. doi:10.1149/1.2422751
Khodabakhshi, S., Fulvio, P. F., and Andreoli, E. (2020). Carbon black reborn: structure and chemistry for renewable energy harnessing. Carbon N. Y. 162, 604–649. doi:10.1016/j.carbon.2020.02.058
Kim, Y., Lee, D., Kwon, Y., Kim, T. W., Kim, K., and Kim, H. J. (2019). Enhanced electrochemical oxygen reduction reaction performance with Pt nanocluster catalysts supported on microporous graphene-like 3D carbon. J. Electroanal. Chem. 838, 89–93. doi:10.1016/j.jelechem.2019.02.035
Kongkanand, A., and Mathias, M. F. (2016). The priority and challenge of high-power performance of low-platinum proton-exchange membrane fuel cells. J. Phys. Chem. Lett. 7, 1127–1137. doi:10.1021/acs.jpclett.6b00216
Kudo, K., Jinnouchi, R., and Morimoto, Y. (2016). Humidity and temperature dependences of oxygen transport resistance of nafion thin film on platinum electrode. Electrochim. Acta 209, 682–690. doi:10.1016/j.electacta.2016.04.023
Kurihara, Y., Mabuchi, T., and Tokumasu, T. (2017). Molecular analysis of structural effect of ionomer on oxygen permeation properties in PEFC. J. Electrochem. Soc. 164, F628–F637. doi:10.1149/2.1301706jes
Kurihara, Y., Mabuchi, T., and Tokumasu, T. (2019). Molecular dynamics study of oxygen transport resistance through ionomer thin film on Pt surface. J. Power Sources 414, 263–271. doi:10.1016/j.jpowsour.2019.01.011
Kusoglu, A., and Weber, A. Z. (2017). New insights into perfluorinated sulfonic-acid ionomers. Chem. Rev. 117, 987–1104. doi:10.1021/acs.chemrev.6b00159
Li, H., Tang, Y., Wang, Z., Shi, Z., Wu, S., Song, D., et al. (2008). A review of water flooding issues in the proton exchange membrane fuel cell. J. Power Sources 178, 103–117. doi:10.1016/j.jpowsour.2007.12.068
Litster, S., and McLean, G. (2004). PEM fuel cell electrodes. J. Power Sources 130, 61–76. doi:10.1016/j.jpowsour.2003.12.055
Liu, H., Epting, W. K., and Litster, S. (2015). Gas transport resistance in polymer electrolyte thin films on oxygen reduction reaction catalysts. Langmuir 31, 9853–9858. doi:10.1021/acs.langmuir.5b02487
Liu, P., Yang, D., Li, B., Zhang, C., and Ming, P. (2023b). Recent progress of catalyst ink for roll-to-roll manufacturing paired with slot die coating for proton exchange membrane fuel cells. Int. J. Hydrogen Energy 48, 19666–19685. doi:10.1016/j.ijhydene.2023.02.022
Liu, S., Yuan, S., Liang, Y., Li, H., Xu, Z., Xu, Q., et al. (2023a). Engineering the catalyst layers towards enhanced local oxygen transport of Low-Pt proton exchange membrane fuel cells: materials, designs, and methods. Int. J. Hydrogen Energy 48, 4389–4417. doi:10.1016/j.ijhydene.2022.10.249
Liu, Y., Ji, C., Gu, W., Jorne, J., and Gasteiger, H. A. (2011a). Effects of catalyst carbon support on proton conduction and cathode performance in PEM fuel cells. J. Electrochem. Soc. 158, B614–B621. doi:10.1149/1.3562945
Liu, Y., Ji, C., Gu, W., Jorne, J., and Gasteiger, H. A. (2011b). Effects of catalyst carbon support on proton conduction and cathode performance in PEM fuel cells. J. Electrochem. Soc. 158, B614–B621. doi:10.1149/1.3562945
Lübben, L., Kirsch, S., Kadyk, T., and Eikerling, M. (2023). Test procedure for the prediction of water transport in polymer electrolyte fuel cells. J. Power Sources 556, 232504. doi:10.1016/j.jpowsour.2022.232504
Macauley, N., Lousenberg, R. D., Spinetta, M., Zhong, S., Yang, F., Judge, W., et al. (2022). Highly durable fluorinated high oxygen permeability ionomers for proton exchange membrane fuel cells. Adv. Energy Mat. 12, 2201063. doi:10.1002/aenm.202201063
Malekian, A., Salari, S., Stumper, J., Djilali, N., and Bahrami, M. (2019). Effect of compression on pore size distribution and porosity of PEM fuel cell catalyst layers. Int. J. Hydrog. Energy 44, 23396–23405. doi:10.1016/j.ijhydene.2019.07.036
Martin, S., Garcia-Ybarra, P. L., and Castillo, J. L. (2010). High platinum utilization in ultra-low Pt loaded PEM fuel cell cathodes prepared by electrospraying. Int. J. Hydrogen Energy 35, 10446–10451. doi:10.1016/j.ijhydene.2010.07.069
McNeary, W. W., Linico, A. E., and Weimer, A. W. (2020). Water management implications for ALD-modified polymer electrolyte membrane fuel cell catalysts. J. Nanoparticle Res. 22, 185. doi:10.1007/s11051-020-04921-8
Mohseninia, A., Kartouzian, D., Eppler, M., Langner, P., Markötter, H., Wilhelm, F., et al. (2020). Influence of structural modification of micro-porous layer and catalyst layer on performance and water management of PEM fuel cells: hydrophobicity and porosity. Fuel Cells 20, 469–476. doi:10.1002/fuce.201900203
Mulone, V., and Karan, K. (2013). Analysis of capillary flow driven model for water transport in PEFC cathode catalyst layer: consideration of mixed wettability and pore size distribution. Int. J. Hydrogen Energy 38, 558–569. doi:10.1016/j.ijhydene.2012.07.107
Murata, S., Imanishi, M., Hasegawa, S., and Namba, R. (2014). Vertically aligned carbon nanotube electrodes for high current density operating proton exchange membrane fuel cells. J. Power Sources 253, 104–113. doi:10.1016/j.jpowsour.2013.11.073
Nagamori, K., Aoki, S., Ikegawa, M., Tamoto, K., Honda, Y., Seki, Y., et al. (2023). Impacts of Pt/carbon black catalyst surface hydrophilicity on ionomer distribution and durability during water-generating load cycling of polymer electrolyte fuel cells. ACS Appl. Energy Mat. 6, 11481–11496. doi:10.1021/acsaem.3c01706
Neaţu, Ş., Neaţu, F., Chirica, I. M., Borbáth, I., Tálas, E., Tompos, A., et al. (2021). Recent progress in electrocatalysts and electrodes for portable fuel cells. J. Mat. Chem. A 9, 17065–17128. doi:10.1039/d1ta03644k
Nguyen, H., Sultanova, D., Heizmann, P. A., Vierrath, S., and Breitwieser, M. (2022). Improving the efficiency of fully hydrocarbon-based proton-exchange membrane fuel cells by ionomer content gradients in cathode catalyst layers. Mat. Adv. 3, 8460–8468. doi:10.1039/d2ma00761d
Nonoyama, N., Okazaki, S., Weber, A. Z., Ikogi, Y., and Yoshida, T. (2011). Analysis of oxygen-transport diffusion resistance in proton-exchange-membrane fuel cells. J. Electrochem Soc. 158, B416. doi:10.1149/1.3546038
Ono, Y., Mashio, T., Takaichi, S., Ohma, A., Kanesaka, H., and Shinohara, K. (2010). The analysis of performance loss with low platinum loaded cathode catalyst layers. ECS Trans. 28, 69–78. doi:10.1149/1.3496614
Ono, Y., Ohma, A., Shinohara, K., and Fushinobu, K. (2013). Influence of equivalent weight of ionomer on local oxygen transport resistance in cathode catalyst layers. J. Electrochem. Soc. 160, F779–F787. doi:10.1149/2.040308jes
Orfanidi, A., Madkikar, P., El-Sayed, H. A., Harzer, G. S., Kratky, T., and Gasteiger, H. A. (2017). The key to high performance low Pt loaded electrodes. J. Electrochem. Soc. 164, F418–F426. doi:10.1149/2.1621704jes
Ott, S., Orfanidi, A., Schmies, H., Anke, B., Nong, H. N., Hübner, J., et al. (2020). Ionomer distribution control in porous carbon-supported catalyst layers for high-power and low Pt-loaded proton exchange membrane fuel cells. Nat. Mat. 19, 77–85. doi:10.1038/s41563-019-0487-0
Owejan, J. P., Owejan, J. E., and Gu, W. (2013). Impact of platinum loading and catalyst layer structure on PEMFC performance. J. Electrochem. Soc. 160, F824–F833. doi:10.1149/2.072308jes
Padgett, E., Andrejevic, N., Liu, Z., Kongkanand, A., Gu, W., Moriyama, K., et al. (2018). Editors’ choice—connecting fuel cell catalyst nanostructure and accessibility using quantitative cryo-STEM tomography. J. Electrochem. Soc. 165, F173–F180. doi:10.1149/2.0541803jes
Paul, M. T. Y., Kim, D., Saha, M. S., Stumper, J., and Gates, B. D. (2020). Patterning catalyst layers with microscale features by soft lithography techniques for proton exchange membrane fuel cells. ACS Appl. Energy Mat. 3, 478–486. doi:10.1021/acsaem.9b01754
Pollet, B. G., Kocha, S. S., and Staffell, I. (2019). Current status of automotive fuel cells for sustainable transport. Curr. Opin. Electrochem. 16, 90–95. doi:10.1016/j.coelec.2019.04.021
Poojary, S., Islam, M. N., Shrivastava, U. N., Roberts, E. P. L., and Karan, K. (2020). Transport and electrochemical interface properties of ionomers in low-Pt loading catalyst layers: effect of ionomer equivalent weight and relative humidity. Molecules 25, 3387. doi:10.3390/molecules25153387
Ramaswamy, N., Gu, W., Ziegelbauer, J. M., and Kumaraguru, S. (2020). Carbon support microstructure impact on high current density transport resistances in PEMFC cathode. J. Electrochem. Soc. 167, 064515. doi:10.1149/1945-7111/ab819c
Ramaswamy, N., Kumaraguru, S., Koestner, R., Fuller, T., Gu, W., Kariuki, N., et al. (2021). Editors’ choice—ionomer side chain length and equivalent weight impact on high current density transport resistances in PEMFC cathodes. J. Electrochem. Soc. 168, 024518. doi:10.1149/1945-7111/abe5eb
Roh, C. W., Choi, J., and Lee, H. (2018). Hydrophilic-hydrophobic dual catalyst layers for proton exchange membrane fuel cells under low humidity. Electrochem. Commun. 97, 105–109. doi:10.1016/j.elecom.2018.11.003
Rolfi, A., Oldani, C., Merlo, L., Facchi, D., and Ruffo, R. (2018). New perfluorinated ionomer with improved oxygen permeability for application in cathode polymeric electrolyte membrane fuel cell. J. Power Sources 396, 95–101. doi:10.1016/j.jpowsour.2018.05.093
Sabarirajan, D. C., Liu, J., Qi, Y., Perego, A., Haug, A. T., and Zenyuk, I. V. (2020). Determining proton transport in pseudo catalyst layers using hydrogen pump DC and AC techniques. J. Electrochem. Soc. 167, 084521. doi:10.1149/1945-7111/ab927d
Sakai, K., Sato, K., Mashio, T., Ohma, A., Yamaguch, K., and Shinohara, K. (2009). Analysis of reactant gas transport in catalyst layers; effect of Pt-loadings. ECS Trans. 25, 1193–1201. doi:10.1149/1.3210674
Sánchez-Ramos, A., Gostick, J. T., and García-Salaberri, P. A. (2021). Modeling the effect of low Pt loading cathode catalyst layer in polymer electrolyte fuel cells: Part I. Model formulation and validation. J. Electrochem. Soc. 168, 124514. doi:10.1149/1945-7111/ac4456
Sánchez-Ramos, A., Gostick, J. T., and García-Salaberri, P. A. (2022). Modeling the effect of low Pt loading cathode catalyst layer in polymer electrolyte fuel cells. Part II: parametric analysis. J. Electrochem. Soc. 169, 074503. doi:10.1149/1945-7111/ac811d
Sassin, M. B., Garsany, Y., Gould, B. D., and Swider-Lyonsa, K. (2016). Impact of compressive stress on MEA pore structure and its consequence on PEMFC performance. J. Electrochem. Soc. 163, F808–F815. doi:10.1149/2.0291608jes
Schuler, T., Chowdhury, A., Freiberg, A. T., Sneed, B., Spingler, F. B., Tucker, M. C., et al. (2019). Fuel-cell catalyst-layer resistance via hydrogen limiting-current measurements. J. Electrochem. Soc. 166, F3020–F3031. doi:10.1149/2.0031907jes
Sharma, S., and Pollet, B. G. (2012). Support materials for PEMFC and DMFC electrocatalysts - a review. J. Power. Sources 208, 96–119. doi:10.1016/j.jpowsour.2012.02.011
Shen, S., Cheng, X., Wang, C., Yan, X., Ke, C., Yin, J., et al. (2017). Exploration of significant influences of the operating conditions on the local O2 transport in proton exchange membrane fuel cells (PEMFCs). Phys. Chem. Chem. Phys. 19, 26221–26229. doi:10.1039/c7cp04837h
Shen, W., Li, Z., and Liu, Y. (2008). Surface chemical functional groups modification of porous carbon. Recent Pat. Chem. Eng. 1, 27–40. doi:10.2174/2211334710801010027
Shukla, S., Domican, K., Karan, K., Bhattacharjee, S., and Secanell, M. (2014). Analysis of low platinum loading thin polymer electrolyte fuel cell electrodes prepared by inkjet printing. Electrochim. Acta 156, 289–300. doi:10.1016/j.electacta.2015.01.028
Sun, F., Liu, H., Chen, M., and Wang, H. (2023). Boosting oxygen transport through mitigating the interaction between Pt and ionomer in proton exchange membrane fuel cell. J. Power Sources 553, 232240. doi:10.1016/j.jpowsour.2022.232240
Sun, X., Yu, H., Gao, X., and Shao, Z. (2021). The threshold method in the analysis of catalyst layer porosity towards oxygen transport resistance in PEMFCs. Catal. Sci. Technol. 11, 6804–6810. doi:10.1039/d1cy00882j
Sun, X., Yu, H., Zhou, L., Gao, X., Zeng, Y., Yao, D., et al. (2020). Influence of platinum dispersity on oxygen transport resistance and performance in PEMFC. Electrochim. Acta 332, 135474. doi:10.1016/j.electacta.2019.135474
Takahashi, K., Kakinuma, K., and Uchida, M. (2016). Improvement of cell performance in low-Pt-loading PEFC cathode catalyst layers prepared by the electrospray method. J. Electrochem. Soc. 163, F1182–F1188. doi:10.1149/2.0611610jes
Tempelaere, M., Zimmermann, M., and Chatenet, M. (2023). 3D-structured electrocatalysts for improved mass-transfer in proton-exchange membrane fuel cell cathodes. Curr. Opin. Electrochem. 41, 101353. doi:10.1016/j.coelec.2023.101353
Turtayeva, Z., Xu, F., Dillet, J., Mozet, K., Peignier, R., Celzard, A., et al. (2022). Manufacturing catalyst-coated membranes by ultrasonic spray deposition for PEMFC: identification of key parameters and their impact on PEMFC performance. Int. J. Hydrogen Energy 47, 16165–16178. doi:10.1016/j.ijhydene.2022.03.043
Uchida, M. (2020). PEFC catalyst layers: effect of support microstructure on both distributions of Pt and ionomer and cell performance and durability. Curr. Opin. Electrochem. 21, 209–218. doi:10.1016/j.coelec.2020.02.019
Uchida, M., Aoyama, Y., Eda, N., and Ohta, A. (1995a). Investigation of the microstructure in the catalyst layer and effects of both perfluorosulfonate ionomer and PTFE-loaded carbon on the catalyst layer of polymer electrolyte fuel cells. J. Electrochem. Soc. 142, 4143–4149. doi:10.1149/1.2048477
Uchida, M., Aoyama, Y., Eda, N., and Ohta, A. (1995b). New preparation method for polymer-electrolyte fuel cells. J. Electrochem. Soc. 142, 463–468. doi:10.1149/1.2044068
Uchida, M., Fukuoka, Y., Sugawara, Y., Eda, N., and Ohta, A. (1996). Effects of microstructure of carbon support in the catalyst layer on the performance of polymer-electrolyte fuel cells. J. Electrochem. Soc. 143, 2245–2252. doi:10.1149/1.1836988
U.S. Department of Energy, (2022). USA: U.S. Department of Energy. https://www.hydrogen.energy.gov/program_records.html.DOE hydrogen and fuel cells program record
Vairavapandian, D., Vichchulada, P., and Lay, M. D. (2008). Preparation and modification of carbon nanotubes: review of recent advances and applications in catalysis and sensing. Anal. Chim. Acta 626, 119–129. doi:10.1016/j.aca.2008.07.052
Wang, C., Cheng, X., Lu, J., Shen, S., Yan, X., Yin, J., et al. (2017). The experimental measurement of local and bulk oxygen transport resistances in the catalyst layer of proton exchange membrane fuel cells. J. Phys. Chem. Lett. 8, 5848–5852. doi:10.1021/acs.jpclett.7b02580
Wang, C., Cheng, X., Yan, X., Shen, S., Ke, C., Wei, G., et al. (2019). Respective influence of ionomer content on local and bulk oxygen transport resistance in the catalyst layer of PEMFCs with low Pt loading. J. Electrochem. Soc. 166, F239–F245. doi:10.1149/2.0401904jes
Weber, A. Z., Balasubramanian, S., and Das, P. K. (2012). Chapter 2 - proton exchange membrane fuel cells. Adv. Chem. Eng. 41, 65–144. doi:10.1016/B978-0-12-386874-9.00003-8
Weber, A. Z., and Kusoglu, A. (2014). Unexplained transport resistances for low-loaded fuel-cell catalyst layers. J. Mat. Chem. A 2, 17207–17211. doi:10.1039/c4ta02952f
Wee, J. H. (2007). Applications of proton exchange membrane fuel cell systems. Renew. Sustain. energy Rev. 11, 1720–1738. doi:10.1016/j.rser.2006.01.005
Whiston, M. M., Azevedo, I. L., Litster, S., Whitefoot, K. S., Samaras, C., and Whitacre, J. F. (2019). Expert assessments of the cost and expected future performance of proton exchange membrane fuel cells for vehicles. Proc. Natl. Acad. Sci. 116, 4899–4904. doi:10.1073/pnas.1804221116
Woo, S., Lee, S., Taning, A. Z., Yang, T. H., Park, S. H., and Yim, S. D. (2020). Current understanding of catalyst/ionomer interfacial structure and phenomena affecting the oxygen reduction reaction in cathode catalyst layers of proton exchange membrane fuel cells. Curr. Opin. Electrochem. 21, 289–296. doi:10.1016/j.coelec.2020.03.006
Yakovlev, Y. V., Lobko, Y. V., Vorokhta, M., Nováková, J., Mazur, M., Matolínová, I., et al. (2021). Ionomer content effect on charge and gas transport in the cathode catalyst layer of proton-exchange membrane fuel cells. J. Power Sources 490, 229531. doi:10.1016/j.jpowsour.2021.229531
Yarlagadda, V., Carpenter, M. K., Moylan, T. E., Kukreja, R. S., Koestner, R., Gu, W., et al. (2018). Boosting fuel cell performance with accessible carbon mesopores. ACS Energy Lett. 3, 618–621. doi:10.1021/acsenergylett.8b00186
Yarlagadda, V., Ramaswamy, N., Kukreja, R. S., and Kumaraguru, S. (2022). Ordered mesoporous carbon supported fuel cell cathode catalyst for improved oxygen transport. J. Power Sources 532, 231349. doi:10.1016/j.jpowsour.2022.231349
Yoshino, S., Shinohara, A., Kodama, K., and Morimoto, Y. (2020). Fabrication of catalyst layer with ionomer nanofiber scaffolding for polymer electrolyte fuel cells. J. Power Sources 476, 228584. doi:10.1016/j.jpowsour.2020.228584
Yue, M., Jemei, S., Zerhouni, N., and Gouriveau, R. (2021). Proton exchange membrane fuel cell system prognostics and decision-making: current status and perspectives. Renew. Energy 179, 2277–2294. doi:10.1016/j.renene.2021.08.045
Zapardiel, D., and García-Salaberri, P. A. (2022). Modeling the interplay between water capillary transport and species diffusion in gas diffusion layers of proton exchange fuel cells using a hybrid computational fluid dynamics formulation. J. Power Sources 520, 230735. doi:10.1016/j.jpowsour.2021.230735
Zhang, Q., Dong, S., Shao, P., Zhu, Y., Mu, Z., Sheng, D., et al. (2022). Covalent organic framework–based porous ionomers for high-performance fuel cells. Science 378, 181–186. doi:10.1126/science.abm6304
Keywords: MEA, catalyst layer, oxygen resistance, performance, Pt loading, PEFC
Citation: García-Salaberri PA, Das PK and Chaparro AM (2024) Local oxygen transport resistance in polymer electrolyte fuel cells: origin, dependencies and mitigation. Front. Energy Res. 12:1357325. doi: 10.3389/fenrg.2024.1357325
Received: 17 December 2023; Accepted: 18 March 2024;
Published: 02 April 2024.
Edited by:
Nada Zamel, Fraunhofer Institute for Solar Energy Systems (ISE), GermanyReviewed by:
Zhiming Bao, Tianjin University, ChinaXiaohui Yan, Shanghai Jiao Tong University, China
Yuze Hou, Fraunhofer Institute for Solar Energy Systems (ISE), Germany
Thomas Kadyk, Helmholtz Association of German Research Centres (HZ), Germany
Copyright © 2024 García-Salaberri, Das and Chaparro. This is an open-access article distributed under the terms of the Creative Commons Attribution License (CC BY). The use, distribution or reproduction in other forums is permitted, provided the original author(s) and the copyright owner(s) are credited and that the original publication in this journal is cited, in accordance with accepted academic practice. No use, distribution or reproduction is permitted which does not comply with these terms.
*Correspondence: Pablo A. García-Salaberri, cGFnc2FsYWJAaW5nLnVjM20uZXM=