 Lidong Liu*
 Mengli Zhang
 Jianjun Gong
- College of Automobile and Traffic Engineering, Liaoning University of Technology, Jinzhou, China
Ensuring the optimal operating temperature is imperative for achieving efficient performance in proton exchange membrane fuel cells. Consequently, this study introduces a dual-model predictive control strategy to regulate the water pump and cooling fan in a cooling system. Initially, we establish an electrochemical and thermal model for fuel cell stacks and validate the model’s accuracy through experimental data. The system model is linearized, and the model predictive control (MPC) controller is formulated using the MATLAB/Simulink toolbox. Subsequently, it is collaboratively simulated with the electrochemical model of the fuel cell stack and the temperature model. To evaluate the effectiveness of the MPC controller, we conducted a comparative analysis with the traditional proportional–integral–derivative (PID) control and water pump MPC under step load, uniform load increase, and variable target scenarios. The findings indicate that in contrast to the PID control, the MPC controller significantly decreases the stack temperature difference fluctuation by more than 50%, maintaining the stack temperature within ±0.6 K of the set value. Furthermore, we independently assessed the performance of the MPC controller under varying ambient temperatures. The findings illustrate that the dual MPC method proficiently adapts cooling parameters across different ambient temperature ranges (288.15 K–308.15 K), ensuring the stable performance of the fuel cell. The model is linearized, and the simulation work is explained mainly on the MATLAB/Simulink platform. In order to compare the effectiveness of the MPC controller, the comparison with the MPC controller strategy of the water pump is added, which can better reflect the effectiveness of the proposed collaborative MPC controller strategy.
1 Introduction
The efficient fuel cell technology stands out as a crucial solution for addressing modern energy and environmental challenges. Its advantages, which include low emissions, high efficiency, and compatibility with various sustainable energy sources, have led to its widespread applications. These encompass the transportation, energy production, and backup power generation sectors (Sonia et al., 2023). However, to fully unlock the potential of fuel cells, the imperative consideration of temperature control arises for ensuring their optimal operation (Chao, 2020).
Within fuel cells, maintaining the stability of operational temperature is crucial for optimizing their performance, extending their lifespan, and ensuring safety. Deviations in temperature, whether excessively elevated or diminished, can lead to decreased efficiency, accelerated material degradation, and compromised system reliability (Chi-Young et al., 2012). Hence, attaining precise and effective temperature control is imperative for ensuring the sustainable operation of fuel cells.
In the exploration of temperature characteristics of the proton exchange membrane fuel cell (PEMFC), numerous researchers have introduced mathematical models to forecast the operational behaviors of these fuel cells (Mogorosi et al., 2020; Omran et al., 2021). Khan and Iqbal (2005) introduced a dynamic model for PEMFC in 2005, demonstrating its capacity to simulate voltage and temperature fluctuations amidst dynamic changes in load conditions. Dawn and Mark (2010) formulated an isothermal model for PEMFCs in 2010, encompassing considerations of both physical and chemical reactions. Shaker (2011) introduced the analytical model for characterizing the I-V (current–voltage) curve of PEMFCs in 2011, while Salva et al. (2016) introduced a model for PEMFCs, emphasizing the analysis of temperature distribution within the PEMFC stack in 2016.
Consequently, to enhance the stability of the operational temperature within fuel cell stacks, a multitude of scholars have conducted comprehensive research in the domain of temperature control. Sedighizadeh and Fathian (2012) devised a PID control approach for multi-objective optimization of PEMFCs' system temperature. Through experiments utilizing a non-linear model and applying multi-objective optimization, a straightforward temperature control design (linear control structure) with commendable performance can be achieved (Sedighizadeh and Fathian, 2012). Han et al. (2015) developed a state-space controller using a linearized model. They took into account the parasitic power consumption of the cooling fan and cooling pump, and the simulation results indicated that the proposed state-space controller can stabilize the system temperature at the set value. However, experimental verification was not conducted. Zou and Kim (2019) conducted a comparative analysis of the simulation effects of the fuel cell temperature using fuzzy control, on/off control, state feedback control, and PID control. The data revealed that fuzzy control can maintain the temperature within a 2 K range and proves to be more effective. Huang et al. (2018) implemented an adaptive control strategy in the PEMFCs' temperature control system to attain the desired control target. Oh et al. (2014) had developed the MPC and validated its effectiveness. The temperature control system was optimized through the MPC, and the combined simulation was carried out using the software Simulink and AMESim. The simulation results exhibit reduced power loss when compared with before the optimization. The drawbacks of frequent rotational speed changes caused by the switch control strategy were addressed by Guo (2020).
The traditional temperature control methods, notably the proportional–integral–derivative (PID) control, have found widespread application in fuel cell systems. Nevertheless, these approaches often encounter difficulties in addressing non-linear dynamics and multivariable control, challenges that are frequently encountered in practical applications. Conversely, MPC strategies have demonstrated notable success in numerous industrial processes, showcasing their proficiency in managing complex system dynamics and multivariable control (Zhang and Yu, 2009; Fan et al., 2013; Lechartier et al., 2015; Robin et al., 2016; Chatrattanawet et al., 2017; Ebrahimi et al., 2017). Therefore, this study endeavors to investigate the implementation of dual MPC temperature control strategies in fuel cell systems, with the goal of optimizing their efficiency and performance.
2 System description and model building
2.1 System description
Figure 1 shows that within a PEMFC, a cell comprises essential components, encompassing bipolar plates, a proton exchange membrane (PEM), gas diffusion layers (GDLs), and catalyst layers. At the anode, the catalytic decomposition of hydrogen gas generates protons and electrons. Protons traverse the PEM to the cathode, where they combine with oxygen to form water and generate heat. Simultaneously, electrons liberated at the anode traverse an external circuit to the cathode, generating an electric current that powers the load.
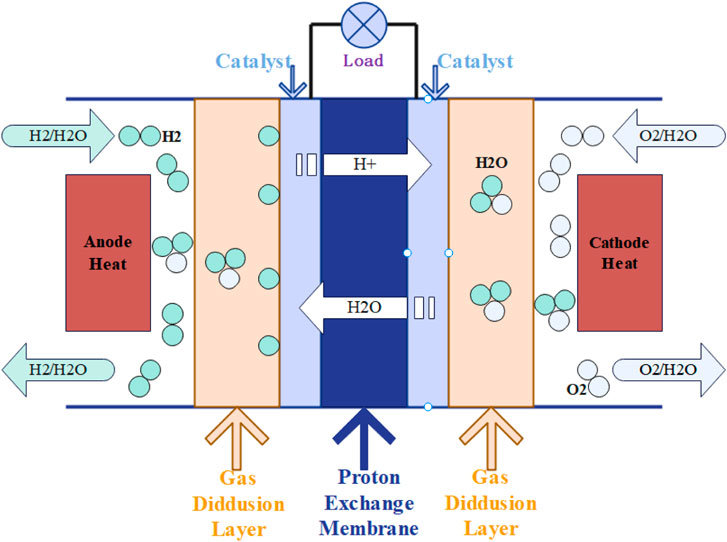
FIGURE 1. Functioning mechanism of PEMFC.
2.2 Electrochemical model
The format of the formulas involved in the article has been completely modified.
The expression of voltage for an individual cell within a PEMFC is given as follows:
where
where
where
where A is the area of the membrane,
where
where α1, α2, α3, and α4 represent the parameters of the fuel cell,
2.3 Temperature model
To facilitate the construction and analysis of the model, the following assumptions are made:
(1) Assuming that the chemical energy of the gas involved in the fuel cell reaction is exclusively converted into electrical and thermodynamic energy without dissipation into other forms of energy.
(2) Assuming that the gas not involved in the reaction will not affect the temperature system.
(3) Supposing that the stack cooling water outlet temperature Tout,st is approximately regarded as the stack temperature
As shown in the Figure 2, the fuel cell temperature management model is established, mainly including the fuel cell, circulating water pump, cooling fan, water tank, and temperature sensor and controller.
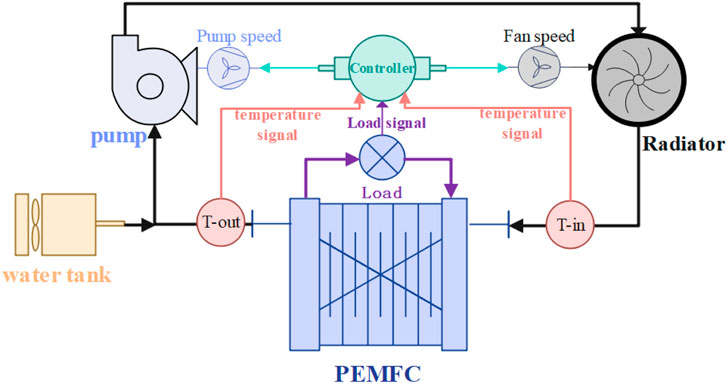
FIGURE 2. PEMFC temperature management system.
Based on the thermal balance equation
where
where
where
where
where
where
2.4 Model validation
To validate the precision of the electrochemical model, we selected two different working temperatures, 333 K and 335 K, with specific parameters as shown in Table 1. By contrasting the simulation results with the experimental data, as depicted in Figure 3, it is evident that the simulation results align with the experimental data trend, confirming the reliability and effectiveness of the simulation model. Additionally, Figures 4A,B display the validation curve for the PEMFC current and temperature model and illustrate that with a step change in current, the temperature promptly responds to the variation in current, showing a high degree of agreement between the simulation curve and experimental data. This observation underscores the reliability and effectiveness of the temperature model.

TABLE 1. Model parameter.
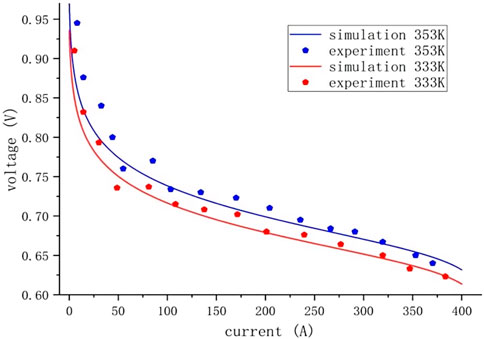
FIGURE 3. Verification of the PEMFC electrochemical model.
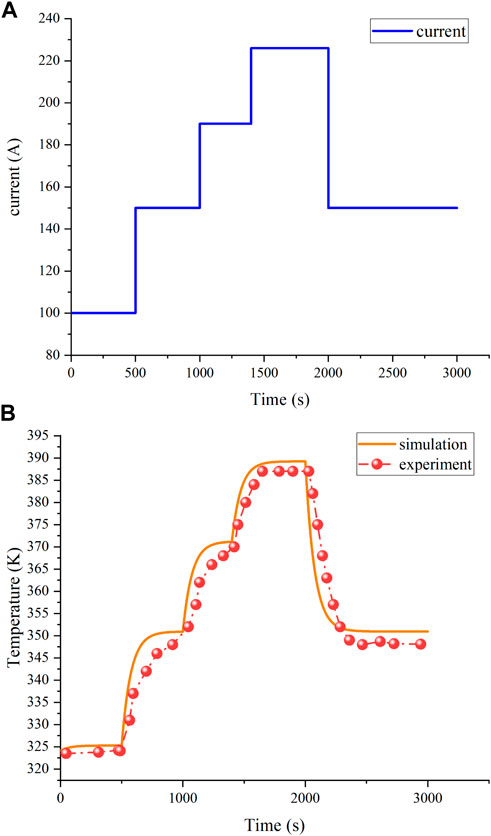
FIGURE 4. Verification of the temperature model. (A) Load current and (B) temperature.
3 Research on fuel cell MPC controller strategy
3.1 Introduction to control strategy
Effective temperature control is imperative for optimizing fuel cell performance and ensuring long-term reliability. This study introduces a collaborative MPC strategy for managing fuel cell pumps and radiators and compares it with the traditional PID control and water pump MPC. Table 2 outlines the three control strategies, and Figure 5 illustrates their application to the fuel cell thermal management system. Figure 6A depicts PID control, a classic technique combining proportional, integral, and derivative components for temperature regulation. By contrast, Figure 6B showcases MPC employing predictive models to optimize inputs while considering constraints and dynamic control (Bressel et al., 2020; Rui et al., 2020). Implementing MPC for the fuel cell’s water pump and radiator allows a performance comparison against PID control. This analysis aims to identify the optimal temperature control strategy, enhancing fuel cell system efficiency and stability.

TABLE 2. Different control strategies.
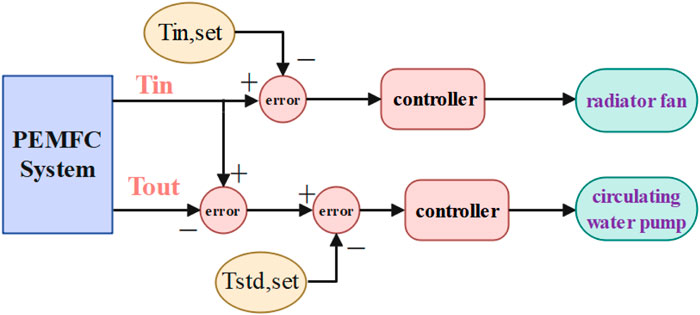
FIGURE 5. Thermal management control.
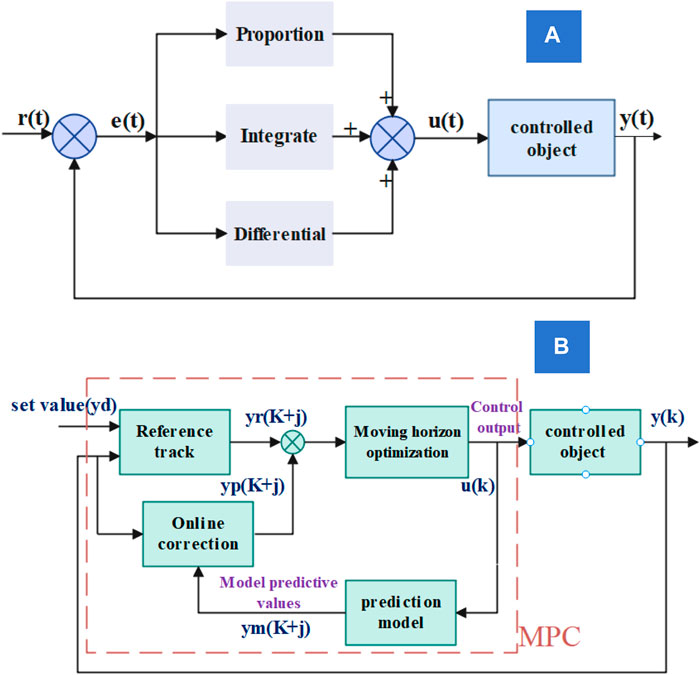
FIGURE 6. Control principle. (A) PID control principle; (B) MPC principle.
3.2 Linearization of the system model
In fuel cell system research, we linearized the model to understand its dynamic response at various operating points. Focusing on crucial input parameters, such as cooling fan flow rate and coolant flow rate, and outputs like reactor input temperature and temperature difference, we derived two transfer functions through linear approximation. These functions effectively depict how coolant and fan flow rates impact reactor temperature. Using the temperature and flow rate as operating points allows the precise capture of the system’s dynamic behavior, which is a valuable tool for optimizing fuel cell performance. Linearizing the transfer function simplifies the complexity of non-linear systems, making system behavior more comprehensible. This aids in controller design, allowing the application of classical methods tailored for linear systems, ultimately optimizing system performance.
3.3 Introduction to the MPC algorithm
MPC excels over PID by offering predictive capability, handling constraints, and optimizing multivariable control. Its adaptability to system changes, optimal control approach, and effectiveness in handling non-linearities make it a superior choice for complex and dynamic systems. The pulse response model was utilized to forecast the output at future time points.
where p is the prediction time domain (1 < j < p),
where m should be less than p, and m is the control time domain. The p-step forecasted values for the upcoming output values are
where the value of j is taken from 1 to m − 1.
where the value of j in the above formula is the integer from m to p. The control effect can be categorized as either known or unknown.
The controlled effects when known are
The controlled effects when unknown are
Because there are various disturbances in the actual control process, the system is controlled at all times, and the actual output value y (k) will have a certain error with the output prediction value
Correction against the predicted value of the model yields the following formula:
Then, the P-step prediction value of the system can be expressed as follows:
where
The predictive control does not require rapid tracking of the setpoint, rather it prompts a gradual convergence of the output toward the setpoint along a specific trajectory. The reference track is calculated using both the setpoint and current measurements of the process output and is expressed as follows:
where
The target functions for the optimization control are
In the
Solving for the optimal control rate
where Q is the output tracking weight, and R is the input move weight.
The optimal control of time K is
3.4 The MPC is implemented in the thermal management system
The MPC method is used for water pump control and radiator control. When applying the MPC control to the water pump:
where
The predicted temperature
The optimal control objective function for the water pump is given as follows:
where
When applied to radiator control:
where
The optimal control objective function for the radiator is given as follows:
where
4 Results and discussion
4.1 Comparison of temperature control effect under step load
Figure 7A illustrates a step current varying from 100 A to 220 A, showcasing step changes in current over time. Figures 7B,E depict temperature variations in the stack and fluctuations in temperature difference between the stack's inlet and outlet under different control strategies. It is evident that for both the stack inlet and outlet temperatures, the MPC collaborative control strategy exhibits superior performance. Comparative analysis with the traditional PID control and water pump MPC reveals significantly improved overshoot and stability time, as detailed in Table 3. The MPC strategy notably enhances control of the temperature difference between the reactor inlet and outlet, reducing fluctuation by over 50% and achieving a shorter settling time. This heightened control performance underscores the effectiveness of the MPC strategy in maintaining stability and precision.
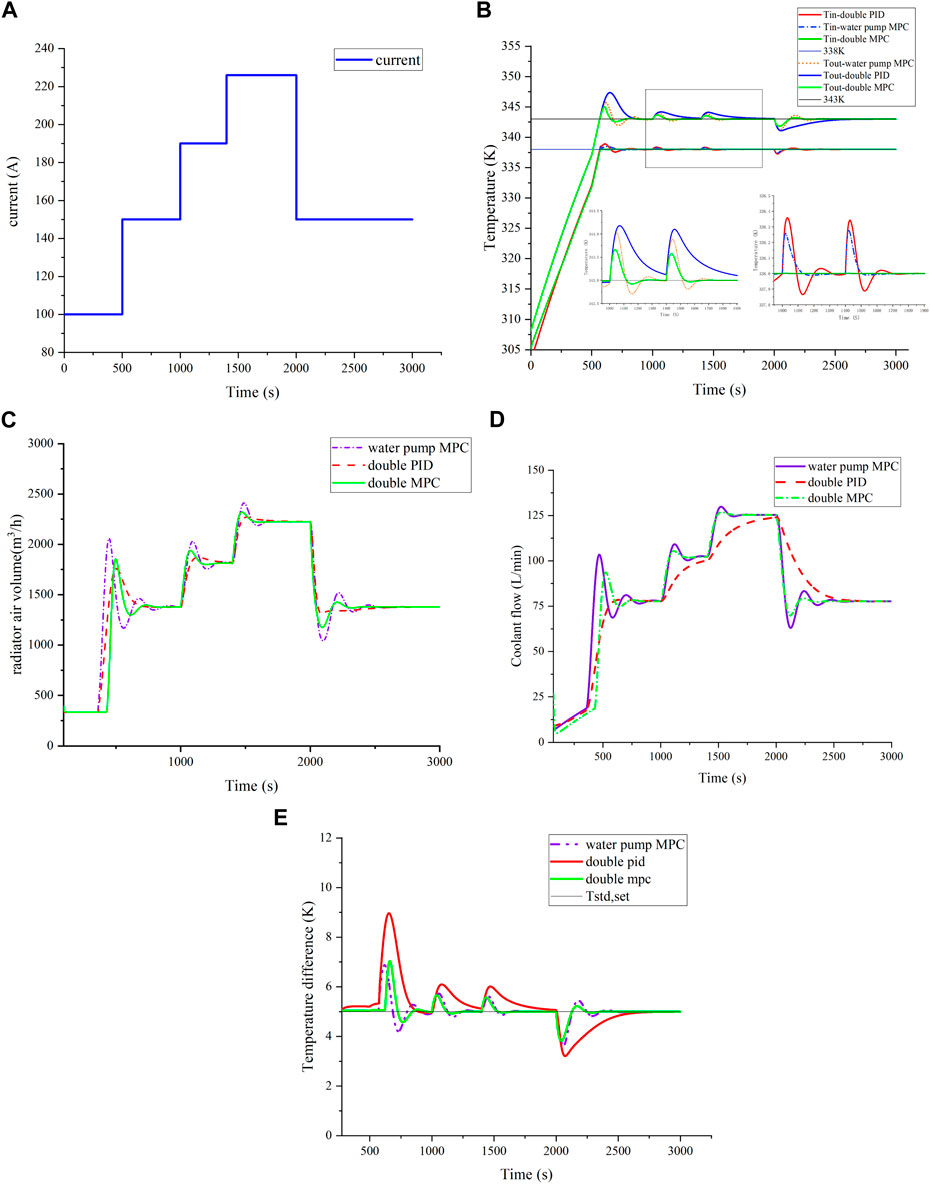
FIGURE 7. Temperature control effect under step load. (A) Step load; (B) comparison of temperature control effect under step load; (C) comparison of radiator air volume; (D) comparison of coolant flow; and (E) comparison of temperature difference.

TABLE 3. Control effect comparison.
In reactor thermal management, the controller directly regulates the coolant flow rate and cooling fan air volume as crucial control variables, ensuring rapid response for desired reactor inlet and outlet temperatures. Figures 7C,D reveal that under MPC, the coolant flow and radiator air volume adeptly track current changes, optimizing heat dissipation and maintaining temperature balance. Compared to PID-controlled gradual flow changes, pump MPC and cooperative MPC show quicker responses, with the cooperative MPC demonstrating superior super-harmonic response and stabilization time.
4.2 Temperature control effect under constant-speed load
To comprehensively compare control strategies, an increasing load was chosen, and current variations are shown in Figure 8A. Temperature control outcomes are presented in Figures 8B,E. Under a constant speed load change, cooperative MPC exhibits minimal temperature fluctuation, effectively tracking current changes and maintaining temperature near the 0.15 K target. By contrast, PID control shows a 0.78 K temperature fluctuation, while water pump MPC surpasses PID by approximately 0.23 K, highlighting MPC’s superior stability. The temperature difference fluctuation under MPC is significantly better than in PID, emphasizing MPC’s enhanced control performance.
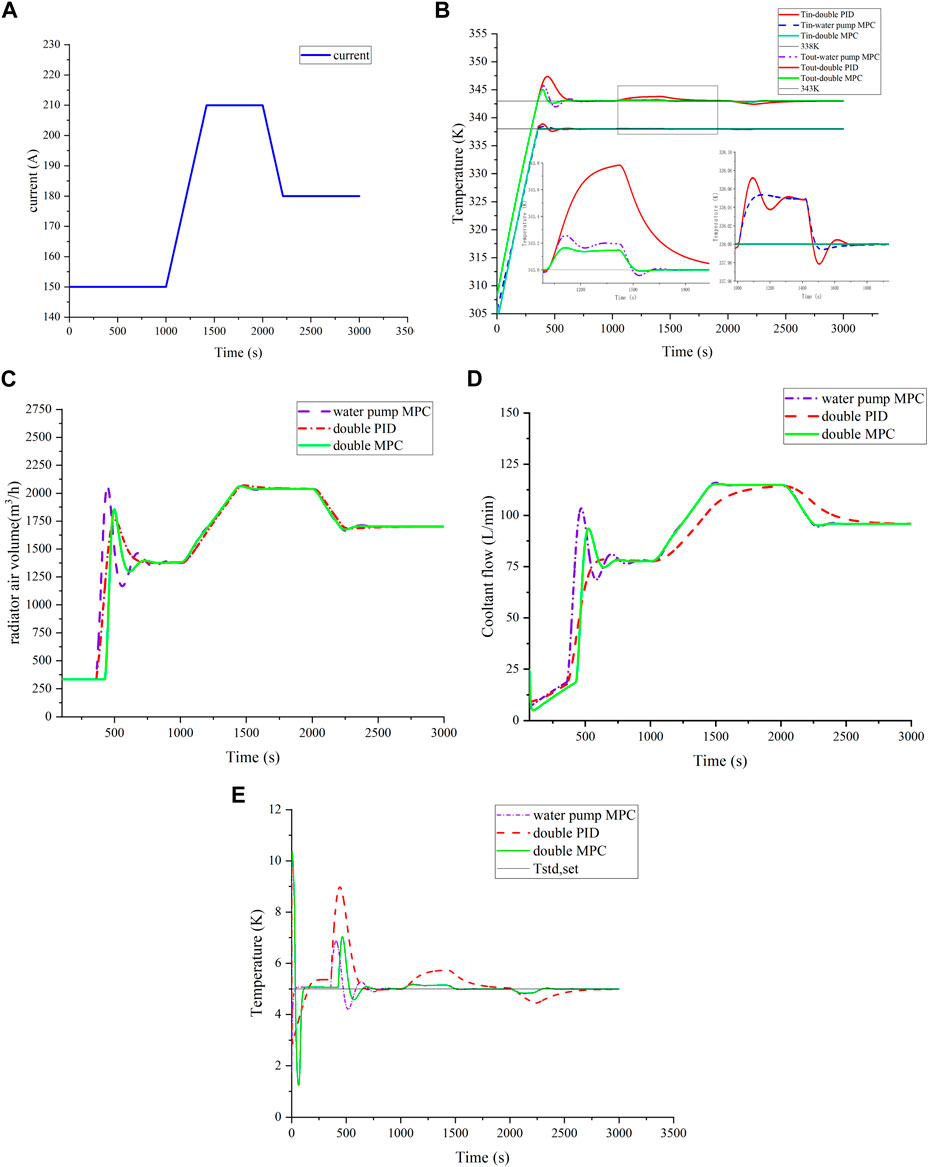
FIGURE 8. Temperature control effect under ramp load. (A) Ramp load; (B) comparison of temperature control effect under ramp load; (C) comparison of radiator air volume; (D) comparison of coolant flow; and (E) comparison of temperature difference.
Data in Figures 8C,D highlight MPC’s ability to accurately track current changes for efficient heat dissipation and system temperature balance. The PID controlled flow following response is obviously slow, so the reactor outlet temperature under PID control fluctuates longer. This emphasizes MPC’s advantages in achieving rapid and precise thermal management, contributing to improved system performance and stability.
4.3 Temperature control effect in a variable target situation
This subsection evaluates the MPC controller’s ability to track targets under changed conditions, using the load current as shown in Figure 9A. At 1,400 s, the outlet control target increases from 343 K to 348 K, and the inlet control target increases from 338 K to 343 K. Figure 9E highlights MPC’s superior control effectiveness in the temperature difference analysis. Temperature control outcomes are presented in Figure 9B.
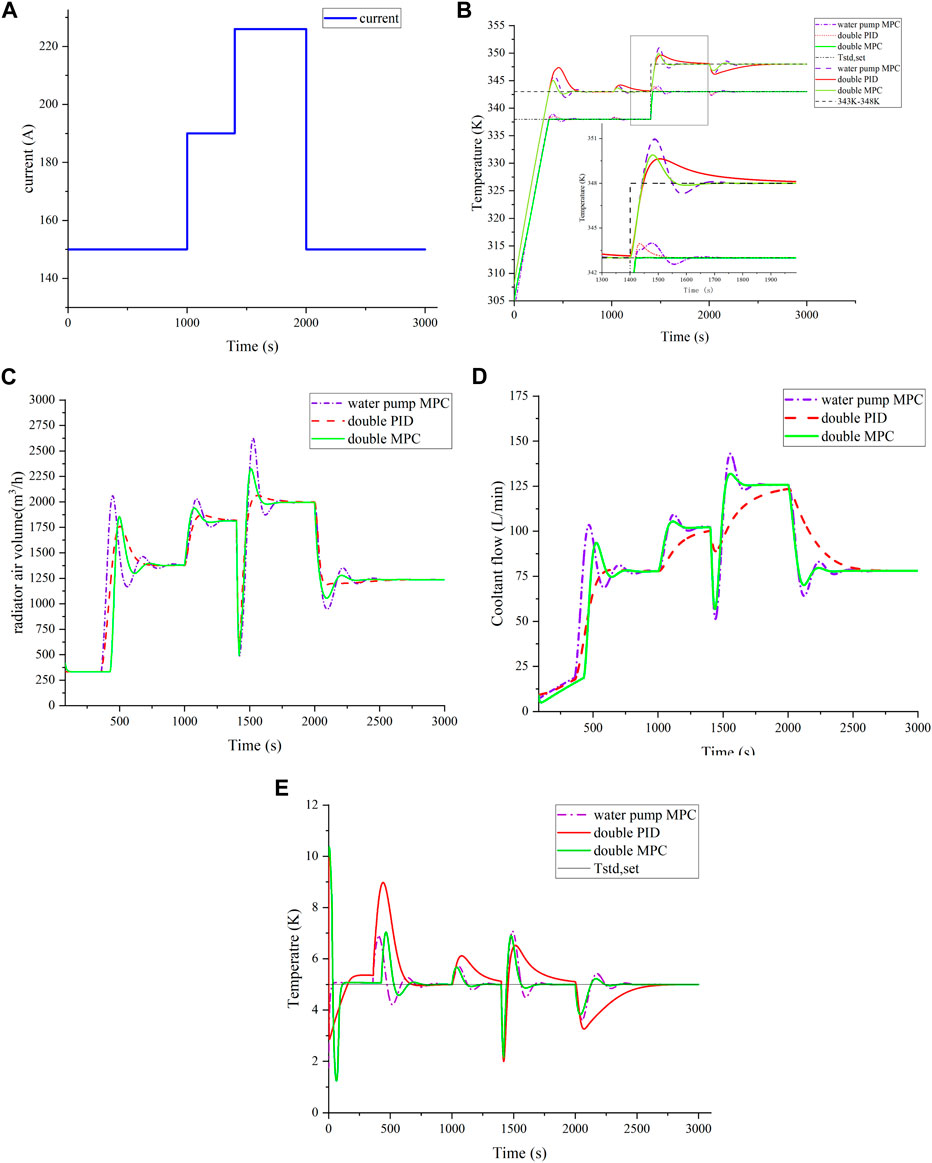
FIGURE 9. Temperature control effect in a variable target situation. (A) Step load; (B) comparison of temperature control effect under variable target; (C) comparison of radiator air volume; (D) comparison of coolant flow; and (E) comparison of temperature difference.
In Figures 9C,D, the coolant flow rate and heat dissipation air volume respond to the step change in the control target temperature. The initial rapid decline in the coolant flow rate reduces heat removal, leading to an increase in outlet coolant temperature. This results in decreased cooling air volume and an increase in inlet coolant temperature. As the temperature reaches the set value, the controller smoothly transitions into the operational mode. The pump flow surges, and the cooling fan flow increases for efficient heat dissipation. Under MPC, the flow stabilizes rapidly, while under PID control, it gradually decreases before reaching a steady state. After approximately 50 s, the inlet coolant temperature approaches the new set point, and the outlet coolant temperature stabilizes after a brief fluctuation. In summary, MPC effectively controls variable targets.
4.4 Temperature control effect in a variable target situation
Considering the substantial impact of ambient temperature on PEMFC, we aimed to compare MPC’s temperature regulation performance across varied ambient temperatures. Figure 10A depicts stack temperature variations under different ambient temperatures. The curve indicates that higher ambient temperatures result in faster reactors reaching the target temperature. Significant differences were observed before 800 s, as highlighted in Figure 10B. The lower temperature curves exhibit smaller oscillations. Our study found a notable similarity between stack inlet temperature and stack temperature performance, which is shown in Figures 10C,D.
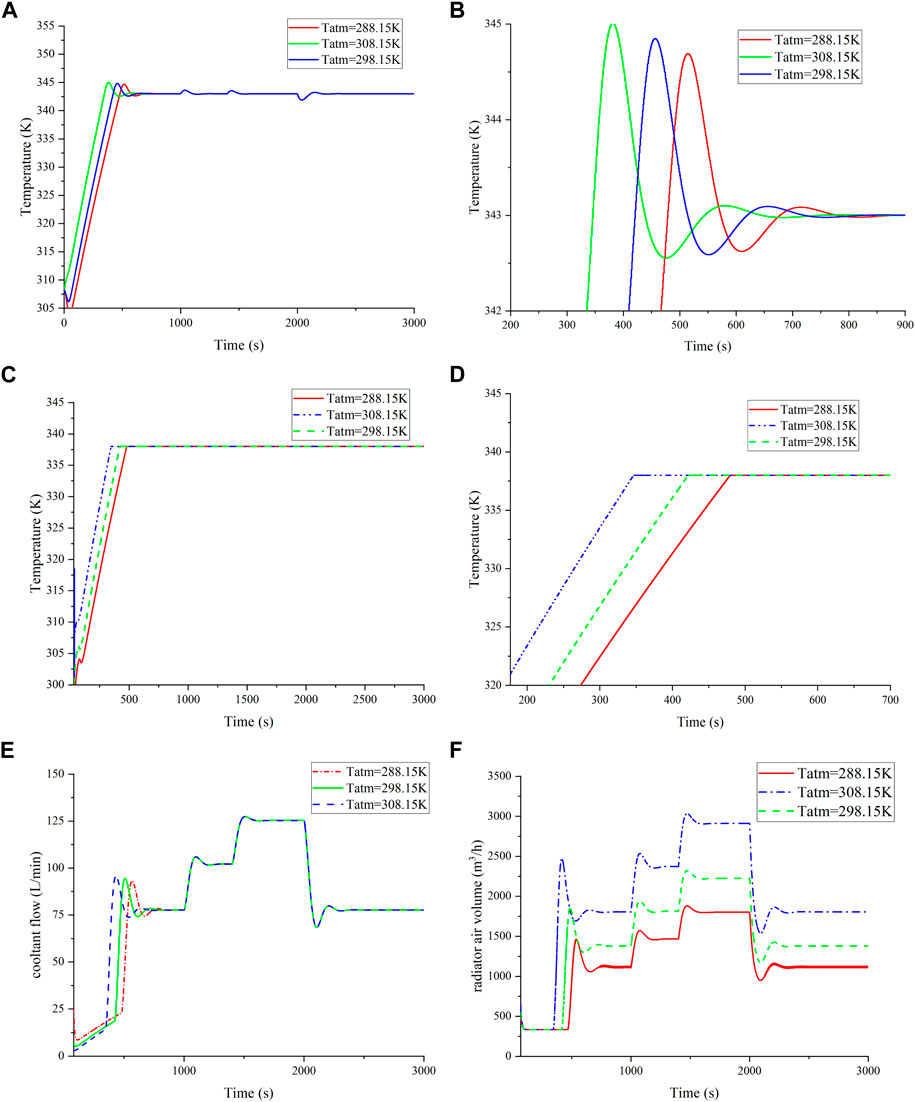
FIGURE 10. Verification of the temperature model. (A) Reactor temperature change at different ambient temperatures; (B) local amplification of (A); (C) change of reactor inlet temperature at different ambient temperatures; (D) local amplification of (C); (E) comparison of the coolant flow at different ambient temperatures; and (F) comparison of radiator air volume at different ambient temperatures.
Figure 10E compares cooling air flow rate curves as ambient temperature increases from 288.15 K to 308.15 K. Higher ambient temperatures show increased cooling air flow, compensating for reduced heat exchange with the environment. The MPC controller consistently maintains stack inlet temperature within the target range under diverse ambient temperatures. Figure 10F presents a comparison of coolant flow rate curves, where ambient temperature dictates the required coolant flow for the reactor.
5 Conclusion
An elaboration of the research contributions of this study:
This study proposes the MPC cooperative control strategy and shows the comparison with PID and water pump MPC for the effectiveness of cooperative MPC.
It proposes a collaborative MPC controller strategy for regulating the temperature of PEMFC stacks and compares the impact of this strategy on PEMFC temperature control under various operational conditions with other control strategies.
The conclusion is as follows:
(1) MPC effectively regulates the PEMFC temperature, ensuring coordinated adjustments in coolant flow and cooling fan air volume in response to step load current. The PEMFC temperature promptly stabilizes at the target, with significant improvements in super-harmonic response and stability when compared to alternative controls.
(2) Under uniform load increase, MPC cooperatively controls the PEMFC temperature, showing reduced overshoot and stabilization time when compared to other controls. MPC ensures precise temperature control, limiting stack variations to 0.2 K.
(3) Implementing co-control in MPC for variable target PEMFC stack temperature. Despite stepped load current, effective adjustment of reactor temperature and accurate control of maximum stack temperature within 1.5 K are achieved.
(4) MPC co-control consistently manages fuel cell stack temperature amidst varying ambient temperatures (288.15 K–308.15 K). It adeptly adjusts cooling parameters, ensuring stability and demonstrating efficacy for optimal temperature management in diverse environmental conditions.
Data availability statement
The original contributions presented in the study are included in the article/Supplementary Material; further inquiries can be directed to the corresponding author.
Author contributions
LL: Conceptualization, methodology, validation, and manuscript writing–review and editing. MZ: Manuscript writing–original draft. JG: Investigation, software, and manuscript writing–review and editing.
Funding
The authors declare financial support was received for the research, authorship, and/or publication of this article. This research was funded by the Basic Science Research Project of Colleges and Universities of Education Department of Liaoning Province (Project No. LJKZ0608).
Conflict of interest
The authors declare that the research was conducted in the absence of any commercial or financial relationships that could be construed as a potential conflict of interest.
Publisher’s note
All claims expressed in this article are solely those of the authors and do not necessarily represent those of their affiliated organizations, or those of the publisher, editors, and reviewers. Any product that may be evaluated in this article, or claim that may be made by its manufacturer, is not guaranteed or endorsed by the publisher.
References
Bressel, M., Hilairet, M., HisselHautes, D. É., Ingénieur, D'., and Belkacem, O. B. (2020). Model-based aging tolerant control with power loss prediction of Proton Exchange Membrane Fuel Cell. Int. J. Hydrogen Energy 19, 11242–11254. doi:10.1016/j.ijhydene.2018.11.219
Chao, C. L. (2020). Numerical simulation of multiphase flow on temperature effect for proton exchange membrane fuel cell. Solid State Phenom. 311, 56–63. doi:10.4028/www.scientific.net/SSP.311.56
Chatrattanawet, N., Hakhen, T., Kheawhom, S., and Arpornwichanop, A. (2017). Control structure design and robust model predictive control for controlling a proton exchange membrane fuel cell. J. Clean. Production 947, 934–947. doi:10.1016/j.jclepro.2017.02.033
Chi-Young, J., Hyo-Sub, S., Sang-Man, K., Sang-Hwan, L., and Yi, S.-C. (2012). Investigations of the temperature distribution in proton exchange membrane fuel cells. Appl. Energy 741. doi:10.1016/j.apenergy.2011.08.035
Dawn, M. B., and Mark, W. V. (2010). Mathematical model of a gas diffusion electrode bonded to a polymer electrolyte. AIChE J. 37, 8. doi:10.1002/aic.690370805
Ebrahimi, S., DeVaal, J., Narimani, M., and Vijayaraghavan, K. (2017). Transient model of oxygen-starved proton exchange membrane fuel cell for predicting voltages and hydrogen emissions. Int. J. Hydrogen Energy 42 (33), 21177–21190. doi:10.1016/j.ijhydene.2017.05.209
Fan, L., Zhang, J., and Li, C. (2013). Model predictive control on constant voltage output of a proton exchange membrane fuel cell. J. Eng. Sci. Technol. Rev. 6 (2), 115–119. doi:10.25103/jestr.062.24
Guo, S. (2020). Study on the thermal management system of proton exchange membrane fuel cell (Hefei: Hefei University of Technology). MA thesis.
Han, J., Park, J., and Yu, S. (2015). Control strategy of cooling system for the optimization of parasitic power of automotive fuel cell system. Int. J. Hydrogen Energy 39, 13549–13557. doi:10.1016/j.ijhydene.2015.08.067
Huang, L., Chen, J., Liu, Z., and Becherif, M. (2018). Adaptive thermal control for PEMFC systems with guaranteed performance. Int. J. Hydrogen Energy 43 (25), 11550–11558. doi:10.1016/j.ijhydene.2017.12.121
Khan, M. J., and Iqbal, M. T. (2005). Modeling and analysis of electrochemical, thermal, and reactant flow dynamics for a PEM fuel cell system. Fuel Cells 4, 463–475. doi:10.1002/fuce.200400072
Lechartier, E., Laffly, E., PéraGouriveau, M. R., Hissel, D., and Zerhouni, N. (2015). Proton exchange membrane fuel cell behavioral model suitable for prognostics. Int. J. Hydrogen Energy 40 (26), 8384–8397. doi:10.1016/j.ijhydene.2015.04.099
Mogorosi, K., Tunde, O. M., and Rakgati, E. (2020). Mathematical modelling and experimental investigation of a low temperature proton exchange membrane fuel cell. Energy Power Eng. 11, 653–670. doi:10.4236/epe.2020.1211039
Oh, S., Sun, J., Dobbs, H., and King, J. (2014). Model predictive control for power and thermal management of an integrated solid oxide fuel cell and turbocharger system. IEEE Trans. control Syst. Technol. A Publ. IEEE Control Syst. Soc. 22 (3), 911–920. doi:10.1109/tcst.2013.2271902
Omran, A., Lucchesi, A., Smith, D., Alaswad, A., Amiri, A., Wilberforce, T., et al. (2021). Mathematical model of a proton-exchange membrane (PEM) fuel cell. Int. J. Thermofluids(prepublish) 11, 100110–110. doi:10.1016/J.IJFT.2021.100110
Robin, C., Gérard, M., Quinaud, M., Arbigny, Y. B., and Bultel, Y. (2016). Proton exchange membrane fuel cell model for aging predictions: simulated equivalent active surface area loss and comparisons with durability tests. J. Power Sources 427, 417–427. doi:10.1016/j.jpowsour.2016.07.018
Rui, D., Ran, W., YiqinWenjuan, D. Y., Yide, L., Jia, L., et al. (2020). Designing AI-aided analysis and prediction models for nonprecious metal electrocatalyst-based proton exchange membrane fuel cells. Angewandte Chemie Int. ed. Engl. 59 (43), 19175–19183. doi:10.1002/anie.202006928
Salva, A. J., Alfredo, I., Felipe, R., and Elvira, T. (2016). Experimental validation of the polarization curve and the temperature distribution in a PEMFC stack using a one dimensional analytical model. Int. J. Hydrogen Energy 45, 20615–20632. doi:10.1016/j.ijhydene.2016.09.152
Sedighizadeh, M., and Fathian, K. (2012). Dynamic modeling and adaptive control of voltage in proton exchange membrane fuel cell using water management. Int. J. Energy Res. 36 (13), 1201–1214. doi:10.1002/er.1868
Shaker, H. (2010). Analytical modeling of PEM fuel cell i—V curve. Renew. energy 36(2), 451–458. doi:10.1016/j.renene.2010.07.007
Sonia, S., Belinda, M., and Fred, M. (2023). Applications and challenges of proton exchange membrane fuel cells. J. Energy Sci. 6. doi:10.53469/JES.2023.05(06).03
Wang, Y., Ou, K., and Kim, Y. (2017). Power source protection method for hybrid polymer electrolyte membrane fuel cell/lithium-ion battery system. Renew. Energy 111, 381–391. doi:10.1016/j.renene.2017.03.088
Wang, Y., Yu, D., and ChenKim, S. Y. (2014). Robust DC/DC converter control for polymer electrolyte membrane fuel cell application. J. Power Sources 305, 292–305. doi:10.1016/j.jpowsour.2014.03.048
Zhang, P., and Yu, T. (2009). MPC control of the proton exchange membrane fuel cell temperature. J. Syst. Simul. 21, 1305–1309. + 1313. doi:10.16182/j.cnki.joss.2009.05.004
Keywords: fuel cell, dual MPC strategy, temperature management, model predictive control, proportional–integral–derivative control, robustness
Citation: Liu L, Zhang M and Gong J (2024) Enhancing fuel cell performance through a dual MPC strategy for coordinated temperature management. Front. Energy Res. 12:1358468. doi: 10.3389/fenrg.2024.1358468
Received: 19 December 2023; Accepted: 18 January 2024;
Published: 05 February 2024.
Edited by:
Zhengmao Li, Aalto University, FinlandReviewed by:
Suhan Zhang, Hong Kong Polytechnic University, Hong Kong SAR, ChinaYunqi Wang, Monash University, Australia
Copyright © 2024 Liu, Zhang and Gong. This is an open-access article distributed under the terms of the Creative Commons Attribution License (CC BY). The use, distribution or reproduction in other forums is permitted, provided the original author(s) and the copyright owner(s) are credited and that the original publication in this journal is cited, in accordance with accepted academic practice. No use, distribution or reproduction is permitted which does not comply with these terms.
*Correspondence: Lidong Liu, NDUyMzA5Mjk0QHFxLmNvbQ==