 Qiang Ma1
 Zitong Liu
- 1Economic and Technical Research Institute of State Grid Liaoning Electric Power Co Ltd., Shenyang, Liaoning, China
- 2National Engineering Research Center for REPM Electrical Machines, Shenyang University of Technology, Shenyang, Liaoning, China
- 3Chaoyang Zheng Da Electric Power Construction Co Ltd., Chaoyang, Liaoning, China
As the “blood vessels” and “nerves” of the power grid, cables are important carriers for transmitting electric energy, and their failures will affect the safe and stable operation of the power grid. In this paper, a digital twin model of thermal characteristics is constructed for 10 kV YJV×400 cluster cable and its joint model. Based on the multi-physical field coupling analysis method, the fluid field, temperature field and current-carrying capacity of the cluster cable are analyzed. The temperature rise and airflow distribution characteristics of the joint and its external insulation when the defect of joint false connection occurs are analyzed. Based on the fuzzy analytic hierarchy process (FAHP), weights are assigned to the locations of multiple measurement points of the cable external insulation, and the temperature distribution of each measurement point is combined with the digital twin technology to calculate the hot spot temperature of the cable, so as to assess the defects of the joints of the cables. The digital twin platform is used for real-time monitoring of cable status and assessment of defects. The temperature rise experiments of cables under different carrying capacity and joint defects show that this method can accurately and efficiently calculate hot spot temperatures and assess defects of joints in cluster cables.
1 Introduction
Power cables are widely used in the line construction of power grid systems (Zhou et al., 2014; Xiuchen et al., 2022). According to the analysis of accidents in recent years, more than 90% of operational faults occur in the joint parts of cables (Zeziani et al., 2017; Xu et al., 2019; Zheng et al., 2019). At the same time, cable joints are located in unfavorable locations for heat dissipation, which may lead to temperature rise exceeding the limit and shorten its expected service life when the joints fail. Therefore, analyzing the temperature rise and airflow distribution characteristics of cable joints and their outer insulation under different current-carrying conditions and virtual connection states can provide a theoretical basis for digital monitoring of power cable operation status (Ohki et al., 2013; Xiong et al., 2019; Brakelmann and Anders, 2022; Long et al., 2023).
Computer simulation calculation methods are widely used to analyze the current-carrying capacity and temperature field analysis of cables in different environments. Researchers have used the equivalent coefficient method, two-dimensional simplification method and other methods to establish the cable temperature calculation model and analyze the cable temperature under a variety of current-carrying conditions (Lee et al., 2016; Meng et al., 2016; Zhou et al., 2018; Liu et al., 2020). It can be found that most of the existing research on the reduced dimensional analysis as well as experimental tests, based on multi-physical field coupling three-dimensional analysis of the research is rare. Three-dimensional analysis model can be more conducive to the electromagnetic field and other multi-field coupling analytical calculations and analysis (Zhu et al., 2023).
Cables are affected by stress, temperature and humidity during actual operation, which can easily lead to their failure. Researchers have used methods such as Fourier transform algorithm or frequency domain reflection method to diagnose and localize cable faults (Ohki et al., 2013; Yang et al., 2013; Rong et al., 2021). It can be found that the current research rarely involves the location of cable joints, and there is almost no diagnosis and analysis about the defects of cable joints with false connections (Zhang et al., 2019).
To analyze the temperature characteristics of cluster cables and assess the defects of the cable joints, this paper establishes a digital twin model of cluster cables and cable thermal characteristics based on the multi-physical field coupling analysis method for a single-core, four-circuit cluster cable with a model of 10 kV YJV×400. The temperature rise and airflow distribution characteristics of the joints and their external insulations were analyzed under different degrees of virtual connection and current-carrying conditions (Bang and Shin, 2021; Bragatto et al., 2023). The weights of the external insulation measurement points of the cable are assigned by FAHP, and the hot spot temperatures of the cable are deduced by combining the digital twin technology and the simulation results to analyze and evaluate the defects of the cable joints with false connections.
2 Multi-physical field coupling and FAHP theoretical analysis
The current-carrying capacity and hot spot temperature of cluster cables are investigated based on a electromagnetic-fluid-thermal multi-physical coupled field analysis. The load current in the cable conductor causes the temperature of the cable itself and the surrounding air to increase, which in turn affects the fluid field distribution around the cable. And the change in air flow rate affects the heat dissipation, which in turn affects the temperature field distribution. The resistivity of the cable is greatly affected by the increase in air temperature, which further affects the current-carrying capacity. This cyclic influence eventually converges to a dynamic equilibrium. The coupling relationship between the multi-physical fields of cluster cables is shown in Figure 1.
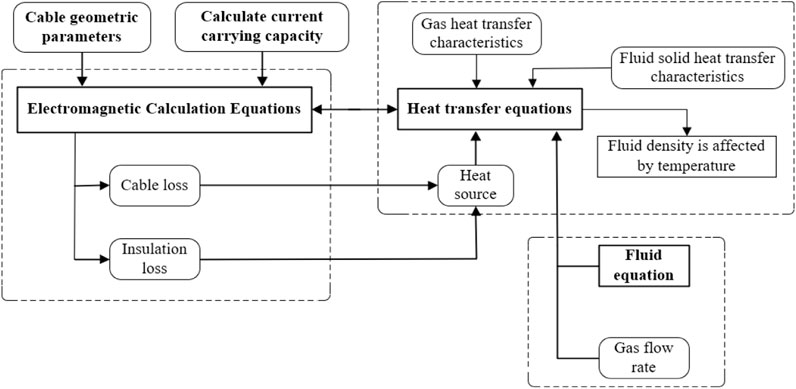
FIGURE 1. Electromagnetic-fluid-thermal multi-physical field coupling diagram.
2.1 Multi-physical field coupling analysis
In the electromagnetic loss of the cluster cable, taking the electromagnetic loss generated by the load current in the cable conductor as the heat source, it is concluded that:
Where,
By ignoring the time term, the heat conduction equation of the temperature field in the cable trench region is simplified. The governing equation of heat conduction of three-dimensional steady state isotropic medium with internal heat source is selected. In Cartesian coordinate system, the equation is written as follows:
Where,
The flow of air in the cable trench area can be expressed by a general governing equation, as follows:
Where,
The direct coupling method is used to calculate the temperature field of the cluster cable, and the coupling surface between the body and the body is iteratively calculated by coupling boundary.
In the air fluid domain of a single channel cluster cable, the energy transport equation is used to control the heat transfer of air. The energy conservation equation is as follows:
Where,
In the actual operation of the cable, the conductivity of the cable conductor is not constant, but is affected by the surrounding temperature. The relationship between the conductivity and the temperature function (Lee et al., 2016) is shown in Formula Eq. 6.
Where,
2.2 Multi-physical field coupling calculation flow
The temperature field and fluid field of the cluster cable were calculated and analyzed according to the multi-physical field coupling method. The flow chart of multi-physical field coupling simulation calculation is shown in Figure 2.
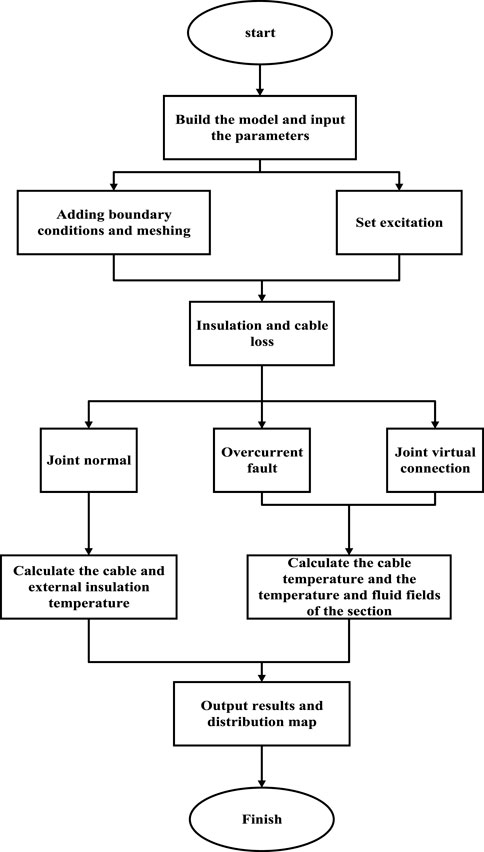
FIGURE 2. Flowchart of multi-physical field coupling modeling and calculation.
2.3 Fuzzy analytic hierarchy process
Weights are the redistribution and reassignment of assessment objects according to the target requirements, which can effectively reduce the proportion of bad points affecting the assessment accuracy. Fuzzy analytic hierarchy process (FAHP) is to form a fuzzy judgment matrix by two-by-two comparison between elements under the requirement index according to the differences of the objects to be assessed, and to determine the weight assignment of each element by calculation. The fuzzy judgment matrix R is as follows:
Where
3 Cluster cable finite element simulation analysis
3.1 Simulation analysis of current carrying capacity
This paper takes 10 kV YJV×400 single-core four-circuit cluster cable as the research object, and its basic parameters are shown in Table 1.
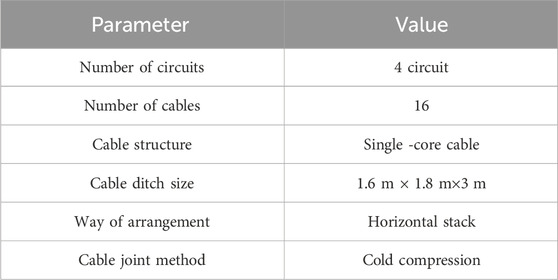
TABLE 1. Cable trench basic parameters table.
A three-dimensional computational model of the cable was created based on the physical parameters of the entity, which includes the cable conductors, external insulation, joints and air. The cooling system in the cable trench area is a closed air domain heat sink. There are six walls in total, each of which is a sliding solid wall with a constant temperature of 20°C. The specific structure of the solution domain is shown in Figure 3.
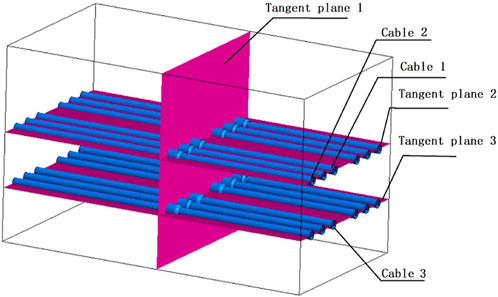
FIGURE 3. Three-dimensional calculation model and solution domain.
According to the IEC 60287 standard, the load current is defined as the maximum load current when the hot spot temperature of the middle joint of the cable reaches exactly 363.15K (60°C) After iteration calculation, the load current of the cable at this time is 700A, and the temperature field distribution of the single-core cluster cable is shown in Figure 4. Simulation results show that when the hot spot temperature of the conductor inside the cable intermediate joint reaches 363.15K (60°C), the temperature of the cable conductor 1.5 m outside the intermediate joint is 348.65K (75.5°C). Therefore, the project is generally used in the cable intermediate joints of the maximum load capacity as the cable line load capacity. At this point, a temperature gradient appears in the cable, which can lead to cable aging and a decrease in the insulation performance of the cable material.
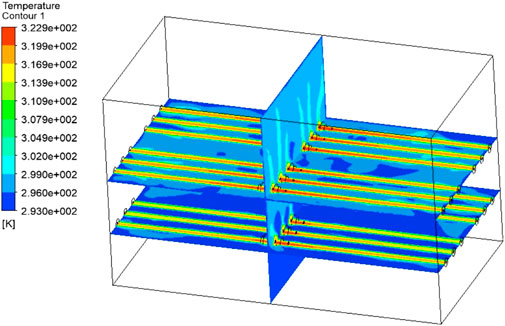
FIGURE 4. Temperature field of single-core cluster cable.
Calculate and analyze the temperature and airflow distribution of the cluster cables in the cable trench under the four cases of load current of 500A, 600A, 700A and 800A respectively, the hot spot temperature of the cables in the cable trench and the maximum flow rate of the air are shown in Figure 5, and it can be seen that there is a large temperature difference between the air in the cable trench when the load current is 500A, and therefore the air flow rate is the largest. When the load current is 800A, the hot spot temperature has exceeded 110°C, exceeding the standard.
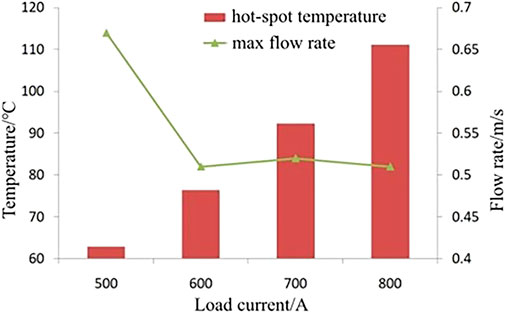
FIGURE 5. Hot spot temperature and maximum flow rate under different loads.
3.2 Temperature and fluid field analysis under joints virtual connection defect
When the cable load current is 500A, the temperature field and fluid field of section 1 under different connector false connection conditions are shown in Figure 6. It can be seen that the temperature of the two cables in the middle of the upper part of the cable trench is the highest, about 336.05K (62.9 °C), when there is no false connection condition of the cable joints. Along the cable axial height and downward, the temperature in the middle outward basically shows a decreasing trend. The air flow velocity at the two side walls of the cable trench is larger, about 0.67 m/s. From the fluid field diagram, it can be seen that the air flow velocity in the area near the cable is also larger than that in the cavity.
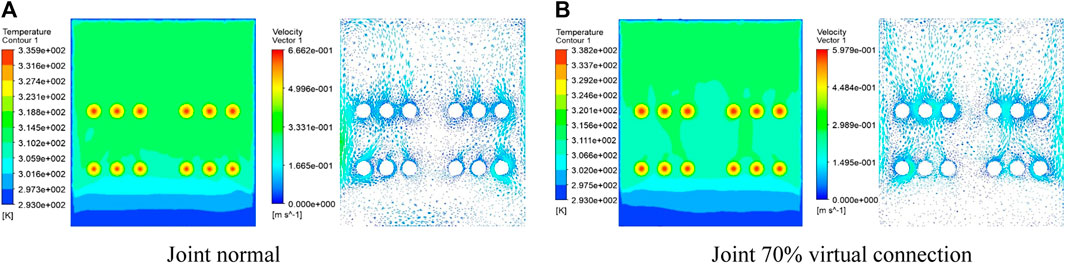
FIGURE 6. The temperature and fluid fields of section 1 under different joint states. (A) Joint normal and (B) Joint 70% virtual connection.
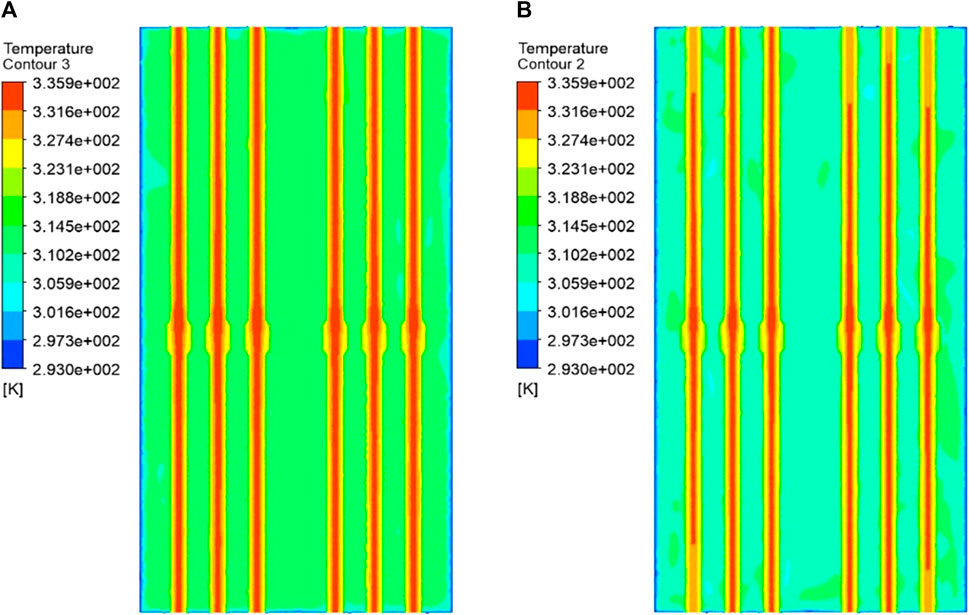
When the cable joints are in 70% defective connection, it can be seen that the temperature of the cables increased by 275.45K (2.3°C). The trends of temperature and flow distribution are the same as in the absence of defects. The temperature fields of sections 2 and 3 in the normal state are shown in Figure 7. It is clear from the figure that the temperature of the cable in section 2 is higher than that in section 3, and the temperature of these two sections of the cable decreases from the center to the ends. section 2 is more prone to overheating failures and has relatively poor insulation compared to section 3.
In this paper, the temperature and airflow distributions of cluster cables are calculated and analyzed for five levels of virtual connections: 70%, 75%, 80%, 85%, and 90% of the cable joints. The hot spot temperature of the cable joints, the surface temperature of the outer insulation of the cable joints, and the axial temperature distribution under different degrees of false connection are observed. As shown in Figure 8, the hot spot temperature of the cable joint increases with the decrease of the contact area of the cable joint, and the outer insulation temperature is about 0.85 times of the hot spot temperature. When the joint is 90% false, the hot spot temperature is the highest, increasing by 35.3%. The axial temperature distribution curve of cable 1 is in an inverted “V" shape, with the highest temperature at the location of the middle joint and little change in the temperature at the cable end. The curve becomes sharper as the quality of the joint connection decreases.
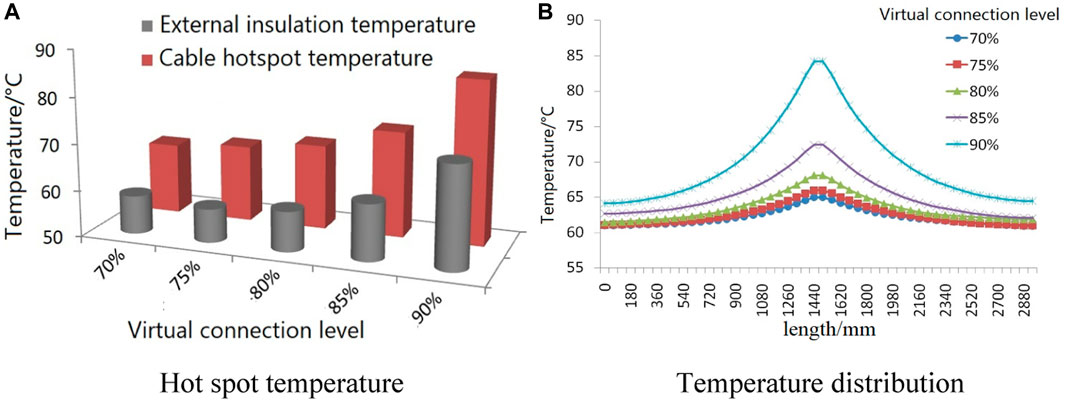
FIGURE 8. Hot spot temperature and temperature distribution under different connection qualities.
4 Cluster cable virtual connection defect assessment
4.1 Experimental temperature acquisition and digital twin analysis platform
Based on the 10 kV YJV×400 single-core cluster cable, an experimental platform for temperature acquisition of cable joints under simulated actual operating conditions and a digital twin analysis platform are designed as application systems. The temperature acquisition and digital twin analysis platform is shown in Figure 9.

FIGURE 9. Experimental temperature acquisition platform and digital twin analysis platform.
In order to real-time monitoring of cluster cable operation status, to provide fault diagnosis and predictive maintenance and other functions, the cable temperature collection experiment consists of cable units, transformers, current transformers, electrical cabinets and temperature sensors, the experiment can be realized in the boosting, adding current, more realistically simulate the actual operation of the cluster cable. The digital twin analysis platform of cluster cable is based on the temperature acquisition platform for real-time data interaction, which can visualize the cable operating environment data, sensor measurement temperature, hot spot temperature derivation calculation, comparison of measured values and simulation, and evaluation results.
4.2 Cable joints virtual connection defect evaluation and analysis
In the complex engineering environment of cluster cables, it is difficult to obtain accurate surface hot spot temperatures at cable joints due to uncertainties in the ambient temperature inside the pipe and the location of temperature measurement sensors. In this paper, the joints of cable 1 are taken as an example, and electromagnetic-fluid-thermal multi-physical field coupling is utilized to analyze the joints of cluster cables in 70%, 75%, 80%, 85% and 90% of the virtual connection cases, and the cables in the 500, 600, 700 and 800A loading capacity cases, respectively. Five measurement points were selected on the outside of the cable, and the temperature sensor was used to collect the temperature of each measurement point on the surface of the joint. The calculation procedure is as follows:
1. Joint temperature measurement points. The T-joint of the cable is divided into five temperature measurement points, including 1 and 2 at the end of the joint, 3 in the middle of the joint, 4 and 5 at the end of the joint, and two measurement points are set in each joint, as shown in Figure 10.
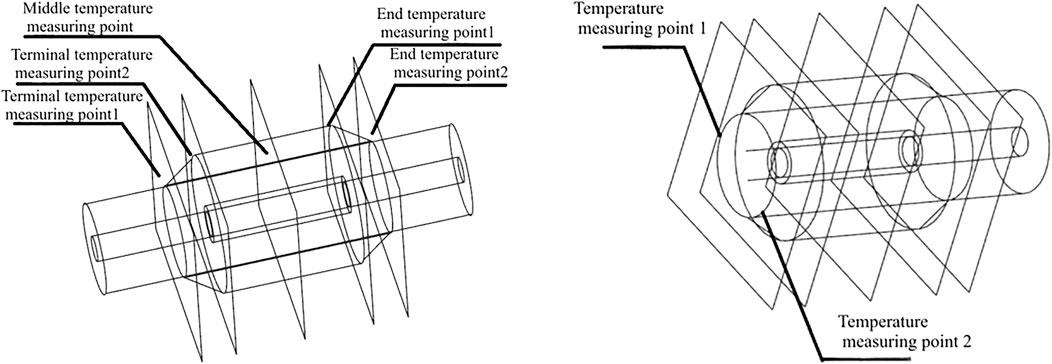
FIGURE 10. Joint temperature measuring part and temperature measuring point distribution.
The measured temperature matrix
2. According to the temperature measured at each temperature measurement point, the corresponding hot spot temperature can be deduced. According to the average temperature measured at two temperature measurement points in each temperature measurement section, and the ratio coefficient ki between the temperature measured at each temperature measurement point and the hot spot temperature, the hot spot temperature Ti of the intermediate connector deduced from each temperature measurement point is calculated by the digital twin platform as follows:
3. Weighting coefficient assignment. According to the location of the temperature measurement part, the distance from the intermediate joint and the degree of influence on the location of each measurement point when the hot spot temperature of the cable intermediate joint changes, a fuzzy judgment matrix is established based on FAHP, and the correlation between the location of each measurement point and the location of the intermediate joint is judged as shown in Figure 11 below.
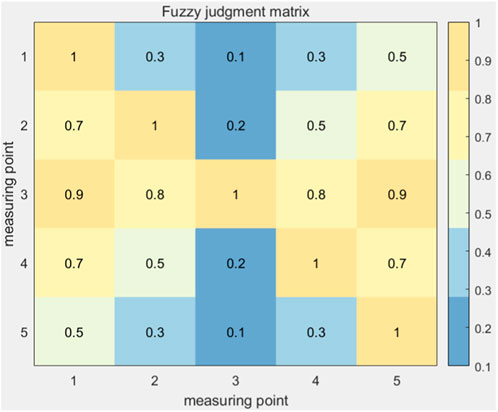
FIGURE 11. Fuzzy judgment matrix.
The weights for the five thermometric components were calculated as follows:
4. Calculate the hot spot temperature on the joint surface by deduction. According to the calculated fuzzy weights, the hot spot temperature calculation model of the joint is established in the digital twin platform of the cluster cable, and the hot spot temperature Th of the intermediate joint is weighted by the hot spot temperature obtained by extrapolation from each measurement point. The calculation formula is as follows:
The hot spot temperature of the cable joint can be deduced by measuring and calculating the temperature under different current-carrying conditions and different degrees of joint misconnection. By comparing the results with the simulation results, the calculation results and accuracy of the surface hotspot can be derived when the cable current-carrying capacity and the degree of joint false connection change, as shown in Table 2 and Table 3 below.

TABLE 2. Calculation result of hot spot temperature on the surface of the cable when carrying current changes.
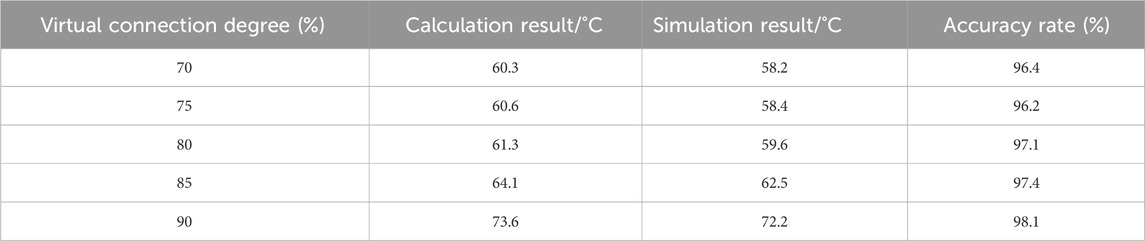
TABLE 3. Calculation result of surface hot spot temperature when the joint virtual connection status changes.
Table 3 shows the results of calculating the hot spot temperature of the cable joints when the cable current carrying capacity is fixed at 500A and the degree of joint misconnection is varied.
According to Tables 2 and 3, it can be seen that the average assessment accuracy is 96.275% under different current-carrying conditions when evaluating the defects of cable joints with false connections based on multi-physical field simulation combined with digital twin technology and fuzzy weights to derive the hot spot temperature. When the degree of cable joint virtual connection varies, the average accuracy of deducing the hot spot temperature of the cable is 97.04%. The hot spot temperatures of cables under different operating conditions can be accurately deduced, thus combining the digital twin platform and the thermal characteristics of cables to provide temperature characteristics for the assessment of defects in cluster cables with false connections. When a cable overheats, heat is dissipated through the air. When the system detects a cable overheating fault, an alarm sounds and the faulty cable can then be repaired and replaced.
Through the experiment, the cable temperature under different cable operating conditions can be measured, at this time, the ambient temperature of the test site is 17.6°C, the initial measurement of the power cable joint temperature is 59.8°C, and the simulation extrapolates and calculates the temperature of the cable joints as 62.9°C, with an error of 5.18%. In the case of constantly changing the cable current-carrying capacity and the degree of false connection of the cable joints, the temperature rise of the cable in different states is measured at 10 measurement points. Repeatedly collect 100 groups of cable temperature rise data as test samples, through the digital twin platform to randomly disrupt the 50 groups of test samples corresponding to the temperature of the measurement point and the degree of false connection for the deduction of diagnosis, and compared with the experimental temperature measurement results as shown in Figure 12.
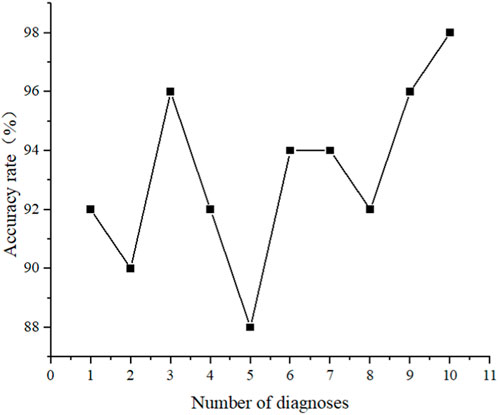
FIGURE 12. Diagnostic accuracy of cable temperature rise samples.
As can be seen from the figure, the lowest accuracy rate of the randomly disrupted 50 groups of test samples with different operating states diagnosed by the cluster cable digital twin platform for 10 extrapolations reaches 88%, and the average diagnostic accuracy rate of the experimental samples reaches 93.2%, which proves that the cable joints false connection defect assessment technique based on fuzzy weight and digital twin technology proposed in this paper can accurately and effectively assess the different false connection of the cable defect status.
5 Conclusion
In this paper, for the single-core four-loop cluster cable with the model of 10 kV YJV×400, based on the assessment method of cable joint virtual connection defects based on the multi-physical field coupling analysis and fuzzy weight combined with the digital twin technology, the hot spot temperature of the cable and the airflow distribution are calculated and analyzed and the joint virtual connection defects are deduced and evaluated, and the following conclusions are drawn:
(1) In this paper, through iterative analysis, the maximum load current of single-core cluster cable structure is 700 A. When the load current of the cable is 500 A, the temperature of the middle two cables in the upper part of the cable trench is the highest, which is about 62.9°C, and meanwhile, the temperature of the cable joints is measured experimentally to be 59.8°C, with an error of 5.18%. The maximum wind speed on both sides of the cable is about 0.67 m/s. When the load current is 800A, the hot spot temperature reaches 110°C, which exceeds the standard requirement. After simulation analysis, real-time observation is required when the cable load current exceeds 700A.
(2) When the cable joint is at 70% of the degree of false connection, the temperature of a single cable rises 2.3°C, the distribution of temperature and fluid field trend is the same as when there is no defect, the temperature distribution from the center to the ends and axial height decreases. As the contact area of the cable joint decreases, the hot spot temperature of the cable rises gradually, the outer insulation temperature is about 0.85 times of the hot spot temperature, and when the degree of defective connection reaches 90%, the hot spot temperature rises by 35.3%. Cable axial temperature distribution curve is inverted “V” shape.
(3) In different load capacity and joint false connection state, the same cable temperature measurement experiment, through the experimental results and simulation calculation analysis can be obtained, based on the fuzzy weight combined with the method of digital twinning technology when the hot spot temperature is deduced. When the cable load flow changes, the average accuracy of the hot spot temperature deduction on the surface of the cable can reach 96.275%; when the load flow is fixed at 500A, change the degree of the cable connector false connection, the average accuracy of the hot spot temperature deduction on the surface of the cable can reach 97.04%. The hot spot temperature of the cable under different operating conditions can be accurately deduced, providing temperature characteristics for subsequent thermal fault diagnosis of cluster cables.
(4) Based on the data from the temperature measurement experiments, the method based on fuzzy weight assignment combined with the digital twin platform is used to deduce the diagnosis of the samples and compared with the experimental results. It can be obtained that the average accuracy of this method for diagnosis of randomly disrupted multi-group experimental samples reaches 93.2%, which can accurately and efficiently assess the cluster cable joint virtual connection defects.
The computational and analytical results of this paper can be used to monitor the operation status of cables and assess the defects of false connection by the outer insulation temperature, which provides a theoretical basis for the real-time monitoring of power cables.
Data availability statement
The original contributions presented in the study are included in the article/Supplementary Material, further inquiries can be directed to the corresponding author.
Author contributions
QM: Project administration, Writing–original draft. YaL: Writing–review and editing. ZL: Visualization, Writing–original draft, Writing–review and editing. WL: Writing–review and editing. DL: Conceptualization, Writing–review and editing. RL: Writing–review and editing. YJ: Methodology, Supervision, Writing–original draft, Writing–review and editing.
Funding
The author(s) declare that no financial support was received for the research, authorship, and/or publication of this article.
Conflict of interest
Authors QM, YL, DL, and RL were employed by Economic and Technical Research Institute of State Grid Liaoning Electric Power Co Ltd. Author WL was employed by Chaoyang Zheng Da Electric Power Construction Co Ltd.
The remaining authors declare that the research was conducted in the absence of any commercial or financial relationships that could be construed as a potential conflict of interest.
Publisher’s note
All claims expressed in this article are solely those of the authors and do not necessarily represent those of their affiliated organizations, or those of the publisher, the editors and the reviewers. Any product that may be evaluated in this article, or claim that may be made by its manufacturer, is not guaranteed or endorsed by the publisher.
References
Bang, S. S., and Shin, Y.-J. (2021). Abnormality monitoring for three-phase HTS cable via time-frequency domain reflectometry. IEEE Trans. Appl. Supercond. 31 (5), 1–6. doi:10.1109/tasc.2021.3060364
Bragatto, T., Cresta, M., Gatta, F. M., Geri, A., Maccioni, M., and Paulucci, M. (2023). Assessing thermal behavior of medium voltage cable joints through simulations and measurements. IEEE Trans. Industry Appl. 59 (5), 5705–5714. doi:10.1109/tia.2023.3284413
Brakelmann, H., and Anders, G. J. (2022). Analysis of the three-dimensional temperature distribution of forced cooled power cables. IEEE Trans. Power Deliv. 37 (2), 736–744. doi:10.1109/tpwrd.2021.3069760
Liu, L., Xu, Z., Wang, P., Huang, S., He, D., Huang, Z., et al. (2020). Temperature field distribution and ampacity calculation of double-channel four-circuit cables based on multi-field coupling of electromagnetic- thermal-fluid. J. South China Univ. Technol. Nat. Sci. Ed. 48 (12), 10–17. (in Chinese). doi:10.12141/j.issn.1000-565X.200194
Lee, G. S., Kwon, G. Y., Bang, S. S., Lee, Y. H., Chang, S. J., Sohn, S. H., et al. (2016). Time–frequency-based insulation diagnostic technique of high-temperature superconducting cable systems. IEEE Trans. Appl. Supercond. 26 (4), 1–5. doi:10.1109/tasc.2016.2524520
Long, J., Chen, G., Wang, Z., Zhang, A., Zhou, Y., Li, X., et al. (2023). Finite element model for temperature distribution calculation of HTS cable based on experiment data. IEEE Trans. Appl. Supercond. 33 (8), 1–10. doi:10.1109/tasc.2023.3306205
Meng, X.-K., Wang, Z.-Q., and Li, G.-F. (2016). Dynamic analysis of core temperature of low-voltage power cable based on thermal conductivity. Can. J. Electr. Comput. Eng. 39 (1), 59–65. doi:10.1109/cjece.2015.2496205
Ohki, Y., Yamada, T., and Hirai, N. (2013). Precise location of the excessive temperature points in polymer insulated cables. IEEE Trans. Dielectr. Electr. Insulation 20 (6), 2099–2106. doi:10.1109/tdei.2013.6678858
Rong, L. I., Zhou, K., Wan, H., et al. (2021). Moisture location of 10kV cable joints in medium voltage distribution grid based on frequency domain reflection. Power Syst. Technol. 45 (2), 825–831. doi:10.13335/j.1000-3673.pst.2019.1948
Xiong, L., Chen, Y., Jiao, Y., Wang, J., and Hu, X. (2019). Study on the effect of cable group laying mode on temperature field distribution and cable ampacity. Energies 12 (17), 3397. doi:10.3390/en12173397
Xiuchen, J., Yongpeng, X., Yaocheng, L., Lingfang, D., Yadong, L., Gehao, S., et al. (2022). Digitalization transformation of power transmission and transformation under the background of new power system. High. Volt. Eng. 48 (1), 1–10. (in Chinese). doi:10.13336/j.1003-6520.hve.20211649
Xu, T., Xu, Z., Xu, Y., Wang, P., Liu, Y., Liu, G., et al. (2019). High voltage cable conductor temperature prediction based on historical measured data. Guangdong Electr. Power 32 (4), 98–105. (in Chinese). doi:10.3969/j.issn.1007-290X.2019.004.014
Yang, Y., Cheng, P., Chen, J., Yang, F., et al. (2013). Current-carrying capacity calculation based on coupling fields for cable in ventilated trench and its influencing factors. Electr. Power Autom. Equip. 33 (7), 139–143. doi:10.3969/j.issn.1006-6047.2013.07.024
Zeziani, M., Mekhaldi, A., and Teguar, M. (2017). Effect of space charge layers on the electric field enhancement at the physical interfaces in power cable insulation. IEEE Trans. Dielectr. Electr. Insulation 23 (6), 3725–3733. doi:10.1109/TDEI.2016.005931
Zhang, W., Wei, H., and Zhang, L. (2019). Distributed fault location scheme for 10kV cable network based on traveling wave principle. Shandong Sci. 32 (6), 98–105. doi:10.3976/j.issn.1002-4026.2019.06.014
Zheng, W., Niu, H., Song, T., Wang, X., et al. (2019). Load optimization method of cluster power cables based on thermal field simulation and modified particle swarm algorithm. High. Volt. Eng. 45 (6), 2010–2016. (in Chinese). doi:10.13336/j.1003-6520.hve.20190604042
Zhou, Q., Wang, X., Zhou, F., Zhang, H., Zheng, W., Niu, H., et al. (2018). Correction factor method of calculation on ampacity of 10 kV distribution cable adapting to Guangdong area. Guangdong Electr. Power 31 (2), 125–129. (in Chinese). doi:10.3969/j.issn.1007-290x.2018.002.020
Zhou, Y., Zhao, J., Liu, R., Chen, Z., Zhang, Y., et al. (2014). Key technical analysis and prospect of high voltage and extra-high voltage power cable. High. Volt. Eng. 40 (9), 2593–2612. (in Chinese). doi:10.13336/j.1003-6520.hve.2014.09.001
Keywords: cluster cable, multi-physical field coupling, hot-spot temperature, digital twin technology, thermal characteristics, virtual connection defect assessment
Citation: Ma Q, Liu Y, Liu Z, Li W, Li D, Liu R and Jing Y (2024) Research on multi-physical field analysis and assessment technique of virtual connection defects in cluster cable joints based on digital twin technology. Front. Energy Res. 12:1362361. doi: 10.3389/fenrg.2024.1362361
Received: 28 December 2023; Accepted: 05 February 2024;
Published: 21 February 2024.
Edited by:
George Tsekouras, University of West Attica, GreeceReviewed by:
Yanhui Wei, Qingdao University of Science and Technology, ChinaChuanyu Sun, Harbin Institute of Technology, China
Copyright © 2024 Ma, Liu, Liu, Li, Li, Liu and Jing. This is an open-access article distributed under the terms of the Creative Commons Attribution License (CC BY). The use, distribution or reproduction in other forums is permitted, provided the original author(s) and the copyright owner(s) are credited and that the original publication in this journal is cited, in accordance with accepted academic practice. No use, distribution or reproduction is permitted which does not comply with these terms.
*Correspondence: Zitong Liu, bGl1enQ5NjA2MjVAMTYzLmNvbQ==