 Sheng Zhang
 Jinkun Gao2
 Juan Yu
- 1State Grid Zhejiang Electric Power Co., Ltd., Hangzhou Yuhang District Power Supply Company, Hangzhou, Zhejiang, China
- 2State Key Laboratory of Power Transmission Equipment and System Security and New Technology (Chongqing University), Shapingba DistrictChongqing, China
- 3Hangzhou Electric Power Equipment Manufacturing Co., Ltd., Yuhang Qunli Complete Electric Manufacturing Branch, Hangzhou, Zhejiang, China
In the era of big data, data centers with high energy consumption, interconnectivity, and load flexibility have developed rapidly. However, due to data privacy issues, the traditional power-system operational reliability assessment (ORA) struggles to precisely consider the load flexibility of data centers, leading to inaccurate evaluation. To this end, this article proposes an ORA method considering the load flexibility of data centers via the energy consumption elastic space. By transforming the inner operation constraints of data centers into an equivalent elastic space, the ORA does not require any private data to complete the evaluation. Specifically, the energy consumption model of data centers is established to accurately describe the load flexibility. Then, based on multi-parametric programming techniques, the energy consumption elastic space of data centers is characterized by data centers’ power demand constraints, which do not involve privacy data, and no privacy concerns exist. Finally, the ORA model and the evaluation method based on the energy consumption elastic space can be constructed. With a lot of data center operation constraints being replaced by power demand constraints, the proposed method can complete an evaluation faster without accuracy loss. Its effectiveness is validated through simulations using the IEEE RTS 24-bus system and a provincial 661-bus system.
1 Introduction
With the rapid advancement of technologies such as 5G, the Internet of Things, cloud computing, and artificial intelligence, infrastructure construction in the information industry has escalated year by year, leading to a continuous expansion in the scale of data centers. Until 2021, China’s data center capacity accounted for 15% of the global total (Technavio, 2021), ranking second to the United States. As a high-energy-consuming industry (Dayarathna et al., 2015), the total data center energy consumption in China in 2021 was 225.6 billion kWh, accounting for approximately 2.99% of the total electricity consumption in society. In 2025, the total electricity consumption of data centers in China will escalate to 395.2 billion kWh, accounting for approximately 4.10% of the society’s total electricity consumption.
In data centers, the characteristics of centralized distribution and easy control are inherent (Alaperä et al., 2018) and exhibit notable energy consumption elasticity (Vesa et al., 2020). By leveraging cloud interconnection and data center networks (DCNs), data centers can facilitate an interconnection between each other and transfer the computational loads remotely (Bari et al., 2012). This alters the distribution of computational loads within the power grid, resulting in the formation of a collaborative “data energy” network. It not only regulates the energy consumption of the data centers but also introduces a higher degree of flexibility to the power system’s operation (Wu et al., 2023b). By transferring the computational load of the data center, thereby changing the power loads and alleviating the congestion of related transmission lines during peak hours, it becomes an effective method for improving the overall reliability of the power system (Huang et al., 2023), especially in the context where conventional power sources are being replaced by large-scale renewable energy sources, which would bring about a significant increase in uncertainty in power generation. Making reasonable use of data centers’ flexible load characteristics is an effective approach to leverage demand-side management and address supply–demand conflicts (Vasques et al., 2019). Therefore, considering the load flexibility of data centers is a factor that cannot be overlooked in the impact of power system operational reliability.
However, due to data privacy concerns, the current operational reliability assessment still does not consider the load flexibility of data centers. Existing literature has adequately studied conventional methods for assessing the operational reliability of power systems (Xu et al., 2014; Parvini et al., 2017). They can be divided into two categories: the simulation method that uses a massive number of states and analytical methods based on mathematical derivations (Li, 2014). Among these, typical simulation methods like the Monte Carlo method and analytical methods like the state-space method all depend on high-precision physical models of components or networks to achieve precise assessments of the operational reliability of power systems (Juanwei et al., 2019; Lv et al., 2019). However, the equipment parameters and operational states of data centers that exhibit strong energy consumption flexibility are usually internal data for enterprises. When performing power-system operational reliability assessments, obtaining high-precision models of data centers is challenging. As a result, the existing operational reliability assessments inadequately consider the load flexibility of data centers. It is urgent to break down the information barriers caused by data privacy in data centers and develop a new power system operational reliability assessment method that considers the load flexibility of data centers.
To address the issue of information barriers, existing research mainly includes sensitivity equivalent methods (Dai et al., 2018) and multi-parameter programming methods (Lin et al., 2020). Their essence is to construct an equivalent model or projected equivalent space that reflects the characteristics of systems containing private data. Thus, the private data can be effectively protected. Some studies employ those methods in cross-regional economic dispatch, integrated energy systems, and other fields (Tan et al., 2019; Wu et al., 2023a; Yang et al., 2023). Currently, a substantial amount of literature focuses on data center load flexibility and conducts research on data center micro-grid planning, scheduling, operation, market participation, etc. (Bajracharyay et al., 2016; Yang et al., 2018; Ye and Gao, 2022). However, no literature research has investigated the information barriers resulting from data center privacy issues and their impact on the operational reliability assessment of power systems.
Therefore, to address the information barriers arising from data centers’ privacy concerns, this paper presents an operational reliability assessment method based on the data center energy consumption elastic space. By transforming the inner operation of data centers into the elastic space characterized with data centers’ power demand constraints, the operational reliability assessment considering load flexibility does not require any privacy data of data centers. Hence, it can effectively break the information barrier and deal with the data privacy issue. The contribution of this paper can be summarized as follows: 1) an energy consumption space calculation method based on multi-parametric programming is proposed. It transforms the energy consumption model indicating the load flexibility of data centers into the equivalent constraints of power demands, named as the energy consumption elastic space. Therefore, when implementing operational reliability assessments using the energy consumption elastic space, it can not only consider the load flexibility of data centers but also protect the privacy data of data centers; 2) an operational reliability assessment model and the related evaluation method for power systems based on the energy consumption elastic space are established. It can not only address the privacy issues related to data exchange between data centers and the power grid but can also improve the computational efficiency by reducing the scale of constraints. Eventually, through simulations using the IEEE RTS 24-bus system and a practical 661-bus power system, the effectiveness of the proposed methods is validated.
2 Framework of the proposed method
The data center can achieve power load transfer in the power grid by exchanging the computation loads along different data centers, which shows non-negligible load flexibility. In order to accurately evaluate the operational reliability of the power system, it is very important to consider the flexible resources in the power grid. However, describing the load flexibility of data centers requires private data such as data center IT equipment parameters and air conditioning system parameters. Due to data privacy concerns, the information exchange between the power grid and the data center enterprise is hard to accomplish, and the information barrier exists. Therefore, it is impossible to obtain the privacy data of data centers and further consider the flexibility of the data center in the operational reliability assessment of the power system.
To this end, this paper constructs the energy consumption equivalent space to replace the optimization of data center operation. So the private data of a data center are not required when implementing operational reliability assessment in the power system. This equivalent space is composed of some power-demand constraints in different data centers. As long as the power demands of different data centers are located in the equivalent space, there is an operation strategy of data centers that requires the given power loads. Therefore, after sampling loads of different data centers, the operational reliability assessment can optimize the data center load distribution based on the constraints of equivalent space and, thereby, consider the load flexibility of the data center without any private data. Moreover, due to the different formulations and variables in the energy consumption elastic space and the original energy consumption model, no privacy data of data center enterprises can be parsed. The schematic diagram is shown in Figure 1.
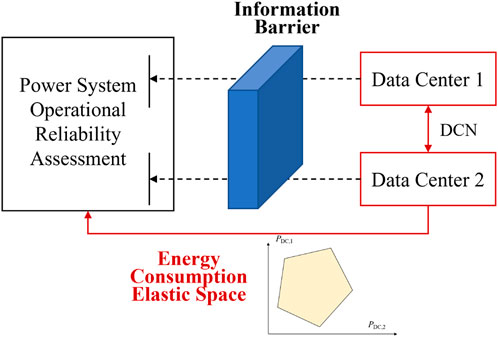
FIGURE 1. Schematic diagram of the proposed method.
The remainder of this paper is organized as follows: first, the energy consumption model of data centers is introduced in Section 3. Then, based on the energy consumption model, the energy consumption elastic space can be calculated, and the related introduction is provided in Section 4. In Section 5, the corresponding operational reliability assessment method based on the data center energy consumption elastic space is described. Finally, some simulations are introduced in Section 6.
3 Data center energy consumption model considering load flexibility
The data center energy consumption model is used to minimize the operation cost of all data centers under practical constraints, including data center operation constraints and load transferring constraints in the regional power grid. Hence, the objective function and the constraints of the data center energy consumption model are introduced as follows:
1) Objection function:
where Ci represents the total operational cost of the ith data center; PDC,i denotes the total energy consumption of the ith data center; F is the electricity price; Δt is the time interval; and NDC represents the total number of data centers.
2) Power-demand constraint of a single IT equipment:
where PIT,i(t) indicates the power demand of the IT equipment i in time period t; Pmax,i, Pidle,i, and Psleep are the maximum power load, static power load, and standby power load of IT equipment i, respectively; ui(t) is the computing capacity occupancy rate of the ith IT device in the tth period; bi and b2 are the leakage constants; TIT,i(t) is the chip temperature for IT equipment i; Ii is a state variable for the IT equipment i, where Ii can take values 0, 1, or 2, representing the “off”, “on”, and “standby” states, respectively.
3) Power-demand constraint of air conditioning systems in data centers:
where kCOP,k is the performance coefficient of the air conditioning system in data center k; QIT,k represents the heat dissipation of IT equipment in data center k (it is 97% of the IT equipment’s power consumption in general); and Sdc,k is the room area of data center k.
4) Total power consumption and computing load of a data center:
where PDC,k(t) and uDC,k(t) are the total power consumption and computing load of data center k in the tth period, respectively; NIT,k is the IT equipment number of data center k.
5) Computing capacity limitation constraints:
where uDC,k, max and uDC,k, min are the upper and lower limits of the total computing power of all IT equipment in data center k, respectively.
6) Total computing capacity demand-balance constraints:
where DIT,k(t) represents the computing capacity demand of data center k during time interval t.
7) Individual computing capacity demand-balance constraints:
where ukl(t) represents the computing capacity demand transferred from data center k to data center l during time interval t.
8) Computing capacity transfer limitation constraints:
where ukl, max represents the upper limit on the computing capacity demand transfer between data centers k and l.
9) Temperature constraints of air conditioning systems:
where Tout,k(t) is the air supply temperature of the air conditioning system in data center k; Tout, max and Tout, min are the upper and lower limits of the air supply temperature, respectively.
10) Chip temperature constraints of IT equipment:
where TIT,max(t) is the chip temperature upper limitation.
11) Airflow temperature constraints of IT equipment:
where Tin,i(t) is the inlet airflow temperature of IT equipment i; Tin, max and Tin, min are the upper and lower limitations of the inlet airflow temperature for IT equipment, respectively.
12) Heat transfer constraint:
The operation of the data center must satisfy the law of energy conservation. When the IT equipment reaches a thermal equilibrium state, the sum of the heat emitted by IT equipment and the heat of the inlet cold air should be equal to the heat of the outlet hot air, which is described by (13). Eq. 14 represents the constraint of thermal equilibrium in the air conditioning system.
where Rin represents the convective heat transfer equivalent thermal resistance at the inlet of the IT equipment (K/W); D is the heat transfer coefficient; Tout(t) is the supply air temperature of the air conditioning system; 97%PIT,i(t) is the heat generated by IT equipment i.
13) Ramping constraints of IT equipment:
where
14) Minimum startup time constraints:
where TIT-off,i(t) represents the downtime of IT equipment i; TIT-off,i, min is the minimum downtime of IT equipment i, typically ranging from 1 to 2 min.
Eventually, the complete energy consumption model of data centers in a regional power grid is introduced as (1)–(16). It is a mixed-integer linear programming problem. To simplify the energy consumption model of data centers, we assume that all the IT equipment is in the “on” state. Then, the mixed-integer linear programming problem can be transformed into a linear programming problem. It can also include the computing capacity load transfer along different data centers and the practical operation constraints.
4 Data center energy consumption elastic space
In the energy consumption model of data centers, there are many optimization variables in (1)–(16), denoted as y, such as Tout,k(t), TIT,i(t), Tin,i(t), Ii, ukl(t), utotal,k(t), Tout(t), PIT,i(t), Tin,i(t), and TIT-off,i(t). While adding this model to the operational reliability assessment, the model scale and complexity could increase. Additionally, it also involves some private data of data centers. Under the concerns of privacy issues, it is impossible to implement operational reliability assessments considering the flexibility of data centers. However, the operational reliability assessment mainly takes advantage of the power loads in different data centers to analyze the adequacy of power systems. To consider the power load flexibility that the power loads in different data centers could transfer to each other in a regional power grid, the main task is how to convert the constraints of the energy consumption model to an elastic space of power loads. Therefore, this paper builds an energy consumption elastic space via the multi-parametric programming technique to replace the initial energy consumption model of data centers.
For the sake of simplification, the linear energy consumption model (1)–(16), is reformulated to (17), and (18), where the power loads of different data centers
where y is the optimization variable in the energy consumption model of data centers; A and B are coefficient matrices; E and D are coefficient vectors.
Multi-parametric programming is a mathematical optimization method used to find the optimal solution among multiple parameters or variables. It can determine the optimal solution function based on the programming parameters and the related region of programming parameters. Thus, in this paper, we calculate the energy consumption elastic space of data centers using multi-parametric programming techniques. Theoretically, the elastic space is solved based on the concepts of “Optimal Partition” and “Critical Region.”
4.1 Optimal partition
We define the optimal solution of the linear programming model ((17) and (18)) as y*, and then, the active constraints and inactive constraints in the formula can be represented as follows:
where subscripts J and K represent the indices for active constraints and inactive constraints, respectively.
So the constraints in (18) belong to either the set of active constraints or the set of inactive constraints, which means
4.2 Critical region
Given parameter wi ∈ W, defining
It can be observed that the critical region in (23) is still determined by private data, but the critical region could be solved via (21) and (22). First, for any wi ∈ W with different active constraints, the optimization variable y*(wi) can be solved based on the Karush–Kuhn–Tucker (KKT) conditions. According to the basic sensitivity theorem (Vajda, 2009), the function of y*(wi) can be calculated for any wi with the identical optimal partition as wi. Then, substituting y*(wi) into (22), the critical region
where
Actually, the critical region
For a better understanding, the schematic diagram of the energy consumption elastic space of data centers based on multi-parametric programming is depicted in Figure 2. The figure takes two data centers as an example to calculate the data center energy consumption elastic space. The axes PDC,1 and PDC,2 represent the required energy consumption for data centers 1 and 2, respectively. Since those critical regions are convex and mutually exclusive, we could directly combine them and build the complete energy consumption elastic space. In mathematics, we merely need to concatenate the linear constraints of all critical regions and then remove the boundary constraint where two critical regions are adjacent. For example, if
where C and F are the coefficient matrices of the energy consumption elastic space.

FIGURE 2. Schematic diagram of the data center energy consumption elastic space.
To summarize, this section introduces the methodology to construct the energy consumption elastic space of data centers. It is composed of many linear constraints of power demands in different data centers, which do not include any private data and can be directly used for operational reliability assessment. The specific steps to calculate the constraints of the elastic space are given as follows:
1) Build the energy consumption model (1)–(16) based on the privacy data of different data centers.
2) Reformulate the energy consumption model from (1)–(16) into a general formation (17) and (18).
3) Set the programming parameters and optimization variables. The total energy consumption of each data center PDC,k is regarded as the programming parameter w, and Tout,k(t), TIT,i(t), Tin,i(t), Ii, ukl(t), utotal,k(t), Tout(t), PIT,i(t), Tin,i(t), and TIT-off,i(t) are set to be the optimization variables y.
4) Explore all the optimal partitions and calculate the related critical regions (24).
5) Concatenate the constraints of all critical regions and remove the boundary constraint where two critical regions are adjacent. Eventually, the energy consumption elastic space of data centers in a regional power grid (25) is constructed.
5 Operational reliability assessment method based on the data center energy consumption elastic space
Operational reliability assessment is essential to quantify the reliability levels when considering the uncertainties of the contingency and flexibility of resources. With the development of data centers, their energy consumption gradually increases and has a great impact on power system reliability. Hence, in this section, we build the load-shedding model considering the load flexibility of the data center, which is the key model for operational reliability assessment. Then, the complete operational reliability assessment method is introduced.
5.1 Load-shedding model based on the data center energy consumption elastic space
To consider the load flexibility of the data center, the energy consumption elastic space of data centers is used. Specifically, the constraints indicating the energy consumption elastic space are added into the conventional load-shedding model of power systems. The details of the proposed load-shedding model are as follows:
1) Objective function
The objective function of load shedding is to minimize the total cost of the power system, including load reduction cost, wind, and the photovoltaic abandonment cost.
where Nb represents the total number of buses; ΔPW,j(t), ΔPS,j(t), and CE,j represent the wind abandonment, photovoltaic abandonment, and load-shedding amount of bus j during t period, respectively; a, b, and c are the cost coefficients of wind abandonment, photovoltaic abandonment, and load shedding, respectively.
2) Data center energy consumption elastic space constraints
Data center operations need to satisfy data center operational constraints and data center load flexibility constraints. In Section 4, the equivalent elastic space of power demands in data centers (25) is built. For any power demand of data centers located in the elastic space, there exists an operation plan for data centers satisfying the operational constraints and load flexibility constraints. Hence, the power demand of data centers should satisfy the elastic space constraints (25):
where PDC is a vector indicating the power demands of data centers; C and F are the coefficient matrices from (25).
3) Power grid operational constraints
There are many kinds of operational constraints in the power grid, including active and reactive balance constraints, load-shedding limitations, renewable energy curtailment limitations, branch power flow, and voltage magnitude constraints. The active and reactive balance constraints are shown as follows:
where PG,i(t) and QG,i(t) are the active and reactive generation in the bus i at period t, respectively; PD,i(t) and QD,i(t) are the active and reactive loads in bus i at period t, respectively; PDC,i(t) is the power load of the data center in bus i at t period; Vi(t) is the voltage magnitude of bus i at period t; θij(t) is the phase angle difference between bus i and j at period t; Gij and Bij are the real and imaginary parts of the ith row and the jth column elements of the admittance matrix, respectively.
Moreover, the load-shedding amount CE,j(t), wind curtailment quantity ΔPW,m(t), and photovoltaic curtailment quantity ΔPS,n(t) should satisfy their upper and lower limitations:
where PW,m(t) and PS,n(t) represent the active power generation of wind farm m and photovoltaic station n, respectively; Nw and Ns are the numbers of wind farms and photovoltaic stations, respectively.
The voltage magnitude Vj(t), active generation PG,i(t), reactive generation QG,i(t), and branch active power Pl,i(t) should satisfy their upper and lower limitations:
where subscripts max and min represent the upper and lower limits, respectively; Nl represents the total number of transmission lines.
In summary, the operational reliability assessment model of power systems is constructed as (26)–(36). By replacing the data center operational constraints and data center load flexibility constraints with energy consumption elastic space constraints, the above load-shedding model not only safeguards the internal operational data of data centers but also accomplishes the evaluation of power system operational reliability considering the load flexibility of data centers.
5.2 Evaluation method based on the data center energy consumption elastic space
After building the load-shedding model using the energy consumption elastic space, the complete operational reliability assessment method can be established. Compared with the conventional operational reliability assessment based on the Monte Carlo simulation method, it first calculates the energy consumption elastic space and then begins the assessment of power system operational reliability. The detailed flowchart of the assessment process is depicted in Figure 3. The detailed descriptions of the main steps are introduced as follows:
1) Calculate the energy consumption elastic space of data centers referring to Section 4.
2) State sampling and analysis: After building the energy consumption elastic space of data centers, it needs to sample the state of the power system and data center. We use the Monte Carlo method to sample random variables such as the states of system components (generators, transmission lines, transformers, etc.), load PD,i(t), active power generation of wind farms PW,m(t), active power generation of photovoltaic stations PS,n(t), and the energy consumption of data centers PDC,k(t) to determine the operating states of the power system. Then, we solve power flow equations to determine whether there are any violations of constraints. If any violation exists, start c), otherwise start d).
3) Minimum load-shedding calculation. When any violation occurs, it needs to dispatch the generation of generators or shed some loads to ensure the safety of power system operation. Therefore, we directly solve the load-shedding model (26)–(36). If the load-shedding amount is 0 for all buses, it means that the dispatch could reduce the violations of constraints. Otherwise, it needs to shed some loads to maintain the safety of the power system. Record the load-shedding amount CE,j(t), wind curtailment quantity ΔPW(t), and solar curtailment quantity ΔPS(t) and go to d).
4) Updating operational reliability indicators: Based on the minimum load-shedding results, the power system operational reliability indicators considering the load flexibility of data centers are calculated. In this paper, the indicators used include the data center energy efficiency indicator (APUE), power system operational reliability indicators (EDNS, PLC, EWPA, and ESPA), and their improvements (CDED, CDPL, CDEW, and CDES), as shown below( 37)–(45):
where P(x) is the probability of the system state x; GE, GW, and GS are the sets of states in which load-shedding, wind abandonment, and solar abandonment occur; CE(x), ΔPW(x), and ΔPS(x) represent the load-shedding amount, wind curtailment quantity, and solar curtailment quantity for the system state x; subscripts 0 and 1 represent “not considering” and “considering” data centers’ flexibility, respectively.
5) Convergence determination: using the maximum variation coefficient of operational reliability indicators (EDNS, PLC, EWPA, and ESPA) and the maximum sample number Kmax as convergence criteria, if the convergence condition is met, terminate the calculation. Otherwise, proceed to the next sampling and return to b).
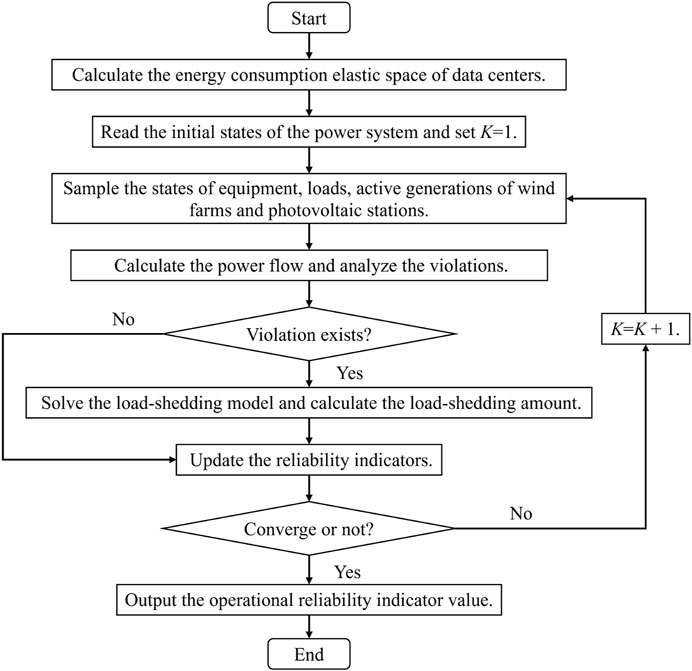
FIGURE 3. Operational reliability evaluation flowchart based on the data center energy consumption elastic space.
6 Case study
To verify the effectiveness of the proposed methods, we refer to the actual operating data of a domestic internet company (see the Supplementary Material). All the simulations are implemented in MATLAB software.
6.1 Case description
Under the premise that the energy consumption of the data center accounts for the same proportion of the total energy consumption in the power system, a simulation analysis was conducted using the IEEE RTS 24-bus system and the actual provincial power grid with the 661-bus system. All simulations are tested in the hardware environment of Intel® CoreTM i7-9750H CPU @ 2.60 GHz, 24 GB RAM. As for the random variables, we assume that the stochastic characteristics of the load and data center loads within the power system all follow a normal distribution with a standard deviation of 5% of their expectations. The wind farm and photovoltaic station generation follow the Weibull distribution and beta distribution, respectively. The convergence criterion for sampling is either when the maximum variation coefficient of the reliability indicator is less than or equal to 0.05 or when the number of samples K reaches 100,000. We mainly compare S0, S1, and S2 (the computation time of S2 includes the time to calculate the energy consumption elastic space of data centers):
S0: Operational reliability assessment does not consider data center load flexibility.
S1: Operational reliability assessment considers data center load flexibility by directly adding the operation and flexibility constraints of data centers.
S2: The method proposed in this paper.
6.2 Simulation analysis
6.2.1 Simulation in the IEEE RTS 24-bus system
In the IEEE RTS 24-bus system, buses 19 and 6 are connected to data center A, and bus 8 is connected to data center B. The parameters of data centers A and B can be found in the Supplementary Material. By assessing the operation reliability of the power system using different methods, the results of all indicators are listed in Table 1.
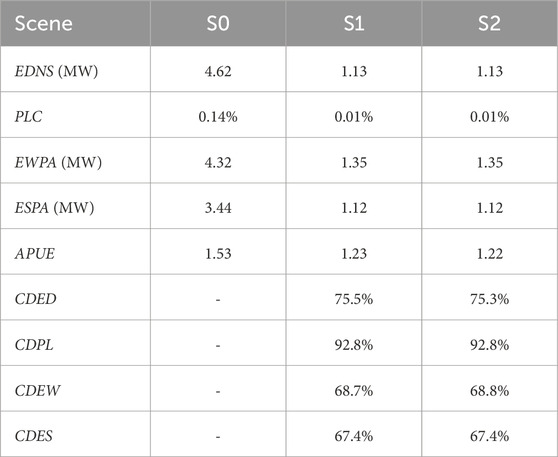
TABLE 1. Simulation results in the IEEE RTS 24-bus system.
Based on the data in Table 1, it can be observed that the performance of various indicators is the same in S1 and S2. It indicates that the use of the energy consumption elastic space does not bring errors into the operational reliability result. Without any private data utilization, the proposed evaluation method can effectively deal with the data privacy issue. When comparing the S2 with the S0 scenario, the EDNS, PLC, EWPA, ESPA, and APUE indicators have all been significantly reduced, with reductions of 75.3%, 92.8%, 68.8%, 67.4%, and 20.3%, respectively. The primary reason for this outcome is attributed to the load flexibility of data centers to alter the load distribution within the power system. This strategy effectively mitigates the issues of transmission line congestion, thereby enhancing the overall operational reliability of the system. Therefore, by considering the load flexibility of data centers via the energy consumption elastic space, the operational reliability assessment does not need any private data and accomplishes an accurate evaluation of the reliability level in power systems, which demonstrates the effectiveness of the proposed method.
Furthermore, in comparing the calculation time of S1 and S2, as shown in Table 2, the calculation time of S2 is only 84 s, which is 78.3% lower than the calculation time of 388 s of S1. This reduction is attributed to the utilization of the energy consumption elastic space calculated using the multi-parametric programming technique, which replaces the data center operation and load flexibility constraints in S1. For example, in this simulation, the energy consumption elastic space is shown in Figure 4. In the figure, the axes PDC,6, PDC,8, and PDC,19 represent the required energy consumption of the data centers at bus 6, 8, and 19, respectively. When calculating load-shedding as K = 462, the programming parameters PDC,6, PDC,8, and PDC,19 are 4.76 MW, 2.54 MW, and 3.19 MW, respectively, which are identical to those of S1. However, as for this state in S2, it merely takes 0.04 s, while S1 requires 0.06 s. This indicates that the energy consumption elastic space not only intuitively describes the required energy consumption of data centers but can also replace the data center operation and load flexibility constraints in the power system operational reliability assessment model, thus improving computational efficiency. Simultaneously, it resolves the issue of data privacy between the power grid and data centers, safeguarding the privacy of internal data such as data center computational loads.
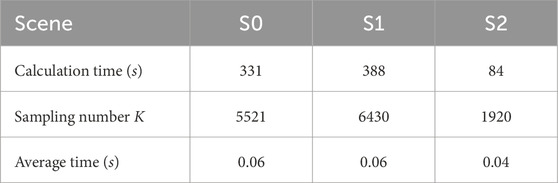
TABLE 2. Sampling information and calculation time of different methods in the IEEE RTS 24-bus system.
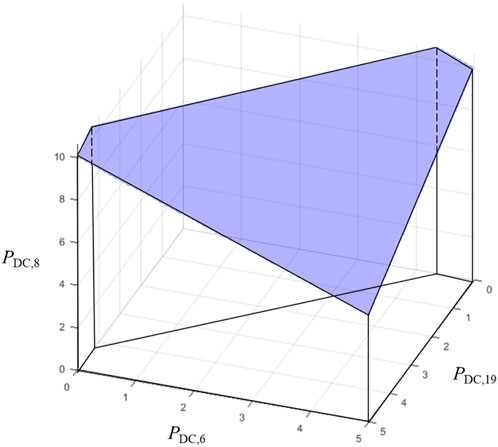
FIGURE 4. Energy consumption elastic space of the three data centers.
In summary, the utilization of the energy consumption elastic space can effectively address the data privacy issues between data centers and power grids and improve the operational reliability of the power system. Moreover, with many operations and load flexibility constraints replaced by energy consumption elastic space constraints, the computational efficiency can also be improved.
6.2.2 Simulations in the actual provincial power grid with the 661-bus system
To further investigate the utilization of the energy consumption elastic space in large-scale power grid operational reliability assessments, this simulation references a practical power system with the 661-bus system in a certain province. The data center parameters can be found in the Supplementary Material. The indicator results and calculation time of different methods are shown in Table 3 and Table 4, respectively.
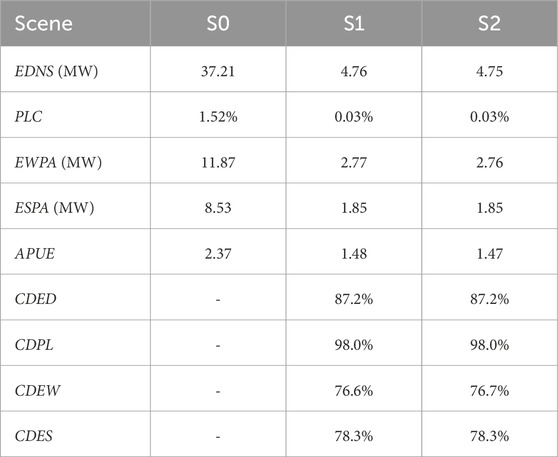
TABLE 3. Simulation results in the actual 661-bus power system.
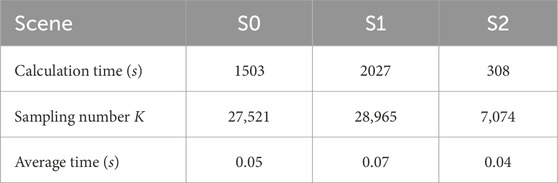
TABLE 4. Sampling information and calculation time of different methods in the practical 661-bus power system.
From Table 3, it can be observed that the various indicators are quite consistent under both S1 and S2 scenarios. The EDNS, PLC, EWPA, ESPA, and APUE indicators are significantly reduced compared to the S0 scenario, with reductions of 87.2%, 98.0%, 76.6%, 78.3%, and 37.9%, respectively. Further comparing the calculation time of S1 and S2, as shown in Table 4, it can be seen that the calculation time of S2 is only 308 s, which is 84.8% lower than that of S1, indicating that in the large-scale power system, the use of the energy consumption elastic space can also improve the computational efficiency without accuracy loss and break theinformation barrier between the data centers and power grid, which demonstrates the effectiveness of the proposed method.
It is worth noting that, compared to the IEEE RTS 24-bus system, the reduction in computation time for S2 in the practical 661-bus system is even more substantial than that for S1. It indicates that in larger and more complex power systems, the utilization of the energy consumption elastic space based on multi-parametric programming can further simplify the variables and constraints in the reliability assessment model, leading to even more significant improvements in computational efficiency. Therefore, the proposed method has a high practical value for improving power system operational reliability assessment, and it is worth further promotion and application.
7 Conclusion
The increasing penetration of renewable energy sources has added complexity and randomness to power system operational reliability assessment. It is necessary to consider flexible resources to overcome the increasing randomness, such as the load flexibility of data centers. However, data centers and power grids belong to the demand side and supply side, respectively, in actual situations. When conducting the power system operation reliability assessment, it is often impossible to obtain the internal operation data of the data center due to data privacy issues. To this end, this paper proposes an operational reliability assessment method considering the load flexibility of data centers via the energy consumption elastic space. Through simulations using the IEEE RTS case and practical power grid cases, the simulation results indicate that the proposed power system operational reliability assessment method can deal with the data non-interoperability and data privacy issues between the data center and the power grid and does not have any calculation accuracy loss. It has great potential to improve the power system operational reliability. However, as the data centers belong to the demand side in the power grid, how motivating the data center enterprises to participate in the power system operational reliability assessment could be a significant problem and is worthy of further research.
Data availability statement
The original contributions presented in the study are included in the article/Supplementary Material; further inquiries can be directed to the corresponding author.
Author contributions
SZ: conceptualization, formal analysis, methodology, writing–original draft, and writing–review and editing. JG: conceptualization, data curation, resources, software, validation, and writing–review and editing. HQ: data curation, resources, validation, and writing–review and editing. JY: conceptualization, funding acquisition, project administration, supervision, and writing–review and editing. SL: investigation, validation, and writing–review and editing. QG: visualization and writing–review and editing.
Funding
The author(s) declare that financial support was received for the research, authorship, and/or publication of this article. This work was supported by the National Key Research and Development Program of China under Grant 2021YFE0191000.
Conflict of interest
Authors SZ, HQ, and SL were employed by Hangzhou Yuhang District Power Supply Company. Author QG was employed by Hangzhou Electric Power Equipment Manufacturing Co., Ltd.
The remaining authors declare that the research was conducted in the absence of any commercial or financial relationships that could be construed as a potential conflict of interest.
Publisher’s note
All claims expressed in this article are solely those of the authors and do not necessarily represent those of their affiliated organizations, or those of the publisher, the editors, and the reviewers. Any product that may be evaluated in this article, or claim that may be made by its manufacturer, is not guaranteed or endorsed by the publisher.
Supplementary material
The Supplementary Material for this article can be found online at: https://www.frontiersin.org/articles/10.3389/fenrg.2024.1370861/full#supplementary-material
References
Alaperä, I., Honkapuro, S., and Paananen, J. (2018). Data centers as a source of dynamic flexibility in smart girds. Appl. energy 229, 69–79. doi:10.1016/j.apenergy.2018.07.056
Bajracharyay, L., Awasthi, S., Chalise, S., Hansen, T. M., and Tonkoski, R. (2016). “Economic analysis of a data center virtual power plant participating in demand response,” in 2016 IEEE Power and Energy Society General Meeting (PESGM), Boston, MA, USA, July, 2016.
Bari, M. F., Boutaba, R., Esteves, R., Granville, L. Z., Podlesny, M., Rabbani, M. G., et al. (2012). Data center network virtualization: a survey. IEEE Commun. Surv. tutorials 15, 909–928. doi:10.1109/surv.2012.090512.00043
Dai, W., Yu, J., Liu, X., and Li, W. (2018). Two-tier static equivalent method of active distribution networks considering sensitivity, power loss and static load characteristics. Int. J. Electr. Power and Energy Syst. 100, 193–200. doi:10.1016/j.ijepes.2018.02.032
Dayarathna, M., Wen, Y., and Fan, R. (2015). Data center energy consumption modeling: a survey. IEEE Commun. Surv. tutorials 18, 732–794. doi:10.1109/comst.2015.2481183
Huang, T., Lu, X., Zhang, D., Cheng, H., Dong, P., and Zhang, L. (2023). Acc-rl: adaptive congestion control based on reinforcement learning in power distribution networks with data centers. Energies 16, 5385. doi:10.3390/en16145385
Juanwei, C., Tao, Y., Yue, X., Xiaohua, C., Bo, Y., and Baomin, Z. (2019). Fast analytical method for reliability evaluation of electricity-gas integrated energy system considering dispatch strategies. Appl. Energy 242, 260–272. doi:10.1016/j.apenergy.2019.03.106
Li, W. (2014). Risk assessment of power systems: models, methods, and applications. Hoboken, New Jersey, United States: John Wiley and Sons.
Lin, W., Yang, Z., Yu, J., Li, W., and Lei, Y. (2020). Improving security and economy of interconnected power network through explicit feasible region of tie-line power transfer. Int. J. Electr. Power and Energy Syst. 123, 106262. doi:10.1016/j.ijepes.2020.106262
Lv, J., Zhang, S., Cheng, H., and Wang, D. (2019). Reliability evaluation of integrated energy system considering the dynamic behaviour of loads and operation strategy. Energy Procedia 158, 6508–6514. doi:10.1016/j.egypro.2019.01.109
Parvini, Z., Abbaspour, A., Fotuhi-Firuzabad, M., and Moeini-Aghtaie, M. (2017). Operational reliability studies of power systems in the presence of energy storage systems. IEEE Trans. Power Syst. 33, 3691–3700. doi:10.1109/tpwrs.2017.2771521
Pistikopoulos, E. N., Diangelakis, N. A., and Oberdieck, R. (2020). Multi-parametric optimization and control. Hoboken, New Jersey, United States: John Wiley and Sons.
Tan, Z., Zhong, H., Wang, J., Xia, Q., and Kang, C. (2019). Enforcing intra-regional constraints in tie-line scheduling: a projection-based framework. IEEE Trans. Power Syst. 34, 4751–4761. doi:10.1109/tpwrs.2019.2913876
Vajda, S. (2009). Mathematical programming. North Chelmsford, Massachusetts, USA: Courier Corporation.
Vasques, T. L., Moura, P., and de Almeida, A. (2019). A review on energy efficiency and demand response with focus on small and medium data centers. Energy Effic. 12, 1399–1428. doi:10.1007/s12053-018-9753-2
Vesa, A. V., Cioara, T., Anghel, I., Antal, M., Pop, C., Iancu, B., et al. (2020). Energy flexibility prediction for data center engagement in demand response programs. Sustainability 12, 1417. doi:10.3390/su12041417
Wu, D., Liu, A., Ma, L., Guo, J., Ma, F., Han, Z., et al. (2023a). Multi-parameter cooperative optimization and solution method for regional integrated energy system. Sustain. Cities Soc. 95, 104622. doi:10.1016/j.scs.2023.104622
Wu, Z., Chen, L., Wang, J., Zhou, M., Li, G., and Xia, Q. (2023b). Incentivizing the spatiotemporal flexibility of data centers toward power system coordination. IEEE Trans. Netw. Sci. Eng. 10, 1766–1778. doi:10.1109/tnse.2023.3234445
Xu, X., Mitra, J., Wang, T., and Mu, L. (2014). Evaluation of operational reliability of a microgrid using a short-term outage model. IEEE Trans. Power Syst. 29, 2238–2247. doi:10.1109/tpwrs.2014.2303792
Yang, G., Xu, M., Wang, W., and Lei, S. (2023). Coordinated dispatch optimization between the main grid and virtual power plants based on multi-parametric quadratic programming. Energies 16, 5593. doi:10.3390/en16155593
Yang, T., Zhao, Y., Pen, H., and Wang, Z. (2018). Data center holistic demand response algorithm to smooth microgrid tie-line power fluctuation. Appl. Energy 231, 277–287. doi:10.1016/j.apenergy.2018.09.093
Keywords: data center, multi-parametric programming, power system, operational reliability assessment, data privacy
Citation: Zhang S, Gao J, Qian H, Yu J, Luo S and Guo Q (2024) Power system operational reliability assessment based on the data center energy consumption elastic space. Front. Energy Res. 12:1370861. doi: 10.3389/fenrg.2024.1370861
Received: 15 January 2024; Accepted: 05 February 2024;
Published: 26 February 2024.
Edited by:
Yonghui Sun, Hohai University, ChinaReviewed by:
Bing Yan, Rochester Institute of Technology (RIT), United StatesLi Dan, China Three Gorges University, China
Copyright © 2024 Zhang, Gao, Qian, Yu, Luo and Guo. This is an open-access article distributed under the terms of the Creative Commons Attribution License (CC BY). The use, distribution or reproduction in other forums is permitted, provided the original author(s) and the copyright owner(s) are credited and that the original publication in this journal is cited, in accordance with accepted academic practice. No use, distribution or reproduction is permitted which does not comply with these terms.
*Correspondence: Juan Yu, eXVqdWFuY3F1QGNxdS5lZHUuY24=