 Jiefu Bi1*
 Qing Zhang2,3,4
- 1School of Highway, Chang’an University, Xi’an, China
- 2Henan Key Laboratory of High-Grade Highway Detection and Maintenance Technology, Xinxiang, China
- 3National Engineering Research Center of Highway Maintenance Equipment, Xinxiang, China
- 4Key Laboratory of Green Chemical Media and Reactions, Ministry of Education, Collaborative Innovation Center of Henan Province for Fine Chemicals Green Manufacturing, School of Chemistry and Chemical Engineering, Henan Normal University, Xinxiang, China
Microwave heating, as an efficient and environmentally friendly heating technology, is used in solving rapid deicing issues of asphalt pavement. In this study, activated carbon powder (ACP) was adopted to partly replace mineral powder and improve the microwave heating efficiency of asphalt concrete. Some tests of key indexes about deicing, microwave heating, asphalt concrete and asphalt mastic were conducted in laboratory. In order to comprehensively compare and analyze the performance of asphalt concrete at different replacements and recommend the best type of asphalt concrete with laboratory data, an advanced data processing and mathematical model was established based on improved Analytic Hierarchy Process (AHP) and radar chart method. The results show that the fi representing the comprehensive performance of each type of asphalt concrete can be ranked as f6>f5>f4>f3>f2>f1. Therefore, it can be easily recommended that the type of asphalt concrete that meets the expected requirements is that with 100% ACP replacement amount. Additionally, the established model has proved feasible and effective through the application of this research. Finally, this research’s process and results can provide a new idea and reference for resolution of similar problems in the future.
1 Introduction
1.1 Background
Compared with traditional deicing methods, microwave heating provides significant convenience and considerable saving in cost (Mou and Li, 2003). It exploits the energy carried by microwave and turned into heat to melt the ice on the surface of the pavement. Opinions have been pointed out that aggregates (especially sieve size from 4.75 to 9.5 mm) account for most in microwave heating and determine the heating efficiency (Guo et al., 2020; Trigos et al., 2020). However, due to the conventional material used in asphalt mixture, the microwave heating efficiency (MHE) has not reached the satisfactory researchers expect (Osborne and Hutcheson, 1989). In recent years, much attention has been paid to search proper microwave absorbing materials. For instance, Wang et al. (2016) compared the MHE of asphalt containing magnetite aggregates with that containing general basalt aggregates, finding out MHE of the former is 6.15 times of the latter. Wang et al. (2019a) get the similar result and put forward that MHA reduces heating uniformity and MHE can be influenced by ambient temperature. Jahanbakhsh, et al. (2018) found out that carbon black (CB) can enhance the conductivity and sensitivity to microwave radiation and CB modified asphalt mixture showed higher MHE than those of limestone and siliceous mixture. Gao et al. (2019) utilized steel wool fiber and assessed the heating uniformity and sustainability of the asphalt mixture under −5 and −10°C and offered an optimal content. Ding et al. (2020) conducted a microwave heating test to establish the effectiveness of a ferric aluminum mixture (Al2O3:Fe3O4 = 1:1) and hydroxy iron powder in enhancing microwave deicing sensitivity.Yıldız and Atakan, (2020) evaluated the possibility of fly ash in enhancing the microwave heating performance, which shows positive impact as a result. Liu et al. (2019b) and Wang et al. (2019b) used active carbon powder (ACP) as filler and described the ice-melting characteristic by infrared thermography and melting speed while examine the mechanical performance of the mixture simultaneously, which showed improvement in rutting and fatigue resistance and microwave absorbing capacity. Liu and Sun, (2024) proved that ACP replacement of mineral powder can improve the thermal stability of asphalt mixture. In order to quantificationally compare the microwave performance, researchers have also brought out key parameters including the surface temperature, heat distribution, deicing time and thermal diffusion to judge the microwave deicing performances of all the additives (Guo, et al., 2020).
Activated carbon powder (ACP) is a material in black with developed pore structure and large specific surface area, thus it is equipped with its good adsorption performance, chemical and physical stability. In view of its unique microcrystalline and chemical structure, researchers have applied ACP to asphalt mixture in order to improve its performances and other functional demand. In mechanical performances, Bostancioğlu and Oruc, (2015) used ACP and furan resin as additives and discovered increase in Marshall stability and quotient by 9% and 25% respectively. Seyrek et al. (2020) further found that the addition of ACP makes contribution to high- and low-temperature performance and resistance against fatigue cracking as well as permanent deformation. Liu and Wang, (2019a) substituted mineral powder by ACP to modify asphalt mastic, which showed significant improvement in shear strength viscosity and low-temperature rheological property. Thanks to ACP’s porous structure, environment functions become possible. Hu et al. (2019) noted that the addition of ACP not only enhanced filtration effectiveness but also lowered the pH of runoff and increased the rate of pollution removal. Lei et al. (2020) adopted ACP to modify TiO2 by which the spectral response range is extended and dispersion performance enhanced. Xiao et al. (2017) verified the high porosity and large internal surface in ACP and used it to reduce volatile organic compounds (VOCs) the pavement produces. Moreover, Karimi et al. (2018) took advantage of ACP’s microwave adsorption ability and use it as binder-based conductive addictive, which showed potential in crack-healing performance under microwave. Kavussi et al. (2020) evaluated the microwave heating properties of ACP and pointed out its feasibility in microwave healing. As mentioned above, ACP shows a huge potential in road engineering.
Based on above literature review and analysis, the idea which ACP was used in asphalt concrete to improve its microwave heating capable is feasible. Therefore, many related tests were conducted in laboratory and a lot of data was obtained. In order to qualitatively and quantitatively analyze and compare the comprehensive performance of all types of asphalt concrete considering all test results of indexes, Analytic Hierarchy Process (AHP) and radar chart method are used to complete this work. AHP was first brought forward in the 1980 by Saaty to assist in solving complex decision problems by capturing both subjective and objective evaluation measures (Saaty, 1980). Since it is simplicity and of great flexibility, AHP has been studied extensively and utilized in nearly every application related to multiple criteria decision-making (MCDM) problem (Ho and Ma, 2018). It provides a concise and useful method for decision making in a complex system composed of many interrelated and restrictive factors (Ishizaka and Labib, 2011). AHP contains four main steps: stratification, weights comparison, weights calculation and verification of consistency (Shin et al., 2020). Stratification leads to the formation of a hierarchy, which comprises a decision goal, decision criteria, and alternatives. Then, elements at each level are compared based on the assumption of inter-independent and the weight matrix is structured. Consistency verification is conducted to prevent the mistake made subjectively by decision-makers and to ensure the optimal outcome (Darko et al., 2018). Moreover, radar chart method originated in Japan as a useful graphical display method for multivariate data and has been used in several fields (Bianchin et al., 2018). Compared with traditional mathematical analysis method, radar chart projects the indicator status of the evaluation object onto a two-dimensional plane, therefore offering an intuitive visualization under various indicators and quantitative evaluation via combination of numerical proportions (Chen et al., 2010; Wang et al., 2017). The basic shape of a radar chart generally contains 3 concentric circles and necessary indicators dividing the circle by fan shapes. The smallest circle represents the lowest level, which is 1/2 of the average, while the middle circle corresponds to the average level, and the largest circle denotes the advanced level. Furthermore, each sector is subdivided into sub-indicators.Corresponding index values of subfactors are marked and the adjacent points are connected with lines to form a radar chart. Before forming a radar chart, optimal combination of indicators should be determined in order to prevent the impact on evaluation indexes such as area and perimeter caused by the change in the order of indicators (Liu et al., 2008; Kalonia et al., 2013).
In this study, ACP was used to partly replace mineral powder to improve deicing efficiency of asphalt concrete under microwave heating. In the laboratory, the twelve key indexes of these different types of asphalt concrete were studied and a large amount of data was obtained. Under the premise of considering the weight of each index, it is very difficult to compare and analyze the comprehensive performance of these different types of asphalt concrete. In order to solve this problem, the improved AHP was used to determine the weight of each index, and then the radar chart method was used to qualitatively and quantitatively analyze the comprehensive performance of different types of asphalt concrete. After these calculations and analyses, a best type of asphalt concrete that meets the expected requirements is recommended. Finally, the process and results of this research can provide a new idea and reference for solving similar problems in the future.
1.2 Objective of this research
Based on the above literature review and discussion, the main objectives of this research are summarized as the following two points:
1) A model that can comprehensively compare and analyze the performance of different types of asphalt concrete will be established under the condition of considering multiple indexes.
2) This established model will be applied to analyze different types of ACP modified asphalt concrete, and finally the best type of asphalt concrete that meets the expected requirements will be recommended.
2 Information of the evaluated object
2.1 Introduction of the evaluated object
In this study, ACP was used to partially replace mineral powder (0%, 20%, 40%, 60%, 80%, and 100% replacement of volume of mineral powder) to achieve efficient deicing of asphalt concrete under microwave radiation. To know whether this idea is feasible, these six types of asphalt concrete should be prepared and then comprehensively evaluated. Finally, the final conclusion can be drawn. These six asphalt concretes are all prepared in the laboratory using the Marshall design method in accordance with Chinese standards (Chinese Standard, 2011). Some special measures in preparing process can refer to the related requirements in references Liu et al. (2019b) and Wang et al. (2019a).
2.2 Selection of evaluation index
The selected evaluation indicators mainly include four categories. They are asphalt mastic, asphalt concrete, microwave heating and deicing. Asphalt mastic is an important part of asphalt concrete, and it plays a very important role in asphalt concrete. Its composition and structure determine the high-temperature deformation resistance and low-temperature cracking resistance of asphalt concrete (Liu et al., 2008; Wang et al., 2019a). More importantly, in this study, ACP is used to partially replace mineral powder, so the impact of this on asphalt mastic has to be considered. Additionally, the engineering performance of asphalt concrete must be considered under any circumstances. Chen, (2023) found several relationships with the performance of asphalt mixtures. Liu and Sun, (2024) found that high temperature elasticity of asphalt was enhanced by adding ACP and asphalt mastic interaction ability were strongly enhanced when replacing part of filler with ACP. If in order to achieve a certain purpose, the engineering performance of asphalt concrete cannot meet the requirements of its use, then any effort is futile. It is the ultimate goal of this research to improve the microwave heating capacity of asphalt concrete and finally achieve the goal of efficient deicing. Therefore, these two categories cannot be ignored.
Based on the above discussion, after the four aspects are determined, some specific key evaluation indexes in each aspect are selected for subsequent related experiments. These selected specific indexes are summarized in Figure 1. These indexes are divided into four categories which are deicing, microwave heating, asphalt mastic and asphalt concrete, respectively. The ranking of their importance is Ideicing > Iasphalt concrete > Imicrowave heating > Iasphalt mastic.

FIGURE 1. The selected indexes system.
2.3 Collection of evaluated data
After the evaluation index and test plan are determined, relevant experiments need to be carried out to obtain the laboratory test data of each evaluation index. Eight of the twelve index tests (C1, C2, C3, C4, C4, C6, C7, and C8) were carried out in accordance with the requirements of the Chinese standard (Chinese Standard, 2011), and the remaining four (C9, C10, C11, and C12) were carried out in accordance with the requirements described in these three references (Liu and Wang, 2019a; Liu et al., 2019b; Wang et al., 2019b). By many and orderly laboratory experiments, many expected data have been obtained, as shown in Table 1. These data will be used and processed in subsequent research.
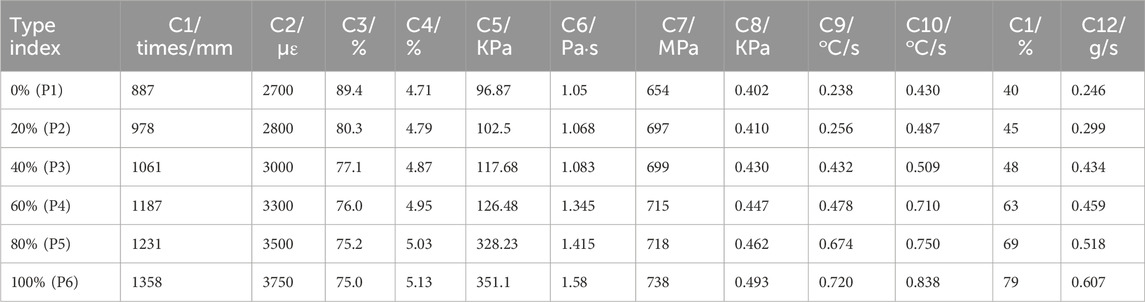
TABLE 1. Test data of evaluation index.
3 Methodology and data pre-processing
3.1 Analytic hierarchy process of improvement
The Analytic Hierarchy Process (AHP) treats the object of study as a system and makes decisions using a process of decomposition, comparative judgment, and synthesis. It has become an important tool for system analysis, developed after the methods of mechanistic and statistical analysis. The essence of the system’s approach is to not sever the impact of various factors on the outcome. In AHP, the weighting of each level directly or indirectly affects the outcome, and the impact of each factor at every level on the outcome is quantified, making it very clear and precise. This method is particularly useful for evaluating systems with unstructured characteristics, as well as for multi-objective, multi-criteria, and multi-period system evaluations.When the number of selected indicators is large, it is necessary to improve AHP, and the specific methods are as follows.
1) Establishment of a hierarchical analysis model
Our aim in this study is to recommend the best type of asphalt concrete that meets expectations. Therefore, the best type of asphalt concrete is of course the objective layer in the AHP. The twelve selected key indexes are used as the criterion layer in the model. Finally, the six types of asphalt concrete are the plan layer in the model. The hierarchical analysis model constructed according to this idea is shown in Figure 2.
2) Comparison matrix
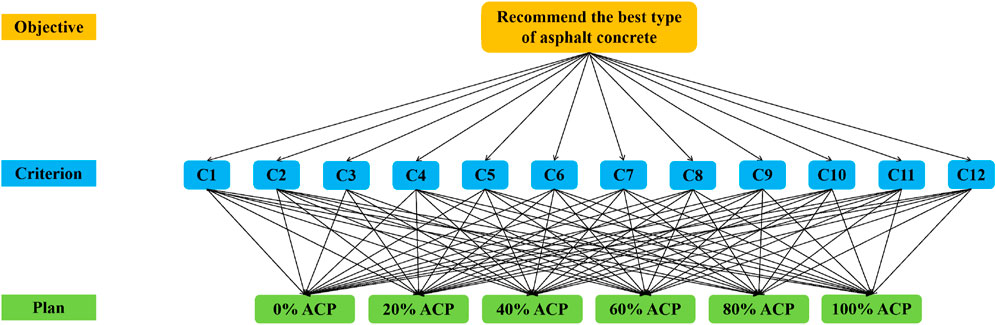
FIGURE 2. The hierarchical analysis model.
The traditional AHP judgment matrix is established by the nine-scale method. In the practical establishment process, the subjective factors of experts dominate, which will bias the evaluation results. In addition, when the matrix consistency check is performed, if the judgment matrix is not consistent, the main function of the AHP scheme’s optimal ranking will be destroyed. Therefore, it must be restructured and calculated until it is passed, and the amount of calculation is large and the accuracy is not high (Ho and Ma, 2018). The improved AHP adopts the three-scale method, which makes it easy for experts to make relatively important comparisons between the two factors without the need for consistency testing. Moreover, this method can also greatly reduce the number of iterations, improve the convergence speed, and meet the requirement of calculation accuracy (Kong et al., 2013). Their calculation processes are shown in Figures 3A, B respectively.
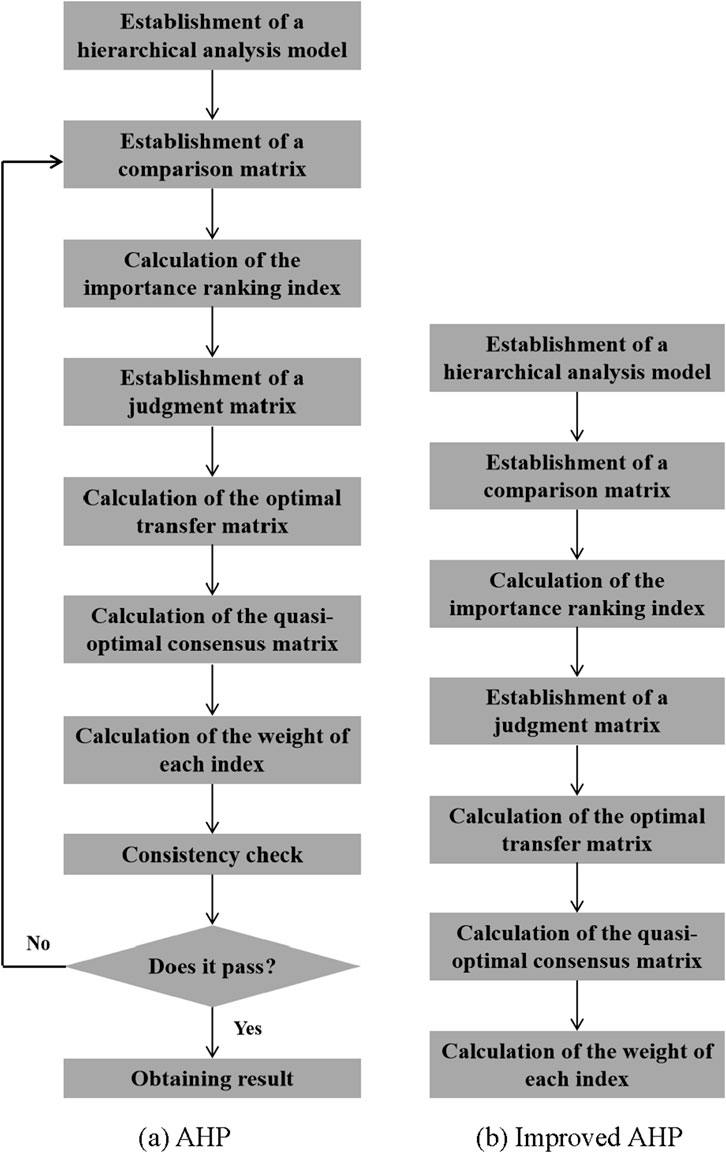
FIGURE 3. The processing flow AHP and improved AHP.
The specific description of the three-scale method is shown in Table 2. Comparison matrix (A=(Aij)m×n) according to the method in Table 2 can be easily established. The comparison matrix form of A is shown in Eq. 1.
3) Calculation of the importance ranking index
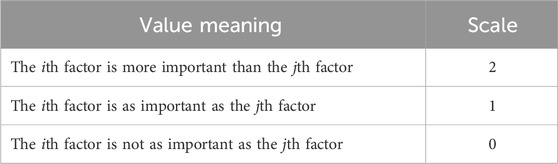
TABLE 2. Establishment method of comparison matrix.
The importance ranking index (ri and rj) is used to calculate the judgment matrix. ri and rj are calculated according to Eq. 2 and Eq. 3, respectively.
4) Judgment matrix
The judgment matrix (B) is calculated according to Eq. 4.
The parameter km in Eq. 4 is calculated according Eq. 5.
5) The optimal transfer matrix of the judgment matrix
The optimal transfer matrix C of the judgment matrix B is calculated according to Eq. 6.
6) Calculation of the quasi-optimum consistent matrix of the judgment matrix
Eq. 7 is the calculation method of the quasi-optimum consistent matrix D of the judgment matrix B.
7) Calculation of the weight of each index
The eigenvector corresponding to the largest eigenvalue of matrix D is calculated, and then they are standardized. Finally, the weight value (Wj) of each index is obtained.
8) Calculation of the included angle of the index axis
Finally, the included angles between the index axes can be calculated by applying the weights calculated in the previous step in combination with Eq. 8.
3.2 Radar chart method
3.2.1 Standardized processing of evaluation index data
Usually there are both absolute and relative quantitative indicators in the comprehensive evaluation (CE) system. The absolute quantity index is a physical quantity related to the dimension. Generally speaking, different indicators have different units, and the same indicator often does not have the same value in different units. This often results in several orders of magnitude difference in values between the indicators. When the magnitude and speed of the change of each index value are close, the relative index can be used for comprehensive evaluation. Therefore, in this case, the data can be processed without dimension according to Eq. 9. If the magnitude and speed of the change of each index value are very different, the data can be standardized according to Eqs 10–12. According to the characteristic of the data obtained in this study, the application of Eq. 9 can complete the standardization of these data. In addition, the indexes selected in this study are all positive indexes, so all data can be standardized according to the same formula.
After the standardization is completed, all the data can be displayed in the radar chart. But the comprehensive performance of each asphalt mixture can only be roughly seen from the radar chart, their ranking must be obtained by calculating area and perimeter of the radar chart. Eq. 13 is the characteristic vector including the area and perimeter of the radar chart.
where Up represents the characteristic vector of the pth object; Sp represents the area of the radar chart; Lp represents the perimeter of the radar chart. Their calculation method is shown in Eq. 14.
Evaluation vector (Zp) is defined as Eq. 15.
where zp1 is the relative area of evaluation indicator; zp2 is the relative perimeter of evaluation indicator. Their calculation method is shown in Eq. 16.
The final evaluation result is calculated according to Eq. 17. The larger the value is, the better the performance of the evaluated object is.
4 Results and discussion
4.1 Calculation results of each index weight based on improved analytic hierarchy process
Since the matrix established in this study is difficult to be processed by manual calculation, the following calculation results are all calculated with the help of Matlab® software. The Supplementary Appendix is the original calculation procedure.
1) Comparison matrix
Comparison matrix (A=(Aij)m×n) according to the method in Table 2 can be easily established. The results are shown in Table 3.
2) Judgment matrix

TABLE 3. Comparison matrix.
According to Eq. 4, the judgment matrix (B) is calculated and their calculation results are summarized in Table 4.
3) The optimal transfer matrix
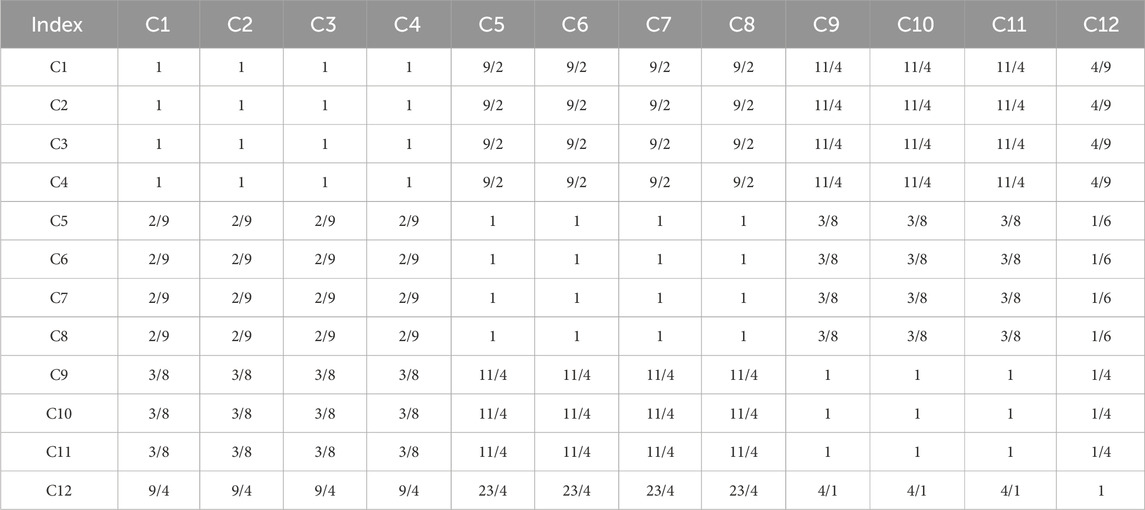
TABLE 4. Judgment matrix.
According to Eq. 6, the optimal transfer matrix C of the judgment matrix B is calculated and the results are shown in Table 5.
4) The quasi-optimum consistent matrix
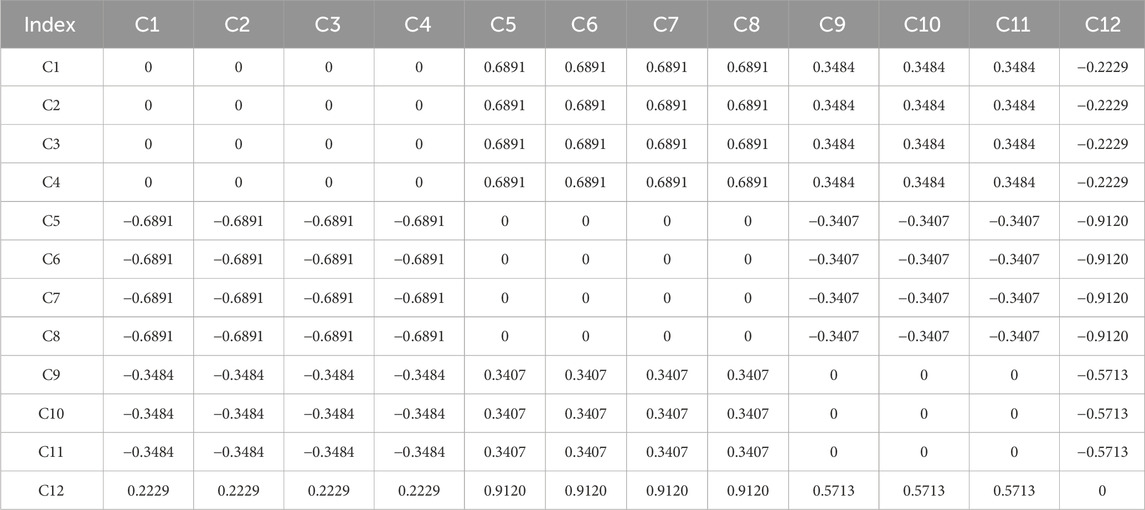
TABLE 5. Optimal transfer matrix.
The quasi-optimum consistent matrix D of matrix B can be calculated by Eq. 7, and the calculation results are shown in Table 6.
5) Calculation of the weight of each index
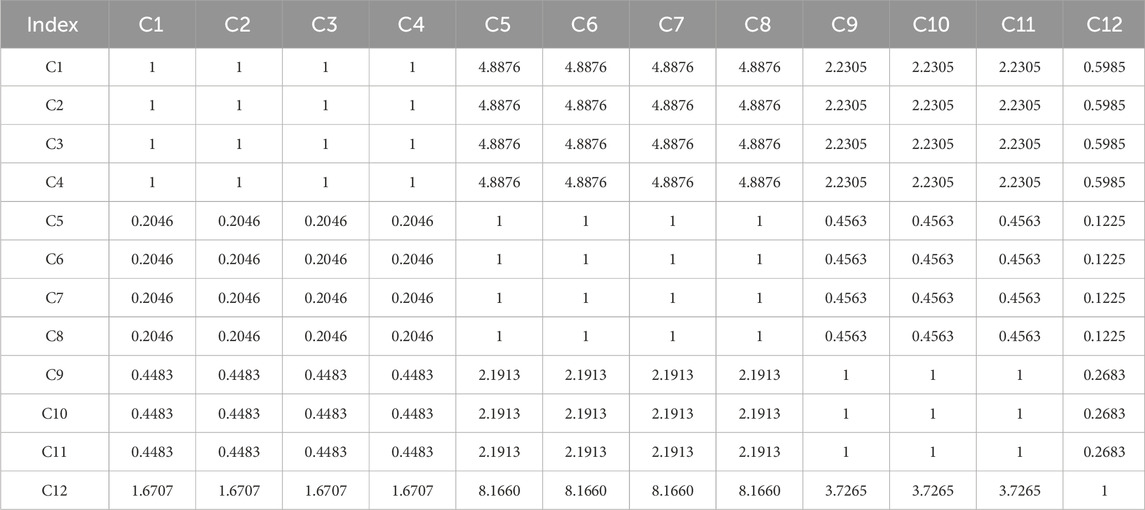
TABLE 6. Quasi-optimum consistent matrix.
Complete the calculation according to the aforementioned method and obtain the calculation results. They are all summarized in Table 7.
6) Calculation of the included angle of the index axis

TABLE 7. Weights of all indexes.
When the weight of each index is determined, the angle between the indexes in the radar chart can be calculated according to Eq. 8. The calculation results of the included angle of the index axis are shown in Table 8. Based on these angles, a radar chart that considers the weights of all indexes can be drawn, as shown in Figure 4 can intuitively show the proportion of importance that each indicator occupies in the whole part. Radar charts provide an intuitive display of multi-dimensional data sets, allowing for the identification of similar values among variables and the detection of outliers. They are particularly effective for highlighting which variables score high or low within a dataset, showcasing performance and strengths. These charts are especially suitable for presenting multiple key features of a dataset, or for comparing these features against standard values. Generally, radar charts are applicable for comparing multiple data entries across various dimensions.This is mainly due to the calculation of the weights of all indicators using the improved AHP. However, such work still only stays at the level of qualitative analysis and cannot reach the level of quantitative analysis. This is difficult to accept for scientific research. Simultaneously, the best type of asphalt concrete type cannot be recommended based on these results. Therefore, follow-up work will be continued to make up for this deficiency.

TABLE 8. The included angles between the index axes in the radar chart.
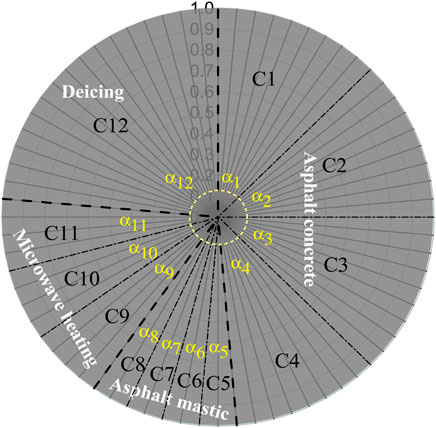
FIGURE 4. Radar chart considering weight value.
4.2 Analysis of radar chart results
The laboratory test data in Table 1 is standardized by Eq. 9. These standardized results are shown in Table 9.
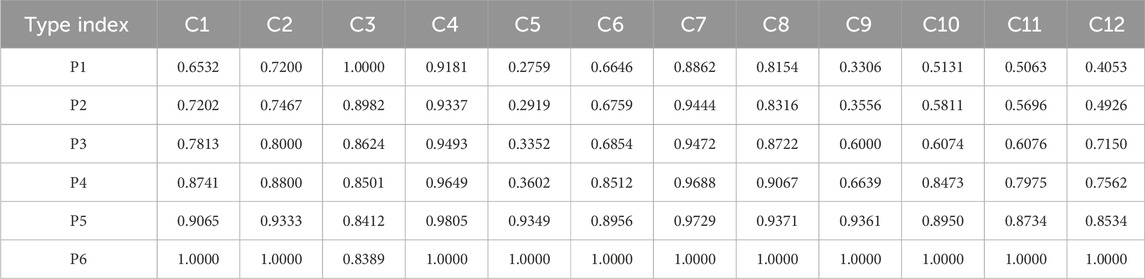
TABLE 9. Data after being standardized.
From the calculation results in Table 9 and included angles between the index axes, the radar chart shown in Figure 5 can be drawn. The comprehensive performances of the six types of asphalt concrete are drawn on five radar charts. This is to allow a clear comparison between the control group and the five modified asphalt concretes. First of all, it can be seen intuitively and clearly from Figure 5 that the comprehensive performances of the five modified asphalt concretes is all better than that of the control group. Additionally, from the observation and comparison of these five radar charts, it is found that when the replacement amount of ACP reaches 80%, the index C5 has increased significantly. Index C5 represents the shear strength of asphalt mastic. Such results indicate that 80% or more of the replacement amount of ACP is very effective for improving the shear strength of asphalt mastic. Index C3 is also very special, and it represents the moisture sensitivity of asphalt concrete. Figure 5 shows that the moisture sensitivity of the control group is the lowest, and the moisture sensitivity of asphalt concrete increases slightly with the increase of the ACP replacement amount. The performance of other indexes of modified asphalt concrete is better than those of the control group and with the increase in the amount of ACP replacement, the performances of modified asphalt concrete are getting better and better. However, all these comparisons and analyses only stay at the level of qualitative analysis. Such results are far from meeting the requirements of a scientific research. Therefore, in the next step we will focus on making this research reach the level of quantitative analysis.
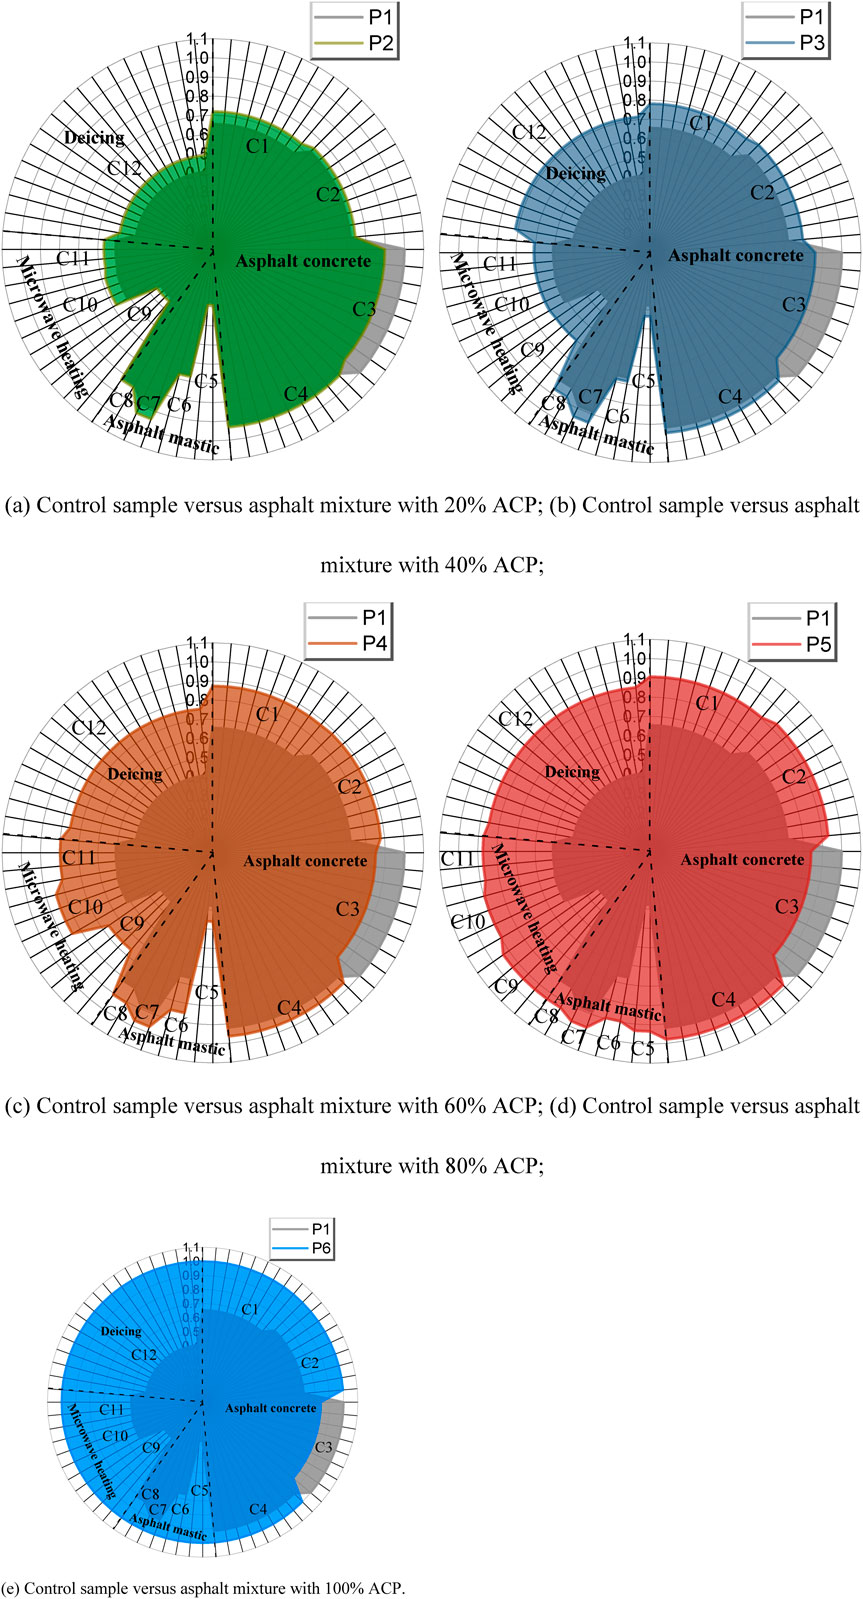
FIGURE 5. (Continued). The radar charts for six types of asphalt mixture.
In order to get the exact ranking of all types of asphalt mixture, the results of Zp are calculated according to Eqs 13–16. The results are as follow:
Z1 = [z11, z12] = [0.4971, 0.9438]; Z2 = [z21, z22] = [0.5238, 0.9633];Z3 = [z31, z32] = [0.6235, 0.9857]; Z4 = [z41, z42] = [0.7279, 0.9911];Z5 = [z51, z52] = [0.8475, 0.9985]; Z6 = [z61, z62] = [0.1000, 0.9983].
According to the results of Zi, fi can be easily calculated according to Eq. 17. The calculation results are summarized in Table 10.

TABLE 10. The calculation results of fi.
From Table 10, it can be concluded that the ranking of fi is f6˃f5˃f4˃f3˃f2˃f1. From the perspective of comprehensive performance, the larger the replacement amount of ACP is, the better the performance of asphalt concrete is. The comprehensive performance of the asphalt concrete with 100% ACP replacement amount was about 46% higher than that of the control group. The comprehensive performance of asphalt concrete with the least 20% ACP replacement amount is also about 4% higher than that of the control group. Certainly, such conclusions are based on the evaluation system and evaluation model of this research. This is not a fixed conclusion. Readers can modify this model according to their focus and perspective, and they may get different conclusions. This also reflects that the purpose and original intention of this research is to find and establish a flexible and hierarchical evaluation system for the comprehensive performance of asphalt concrete. Such an evaluation system can reduce the influence of human factors on conclusions and is more objective, convenient and scientific.
5 Summary
In this study, ACP was used to partly replace mineral powder to improve deicing efficiency of asphalt concrete under microwave heating. In the laboratory, the twelve key indexes of these different types of asphalt concrete were studied and a large amount of data was obtained. Under the premise of only considering the weight of each index, it is very difficult to compare and analyze the comprehensive performance of these different types of asphalt concrete. In order to solve this problem, the improved AHP was used to determine the weight of each index, and then the radar chart method was used to qualitatively and quantitatively analyze the comprehensive performance of different types of asphalt concrete. The conclusions obtained are as follows:
• From the calculation results of the model, the rank of fi representing the comprehensive performance of each type of asphalt concrete can be obtained as f6 > f5 > f4 > f3 > f2 > f1. Based on this result, it can be easily recommended that the type of asphalt concrete that meets the expected requirements is an asphalt concrete with 100% ACP replacement amount.
• The established comprehensive comparison and analysis model of different types of asphalt concrete performance has proved feasible and effective through the application of this research. However, the object of this article is specific, and the factors considered are relatively targeted.This research process and results can provide a new idea and reference for resolution of similar problems in the future.
Data availability statement
The raw data supporting the conclusion of this article will be made available by the authors, without undue reservation.
Author contributions
JB: Conceptualization, Data curation, Formal Analysis, Funding acquisition, Investigation, Methodology, Software, Writing–original draft, Writing–review and editing, Supervision. QZ: Project administration, Resources, Supervision, Validation, Visualization, Writing–original draft, Writing–review and editing, Methodology.
Funding
The author(s) declare that no financial support was received for the research, authorship, and/or publication of this article.
Acknowledgments
The authors thank the Chang’an university for providing materials and friendly environment to conduct this research study.
Conflict of interest
The authors declare that the research was conducted in the absence of any commercial or financial relationships that could be construed as a potential conflict of interest.
Publisher’s note
All claims expressed in this article are solely those of the authors and do not necessarily represent those of their affiliated organizations, or those of the publisher, the editors and the reviewers. Any product that may be evaluated in this article, or claim that may be made by its manufacturer, is not guaranteed or endorsed by the publisher.
Supplementary material
The Supplementary Material for this article can be found online at: https://www.frontiersin.org/articles/10.3389/fenrg.2024.1375653/full#supplementary-material
References
Bianchin, M., Külkamp-Guerreiro, I., Oliveira, C., Contri, R. V., Guterres, S. S., and Pohlmann, A. R. (2015). Radar charts based on particle sizing as an approach to establish the fingerprints of polymeric nanoparticles in aqueous formulations. J. Drug Deliv. Sci. Technol. 30, 180–189. doi:10.1016/j.jddst.2015.10.015
Bostancioğlu, M., and Oruç, Ş. (2015). Effect of activated carbon and furan resin on asphalt mixture performance. Road Mater. Pavement Des. 17 (2), 512–525. doi:10.1080/14680629.2015.1092465
Chen, B., Dong, F., Yu, X., Zheng, C., Guo, Y., and Zu, Y. (2023). Research on evaluation method of asphalt mixture workability based on minimum mixing energy consumption. Constr. Build. Mater. 389 (2023), 131760. doi:10.1016/j.conbuildmat.2023.131760
Chen, Y., Chen, X., Li, Z., and Lin, Y. (2010). Method of radar chart comprehensive evaluation with uniqueness feature. Trans. Beijing Inst. Technology 30 (12), 1409–1412.
Chinese Standard (2011). Standard test method of bitumen and bituminous mixture for highway engineering in China. JTG E20-2011. Beijing, China: General Administration of Quality Supervision, Inspection and Quarantine of the People’ s Republic of China.
Darko, A., Chan, A., Ameyaw, E., Owusu, E. K., Pärn, E., and Edwards, D. J. (2018). Review of application of analytic hierarchy process (AHP) in construction. Int. J. Constr. Manag. 19 (5), 436–452. doi:10.1080/15623599.2018.1452098
Ding, L., Wang, X., Cui, X., Zhang, M., and Chen, B. (2020). Development and performance research of new sensitive materials for microwave deicing pavement at different frequencies. Cold Regions ence Technol. 181, 103176. doi:10.1016/j.coldregions.2020.103176
Gao, J., Guo, H., Wang, X., Wang, P., Wei, Y., Wang, Z., et al. (2019). Microwave deicing for asphalt mixture containing steel wool fibers. J. Clean. Prod. 206, 1110–1122. doi:10.1016/j.jclepro.2018.09.223
Guo, H., Wang, Z., Huo, J., Wang, X., Liu, Z., and Li, G. (2020). Microwave heating improvement of asphalt mixtures through optimizing layer thickness of magnetite and limestone aggregates. J. Clean. Prod. 273, 123090. doi:10.1016/j.jclepro.2020.123090
Ho, W., and Ma, X. (2018). The state-of-the-art integrations and applications of the analytic hierarchy process. Eur. J. Operational Res. 267, 399–414. doi:10.1016/j.ejor.2017.09.007
Hu, X., Dai, K., and Pan, P. (2019). Investigation of engineering properties and filtration characteristics of porous asphalt concrete containing activated carbon. J. Clean. Prod. 209, 1484–1493. doi:10.1016/j.jclepro.2018.11.115
Ishizaka, A., and Labib, A. (2011). Review of the main developments in the analytic hierarchy process. Expert Syst. Appl. 38, 14336–14345. doi:10.1016/j.eswa.2011.04.143
Jahanbakhsh, H., Karimi, M., Jahangiri, B., and Nejad, F. M. (2018). Induction heating and healing of carbon black modified asphalt concrete under microwave radiation. Constr. Build. Mater. 174, 656–666. doi:10.1016/j.conbuildmat.2018.04.002
Kalonia, C., Kumru, O., Kim, J., Middaugh, C. R., and Volkin, D. B. (2013). Radar chart array analysis to visualize effects of formulation variables on IgG1 particle formation as measured by multiple analytical techniques. J. Pharm. Sci. 102, 4256–4267. doi:10.1002/jps.23738
Karimi, M., Jahanbakhsh, H., Jahangiri, B., and Moghadas Nejad, F. (2018). Induced heating-healing characterization of activated carbon modified asphalt concrete under microwave radiation. Constr. Build. Mater. 178, 254–271. doi:10.1016/j.conbuildmat.2018.05.012
Kavussi, A., Karimi, M., and Dehaghi, E. (2020). Effect of moisture and freeze-thaw damage on microwave healing of asphalt mixes. Constr. Build. Mater. 254, 119268. doi:10.1016/j.conbuildmat.2020.119268
Kong, Y., Chen, J., Zhang, J., Ren, X., and Ma, L. (2013). Application of three-scale ahp method in nuclear emergency decision making. Math. Pract. Underst. 43 (9), 109–114.
Lei, J., Zheng, N., Luo, F., and He, Y. (2020). Purification of automobile exhaust gas by activated carbon supported Fe3+ modified nano-TiO2 and its application on asphalt pavement. Road Mater. Pavement Des. 1, 2424–2440. doi:10.1080/14680629.2020.1763831
Liu, H., Liu, A., and Zhang, B. (2008). A fuzzy comprehensive evaluation method of maintenance quality based on improved radar chart. Isecs Int. Colloquium Comput. Commun. Control, Manag. doi:10.1109/CCCM.2008.208
Liu, Z., and Wang, Y. (2019a). Laboratory research on asphalt mastic modified with activated carbon powder: rheology, microstructure and adhesion. Road Mater. Pavement Des. 1, 1424–1441. doi:10.1080/14680629.2019.1691043
Liu, Z., Xu, Y., Wang, Y., and Luo, S. (2019b). Engineering properties and microwave heating induced ice-melting performance of asphalt mixture with activated carbon powder filler. Constr. Build. Mater. 197, 50–62. doi:10.1016/j.conbuildmat.2018.11.094
Liu, Z. M., and Sun, L. J. (2024). “Rheological behavior evaluation of activated carbon powder modified asphalt,” in Advances in functional pavements (Boca Raton, Florida, United States: CRC Press), 106–110.
Osborne, T., and Hutcheson, W., 1989, Asphalt compounds and method for asphalt reconditioning using microwave radiation.
Saaty, T. L. (1980). The analytical hierarchy process: planning, priority setting, resource allocation. New York: McGraw-Hill.
Seyrek, E., Yalçin, E., Yilmaz, M., Vural Kök, B., and Arslanoğlu, H. (2020). Effect of activated carbon obtained from vinasse and marc on the rheological and mechanical characteristics of the bitumen binders and hot mix asphalts. Constr. Build. Mater. 240, 117921. doi:10.1016/j.conbuildmat.2019.117921
Shin, E., Kim, E., Lee, J., and Kang, J. K. (2020). Assessment of the engineering conditions of small dams using the analytical hierarchy process. Iran. J. ence Technol. Trans. Civ. Eng. 2020, 1297–1305. doi:10.1007/s40996-020-00456-z
Trigos, L., Gallego, J., and Escavy, J. (2020). Heating potential of aggregates in asphalt mixtures exposed to microwaves radiation. Constr. Build. Mater. 230, 117035–117112. doi:10.1016/j.conbuildmat.2019.117035
Wang, S., Hou, L., Lee, J., and B.u., X. (2017). Evaluating wheel loader operating conditions based on radar chart. Automation Constr. 84, 42–49. doi:10.1016/j.autcon.2017.08.020
Wang, Y., Liu, Z., and Hao, P. (2019a). Investigation on mechanical and microwave heating characteristics of asphalt mastic using activated carbon powder as electro-magnetic absorbing materials. Constr. Build. Mater. 202, 692–703. doi:10.1016/j.conbuildmat.2019.01.050
Wang, Z., He, Z., Wang, Z., and Ning, M. (2019b). Microwave deicing of functional pavement using sintered magnetically separated fly ash as microwave-heating aggregate. J. Mater. Civ. Eng. 31 (7), 04019127. doi:10.1061/(asce)mt.1943-5533.0002771
Wang, Z., Wang, H., An, D., Ai, T., and Zhao, P. (2016). Laboratory investigation on deicing characteristics of asphalt mixtures using magnetite aggregate as microwave-absorbing materials. Constr. Build. Mater. 124, 589–597. doi:10.1016/j.conbuildmat.2016.07.137
Xiao, Y., Wan, M., Jenkins, K., Wu, S. P., and Cui, P. Q. (2017). Using activated carbon to reduce the volatile organic compounds from bituminous materials. J. Mater. Civ. Eng. 29 (10), 04017166. doi:10.1061/(asce)mt.1943-5533.0002024
Keywords: asphalt concrete, deicing, microwave heating, improved AHP, radar chart method
Citation: Bi J and Zhang Q (2024) A comprehensive evaluation of asphalt concrete modified with ACP based on improved AHP and radar chart method. Front. Energy Res. 12:1375653. doi: 10.3389/fenrg.2024.1375653
Received: 24 January 2024; Accepted: 05 February 2024;
Published: 16 February 2024.
Edited by:
Meng Jia, Shandong University of Science and Technology, ChinaCopyright © 2024 Bi and Zhang. This is an open-access article distributed under the terms of the Creative Commons Attribution License (CC BY). The use, distribution or reproduction in other forums is permitted, provided the original author(s) and the copyright owner(s) are credited and that the original publication in this journal is cited, in accordance with accepted academic practice. No use, distribution or reproduction is permitted which does not comply with these terms.
*Correspondence: Jiefu Bi, YmlqaWVmdUBjaGQuZWR1LmNu