 Seungpil Jung
 Kyungbook Lee
- 1China Business Division, SK Earthon Co., Ltd., Seoul, Republic of Korea
- 2Department of Geoenvironmental Sciences, Kongju National University, Gongju-si, Chungnam, Republic of Korea
- 3Yellow Sea Institute of Geoenvironmental Sciences, Kongju National University, Gongju-si, Chungnam, Republic of Korea
Introduction: Carbon capture and storage (CCS) is important for achieving net-zero carbon emissions. However, although the current geological storage capacity stands at approximately 3,000 Gt-CO2, the formation pressure increases with CO2 injection, imposing severe constraints on capacity from a geomechanical perspective. This study numerically examined nine cases (combinations of three fracture pressures and three aquifer radius factors) through sensitivity analysis to quantify the effects of these parameters on CO2 injection mass and storage capacity.
Methods: The CO2 injection mass was determined as the cumulative CO2 injected until the formation pressure reached a specified fracture pressure. Storage capacity was defined as the amount of CO2 enclosed within the reservoir based on a fill-and-spill analysis encompassing 200 years after the start of injection (2230).
Results: Based on the sensitivity analysis, the aquifer radius had a greater impact on the CO2 injection mass and storage capacity than the fracture pressure. A sufficiently high aquifer radius factor can compensate for the capacity limitations imposed by a low fracture pressure. For the lowest fracture pressure (20.95 MPa), considering a safety factor of 0.8, the CO2 injection mass increased approximately 5.5 times, from 3.2 to 17.6 Mt-CO2, depending on the aquifer radius factor ranging from 2 to 7.
Discussion: Therefore, geological sites with high aquifer radius factors and low fracture pressures were preferred over those with low aquifer radius factors and high fracture pressures. Nevertheless, when considering space-limited capacity, storage efficiency, defined as the ratio of injected to stored CO2, tends to be higher (approximately 80%) when both parameters are low. The scenario featuring the highest aquifer radius factor and fracture pressure reached an injection mass of 68.9 Mt-CO2. However, the storage efficiency was only 23% due to space constraints. This study provides key insights into two pivotal parameters from pressure- and space-limited perspectives, which must be collectively considered to reliably evaluate CCS projects.
1 Introduction
Numerous efforts have been made to reduce greenhouse gas emissions in response to climate change. The Paris Agreement, a landmark strategy to combat climate change, established a strategic target to limit global warming to below 2°C by 2050 and, ideally, 1.5°C (UNFCC, 2015; Wang et al., 2023). To achieve this target, the Paris Agreement has outlined specific milestones, such as dates for reaching peak emissions and net-zero emissions. The Intergovernmental Panel on Climate Change has proposed various illustrative mitigation pathways (IMPs) based on feasible scenarios (IPCC, 2018). IMPs illustrate the relationship between emission reduction measures and the net amount of projected emissions. Most IMPs assume the adoption of carbon capture and storage (CCS) strategies for the removal of carbon dioxide (CO2).
CCS can effectively mitigate CO2 emissions originating from point sources within fossil-based energy industries. Furthermore, CCS is the foundation for negative emission methods, such as direct air CCS and bioenergy with CCS (Fuss et al., 2018; Haszeldine et al., 2019; Tatarewicz et al., 2021). The geological storage capacity has been deemed adequate to meet the goals outlined in the IMPs. The technical geological storage capacity is approximately 3,000 Gt-CO2, surpassing the quantities defined in the IMPs, which average approximately 6 Gt-CO2 per year until 2050 (Zahasky and Krevor, 2020; GCCSI, 2021).
Despite its large technical capacity for geological storage, CCS has progressed slowly (Martin-Roberts et al., 2021). Most dedicated CO2 storage projects have relied on structural trapping, a mature technology developed by the petroleum exploration and production industry. Structural trapping is the most reliable mechanism for geological storage because it ensures containment integrity and accurate storage volume. This approach is also practical for post-injection monitoring, which is essential for certifying the storage mass and achieving certified emission reductions. Structural trapping restricts the review area of the structure and offers a highly accurate storage mass.
The overpressure generated by CO2 injection can result in the failure of CO2 sequestration projects and even man-made disasters such as seal rock fracturing, formation deformation, microseismicity, and earthquakes. Interferometric synthetic aperture radar observations revealed formation deformation in the In Salah project following CO2 injection into geological storage (Goertz-Allmann et al., 2014). Moreover, an earthquake has been reported after water injection in a geothermal project in Pohang, Korea (Ellsworth et al., 2019). Although this was not a CO2 injection project, this case of failed pressure management during fluid injection has implications for CCS projects.
The fracture pressure and aquifer size are the primary parameters affecting the injection constraint. The fracture pressure of the formation determines the pressure threshold during CO2 injection, whereas the aquifer size influences the rate of formation pressure increase due to pressure dissipation to the entire aquifer. The combination of fracture pressure and aquifer size determines the amount of CO2 that can be injected without encountering geomechanical problems. Particularly, storage capacity depends on the aquifer boundary and size. Aquifers can be categorized into open, closed, and semi-closed systems (see Section 2.2). In closed and semi-closed aquifers, pressure constrains the storage capacity, as experienced in the Snøhvit project, which involves a compartmentalized aquifer (Grude et al., 2014).
Dynamic simulation studies have been conducted to estimate the CO2 injection volume under the specific geological conditions of a target site, including sensitivity analyses (Bergmo et al., 2011; Le Guenan and Rohmer, 2011; Cameron and Durlofsky, 2012; Buscheck et al., 2017; Jung, 2023). Most sensitivity analyses have focused on the effects of aquifer characteristics (e.g., aquifer permeability, aquitard permeability, relative permeability, heterogeneity, aquifer dip, and residual water saturation) (Goater et al., 2013; Sarkarfarshi et al., 2014). Some studies have also performed sensitivity analysis on the impact of aquifer size (Zhou et al., 2008; Okwen et al., 2014). In particular, Zhou et al. analyzed the behavior of pressure build-up and time in response to arbitrary changes in injection volume for closed and semi-closed aquifers. However, the analysis only considered the increase in pressure, assuming the same amount of CO2 injection, and fracture pressure was not considered a constraint on CO2 storage capacity despite the significant influence of injectivity due to fracture pressure on CO2 storage capacity. Furthermore, previous studies did not account for storage efficiency based on space-limited capacity. Many studies are using injection volumes to estimate storage capacity without analyzing injected CO2 plume evolution over time although the storage capacity can be affected by migration and seepage.
In this study, we employed a full factorial design to simultaneously conduct a sensitivity analysis of two geological conditions: fracture pressure and aquifer size. Using dynamic simulations with an analytical aquifer model, we analyzed how fracture pressure and aquifer size impact the amount of CO2 injected and stored. These quantities were evaluated in terms of both pressure- and space-limited capacities. Chapter 2 presents a three-dimensional geological model and its dynamic simulation model, including the aquifer and fracture pressures. In Chapter 3, we examine nine cases based on sensitivity analysis in terms of pressure- and space-limited capacities.
2 Methodology
2.1 Evaluation of CO2 storage capacity
Various definitions of the CO2 storage capacity, including assessment methodologies and specific criteria for determination, have been proposed by renowned research institutes (Bachu et al., 2007; IEAGHG, 2009; Gray, 2010; Blondes et al., 2013). From an industrial standpoint, the CO2 storage resource management system categorizes the CO2 storage capacity based on uncertainty (Frailey et al., 2018). These approaches rely on a volumetric methodology that considers the thickness, area, porosity, and residual water saturation to assess the CO2 storage capacity.
However, this methodology tends to overestimate the actual amount of stored CO2 because it does not account for the effects of pressure-limited and space-limited capacities, as shown in Figure 1 (Szulczewski et al., 2012). In the petroleum industry, one of the main deterrents to oil or gas production is the decrease in reservoir pressure caused by the production of subsurface fluids. In other words, the lack of reservoir pressure constrains the recovery of hydrocarbons. Similarly, during CO2 storage, the injected CO2 fills the limited pore space within the storage site, resulting in an increase in pressure. Therefore, injecting as much CO2 as suggested by the volumetrically evaluated storage capacity is not feasible because the storage capacity is limited by pressure conditions such as fracture pressure. These limiting factors determine the amount of CO2 that can be injected, which is referred to as the pressure-limited capacity.
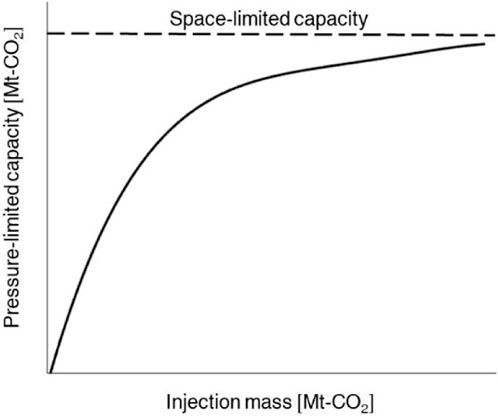
Figure 1. Evaluation of the amounts of CO2 injected and stored using pressure-limited and space-limited capacities.
Even when the pressure increase due to CO2 injection remains below the fracture pressure, the volume of stored CO2 may be confined to the space within a closure, which is defined by the crest and spill point in the anticline trap. Therefore, a trap is essential for confining the injected CO2 to a specific localised area, which is analogous to a typical petroleum-bearing structure. In other words, the space-limited capacity considers the gap between the amount of CO2 injected and CO2 stored.
2.1.1 Trapping mechanisms in a geological structure
CO2 injected into a geological structure can be stored in multiple states, including as free gas, as well as through a variety of stable sequestration mechanisms, such as residual saturation, dissolution, and mineralisation (Figure 2). In the early stages of CCS, structural mechanisms play a dominant role in CO2 trapping. The buoyancy effect causes CO2 to rise to the upper regions of the storage site until the structural or stratigraphic traps encounter cap rock (Figure 2A). In this mechanism, CO2 remains mobile, but geological conditions lead to its accumulation at a specific location compared to other trapping mechanisms. Therefore, assessing the initially trapped CO2 and monitoring its behavior is possible. In this study, this structure-trapping mechanism is a key factor in evaluating the storage capacity because the storage site has an anticlinal structure trap (see Subsection 2.3.1).
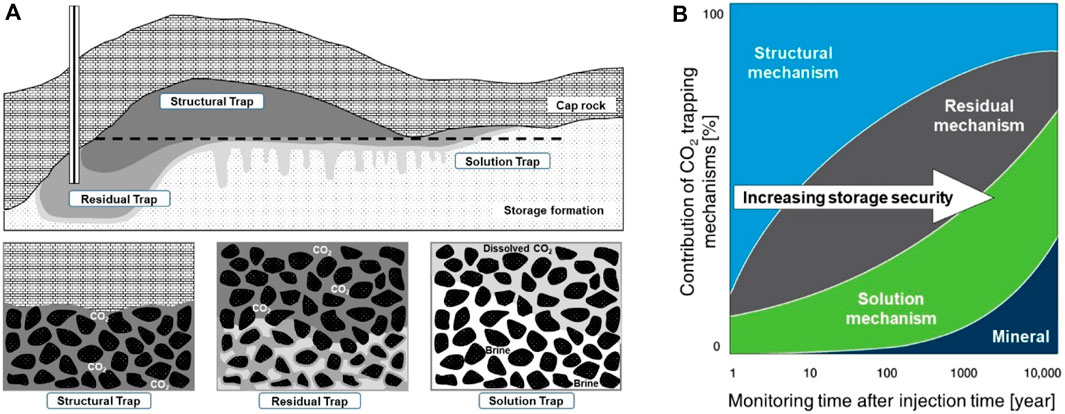
Figure 2. CO2 trapping mechanisms: (A) Key mechanisms, structural, residual, and dissolved CO2, during a relatively short period of hundreds of years (Ismail and Gaganis, 2023) and (B) changes in trapping mechanisms over time (Benson et al., 2005). The horizontal dashed-line in (A) represents the space-limited capacity determined by the spill point in the anticline structural trap.
Residual trapping, also known as capillary trapping, is a physical mechanism for CO2 injection. As CO2 is injected, it displaces the existing water in the pore spaces as it rises. This multiphase fluid displacement occurs when the CO2 pressure surpasses the capillary entry pressure determined by the surface tension between CO2 and water. Although CO2 initially occupies the voids in the form of free gas or supercritical phases, it remains physically immobile until the saturation exceeds the residual saturation (Figure 2A). Residual trapping occurs over a wide area along the pathways of CO2 migration and remains, exhibiting less susceptibility to the mechanical characteristics of rock, such as cap rock integrity or fracture pressure. Therefore, it offers greater storage security compared to the structural mechanism (Figure 2B).
The solution, mineralization, and adsorption mechanisms involve geochemical trapping, as CO2 ceases to exist as a separate phase due to its interaction with water or rocks. These mechanisms offer stable and substantial CO2 storage capacities from a long-term perspective compared with physical mechanisms (Figure 2B). In the case of solubility trapping, CO2 dissolves in the aqueous phase and becomes denser than the surrounding water phase, thereby losing its buoyancy effect during structural trapping and descending vertically, as illustrated in Figure 2A. This mechanism operates most efficiently under subsurface conditions such as low temperature, high pressure, and low salinity. Mineralization and adsorption trapping mechanisms were not considered in this study because they have actively occurred for thousands of years or are limited to specific rock types such as basalt or coal.
In this study, we simultaneously considered two storage capacity concepts using a numerical simulation method. First, the pressure-limited capacity was estimated based on the aquifer radius factor and fracture pressure. Second, the space-limited capacity was analyzed by dividing a few regions based on the spill point in the anticline structural trap in a three-dimensional (3D) model (Jung, 2023).
2.1.2 Geomechanical consideration
This study also considered the pressure-limited capacity caused by the overpressure resulting from CO2 injection. Geomechanical analysis is essential for determining whether to continue CO2 injection, particularly in a closed aquifer. Formation overpressure not only constrains CO2 capacity but is also a root cause of man-made disasters, such as formation deformation, unexpected fracturing, micro-seismic events, and earthquakes. Fracture pressure can be estimated by in situ leak-off experiments and formation integrity test along with theoretical and empirical equations such as Eaton’s, Hubbert’s, and Willis’ methods (Zhang and Yin, 2017). These equations calculate the fracture pressure based on pore pressure, overburden pressure, and Poisson’s ratio. However, regardless of the calculation method, the fracture pressure still retains a certain level of uncertainty because the rock mechanical parameters (e.g., Poisson’s ratio) are typically derived from well logging or seismic data.
Given the importance of geomechanical analysis, integrated methods for analyzing fluid flow using geomechanics have been developed (Gai et al., 2003; Benisch et al., 2020). These coupled models can update porosity and permeability based on geomechanical analysis and simultaneously calculate the effect of rock deformation based on flow analysis, considering the updated porosity and permeability. However, due to their highly non-linear nature, the ability of these systems to solve equations is limited, and they often encounter computational challenges and divergence issues (Jeannin et al., 2007). Fully coupled models demand substantial computational resources due to the complexity of non-linear equations. In contrast, loose-coupled models separately solve two types of equations (fluid flow and geomechanical deformation equations) and iteratively perform coupling processes. Therefore, integrated models are exclusively used for specific topics (e.g., coalbed methane, wellbore stability, and hydraulic fracturing) (Gu and Chalaturnyk, 2005; Dean and Schmidt, 2009; Li et al., 2021; Yoon et al., 2021).
In this study, the pressure threshold for rock fracture coupled with a safety margin was adopted as an alternative, cost-effective method. This method does not account for the geomechanical effect on fluid flow, which is negligible in less elastic formations. The influence of variations in porosity and permeability due to formation deformation on multiphase flow behavior was also neglected. In previous studies, the safety factor was set at 80%–90% of the fracture pressure (Abbaszadeh and Shariatipour, 2018; Li et al., 2019). In this study, the pressure was set to 80% of the threshold fracture pressure.
The fracture threshold pressure was defined as the minimum pressure at which rock fracturing occurs, which is the point at which the CO2 injection ceases, as outlined in previous studies (Bergmo et al., 2011; Buscheck et al., 2017). Ya-nan et al. (2021) quantified the uncertainty in fracture pressure by Monte Carlo simulation and identified a difference of approximately 4.17% between the 0.95 and 0.05 quantiles at a depth of 2,000 m. In this study, based on a default value of 27.57 MPa, a change of ±5% was established as the three-level fracture pressure for sensitivity analysis. Moreover, 80% of the safety factor was applied to the derived pressure. Therefore, the fracture pressure was adjusted to 20.95, 22.05, and 23.15 MPa in the low-, medium-, and high-pressure scenarios, respectively.
2.2 Numerical simulation of CO2 storage in an aquifer
CO2 storage capacity is determined by a combination of factors, including pore volume, the compressibility of rock and brine water, and aquifer size. The most important determinant for a CO2 geological storage site is whether the aquifer system is open or closed. The type of aquifer system is closely related to the aquifer size and thus significantly influences the pressure behavior resulting from CO2 injection into the aquifer.
An open aquifer, as shown in Figure 3A, is defined as an aquifer with a very large size that exhibits pressure behavior similar to that of an infinite aquifer without apparent boundaries. In an open system, the pressure increase around the injection well caused by CO2 injection dissipates into the adjacent external aquifer by relieving the pressure build-up in the aquifer. Therefore, pressure build-up in the aquifer due to CO2 injection occurs slowly over time.
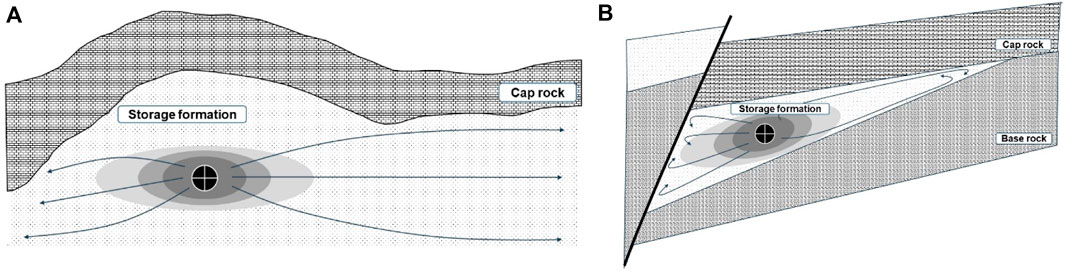
Figure 3. Types of aquifer systems for geological storage: (A) open and (B) closed aquifers.
Conversely, a closed aquifer is defined as an aquifer that is compartmentalized by impermeable barriers such as faults or natural heterogeneity, thus preventing fluid flow between the interior and exterior of the aquifer shown in Figure 3B (Zhou et al., 2008). In a closed system, injecting CO2 leads to a rapid increase in aquifer pressure owing to the limitations imposed by the overall size of the system, despite the compressibility of the rock and brine water. This rapid pressure build-up significantly restricts CO2 injectivity and geological CO2 storage capacity. Lastly, a semi-closed system appears compartmentalized like a closed system, but the seal dividing it is not perfectly impermeable, leading to partial pressure dissipation within the system.
Flow models for the simulation of fluid flow behavior in porous media consist of geological properties arranged in grid cells, along with the initial and boundary conditions. Due to their simplicity, the most commonly considered boundary conditions for these models include no flow, constant pressure, and constant rate. However, these boundary conditions are idealized simplifications but take on more complex forms in reality.
Handling these boundary conditions poses significant challenges for flow models that rely on numerical analyses. As the number of grid cells increases and the governing equations become more complex, the computational demands increase exponentially, resulting in longer computation times. Therefore, constructing a full-grid model for open or large closed aquifers is often infeasible due to limitations in the number of grid cells.
The field of petroleum engineering has long been addressing the aforementioned limitations. Particularly, previous studies have proposed the delineation of areas of interest to facilitate the simulation of the behavior of multiple phases in hydrocarbon-bearing reservoir areas. Moreover, various boundary treatment methods have been applied to aquifer regions where hydrocarbons do not flow.
In flow models, three primary approaches are employed to account for aquifers. First, a full grid model can be employed for a sufficiently large area, where the aquifer is represented by simplified boundary conditions, such as constant terminal pressure, constant terminal rate, or the absence of flow. Second, grid cells are created only for the area of interest where actual fluid flow occurs, and a pore volume multiplier is applied to the edge cells, assuming that large aquifers are connected at the boundary cells. Finally, the boundary region of the numerical model assumes a homogeneous virtual aquifer, and the external boundary conditions are applied. The governing equations are solved using analytical methods, and the solutions are applied to the boundary cells. The advantages and disadvantages of each approach are summarized in Table 1.
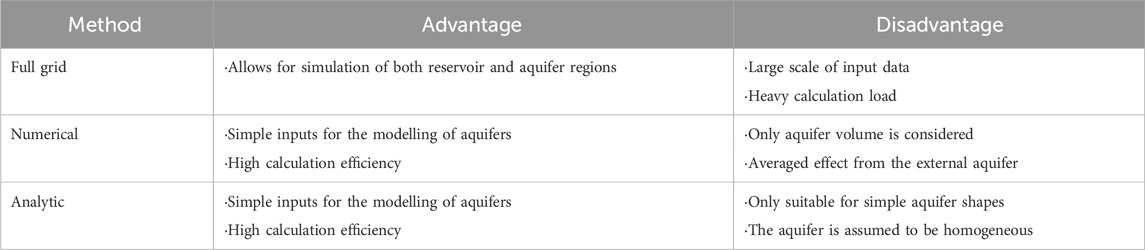
Table 1. Comparisons between representative methods for considering external aquifers in numerical simulations.
Analytical aquifer models have been used to analyze the pressure behavior of reservoirs caused by water influx long before the advancement of computers. Van Everdingen and Hurst (1949) introduced a method for calculating an exact analytical solution to the diffusivity equation by assuming a constant water influx rate over a finite time interval. The decrease in pressure at the boundary between the reservoir and aquifer was then estimated.
Building upon this work, Carter and Tracy (1960) proposed a simplified approximation method by improving the van Everdingen–Hurst approach. In this improved method, the solutions from previous time intervals were superimposed and computed to obtain the solution at a specific time (Eq. 1). This improved the efficiency and convenience of the calculations by applying the Laplace transformation.
where
This method was improved to include the bottom aquifer by considering the vertical axis in the diffusivity equation (Eq. 2), as suggested by Coats (1962).
where
Fetkovich (1971) developed an analytical aquifer method based on the productivity index concept. The model is based on material balance, the productivity index in the semi-steady state, and the aquifer pressure. The primary advantage of this method is its simplicity, as it neglects the effects of the transient period and adopts a productivity index as a function of aquifer geometry. The flow regime, utilized parameters, and applications of each analytical aquifer analysis method are summarized in Table 2.
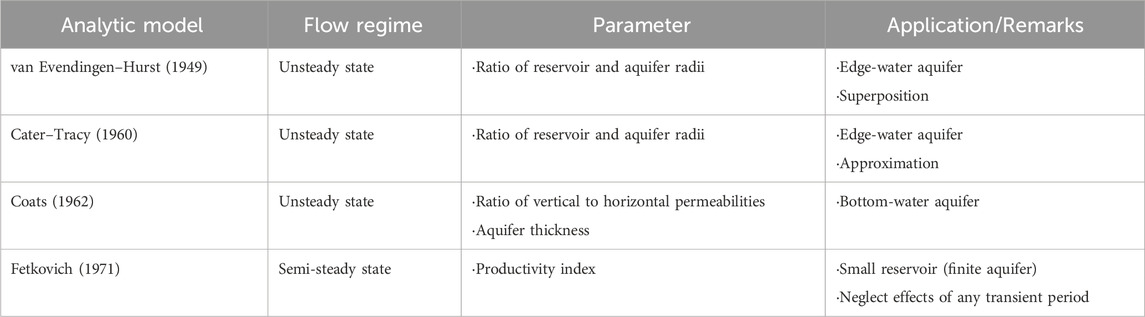
Table 2. Summary of flow regime, parameters, and applications of various analytical aquifer models.
Research has been made to apply these concepts to CO2 geological storage. One such example involves extending the concept of radial flow between the reservoir and the surrounding apparent aquifer. This concept has been applied to the geological CO2 storage area, referred to as the “storage aquifer,” and the external “regional aquifer,” as illustrated in Figure 4 (Thibeau and Adler, 2023).
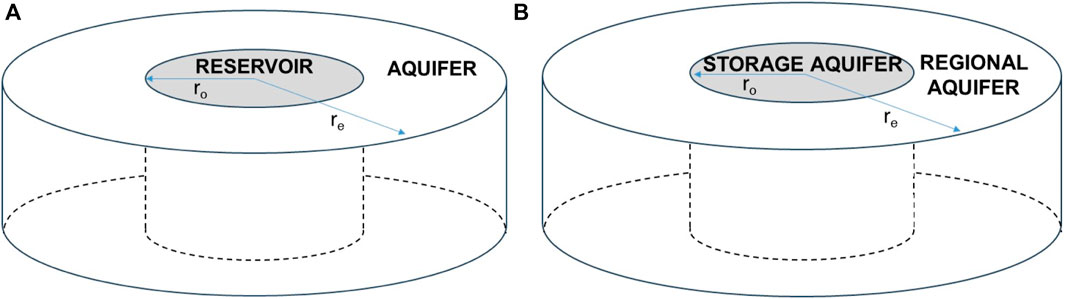
Figure 4. Comparison of the concept of aquifer systems: (A) reservoir–aquifer in petroleum engineering and (B) storage aquifer–regional aquifer in CO2 geological sequestration.
Among the previously discussed techniques, analytical aquifer models offer a more convenient approach for sensitivity analysis compared to numerical aquifer models because analytical models allow for the aquifer radius factor to be changed while keeping the other parameters constant. In this study, a Carter–Tracy analytical aquifer was integrated as a regional aquifer into the numerical storage aquifer of the constructed static model, thus effectively increasing the aquifer size. The aquifer radius factor, which is similar to the influence function used in petroleum engineering, is defined as the ratio of the regional aquifer radius to the storage aquifer radius. This approach simplifies the problem by assuming a homogeneous aquifer, thereby foregoing the challenges of accurately characterizing the permeability distribution across the entire aquifer. Furthermore, despite being an approximation, the Carter–Tracy solution is highly practical and widely used in numerous studies. In this study, the Carter–Tracy aquifer model was employed, including a sensitivity analysis of the impact of the aquifer size using the aquifer radius factor. This allowed for sensitivity analysis of the aquifer radius factor while maintaining other control variables constant.
2.3 Design of the sensitivity analysis
Volumetric approaches mainly focus on the size of the geological storage. The remaining non-volumetric parameters are typically addressed using an efficiency factor that consolidates various factors, including aquifer heterogeneity, injection schemes, pressure constraints, and operational conditions, among other considerations. Dynamic simulation is an effective tool for investigating the effects of site-specific dynamic factors, including aquifer boundaries, geological properties, and operational conditions (Gorecki et al., 2015). Additionally, dynamic simulations can be used to analyze spatial CO2 plume evolution over time. In this study, CO2 injection was simulated until the reference formation pressure reached the threshold pressure of formation fracturing, and its behavior for 200 years from the start of the injection was simulated.
2.3.1 Static and dynamic simulation models
Table 3 summarizes the static conditions used in the numerical simulations. The 3D heterogeneous model (Figure 5A) consists of approximately 1.68 million grids, with the top of the storage structure being located at 1,740 m. The model was divided into the two regions shown in Figure 5B for fill-and-spill analysis. In this study, the structure shown in Figure 5B, representing the space within the closure, was treated as having a space-limited capacity. Based on the trapping mechanism shown in Figure 2, the injected CO2 tends to initially fill the upper portion of the anticline trap in Figure 5B. Once the water within the closure was saturated with CO2, it gradually moved almost vertically downward through the dissolution mechanism. Unlike structure or residual trapping, this process occurs gradually over the long term (Figure 2B). In other words, the CO2 that was initially present in the structure migrated to the external aquifer, as shown in Figure 2A. Therefore, the amount of CO2 within a structure is crucial for estimating the storage capacity in terms of space-limited capacity.
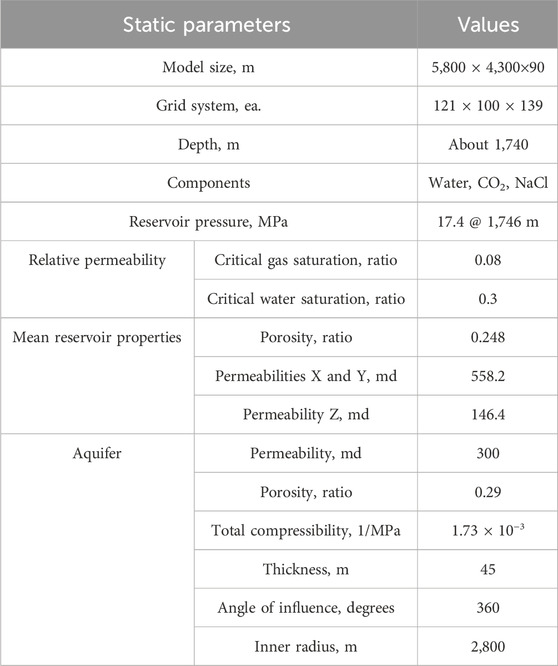
Table 3. Description of 3D simulation model.
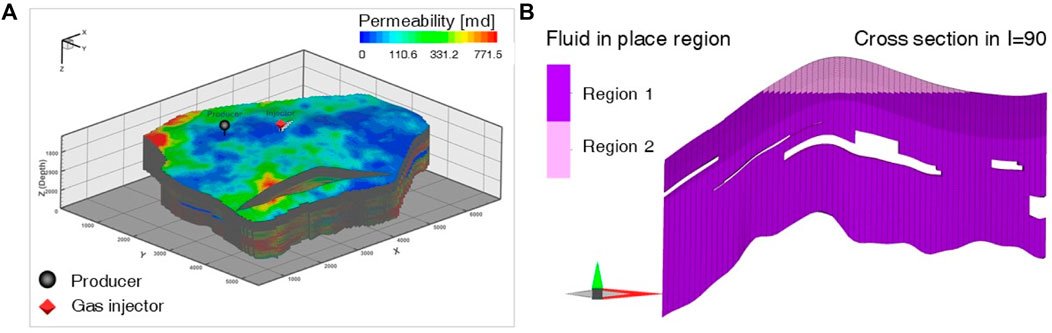
Figure 5. Geological model used in this study: (A) 3D permeability model and (B) two-dimensional view of the region. Regions 1 and 2 indicate the outside and inside of the storage structure, respectively. Storage capacity was determined as the amount of CO2 in region 2 in 2230.
In this model, the upper part above the spill point (region 2) defines the storage capacity, whereas the other region is neglected. Three components (water, CO2, and NaCl) were considered to mimic the CO2 storage in the aquifer.
Table 4 lists the operational conditions of the CO2 injection well. The maximum allowable injection rate in the horizontal injection well was 1.89 Mt/year. It was assumed that CO2 would be injected from 1 January 2030 until the fracture pressure limit was reached and would be monitored until 31 December 2230. The storage capacity was estimated in the year 2230, regardless of the CO2 injection period, because both the movement of CO2 and changes in the storage mechanisms were stabilized at this time point (See Section 3.1). For dynamic simulation, the CO2STORE module in ECLIPSE 300 (Schlumberger) was employed. Pruess et al. (2004) compared several reservoir simulators, including ECLIPSE from Schlumberger and GEM from CMG, and concluded that all simulators could be applied to CO2 storage.

Table 4. Conditions for the CO2 injection well.
2.3.2 Sensitivity parameters
In this study, only the aquifer radius factor and fracture pressure were considered independent variables, whereas the geological properties in the dynamic simulation were maintained constant. Two uncontrollable parameters were evaluated at three levels (lower, baseline, and higher values). A full factorial design was used for sensitivity analysis to analyze the interactions between these two parameters.
Table 5 presents the nine simulation cases considered in this study. The aquifer radius factors were 2, 3.5, and 7, and the fracture pressures were 20.95, 22.05, and 23.15 MPa. Case 5 was used as the reference case, featuring the base values for the aquifer radius factor and fracture pressure. Figure 6 shows the overall workflow of sensitivity analysis to evaluate the pressure- and storage-limited capacities. After the pressure-limited capacity is determined using fracture pressure constraint in Table 5 during the injection period, the storage-limited capacity can be estimated using the inside region of anticline structure in Figure 5B during the monitoring period.
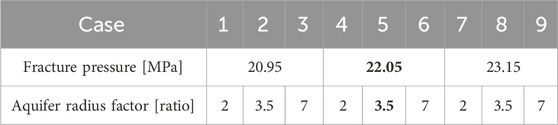
Table 5. Simulation cases for the sensitivity analysis of aquifer radius factor and fracture pressure (the reference case is indicated in bold).
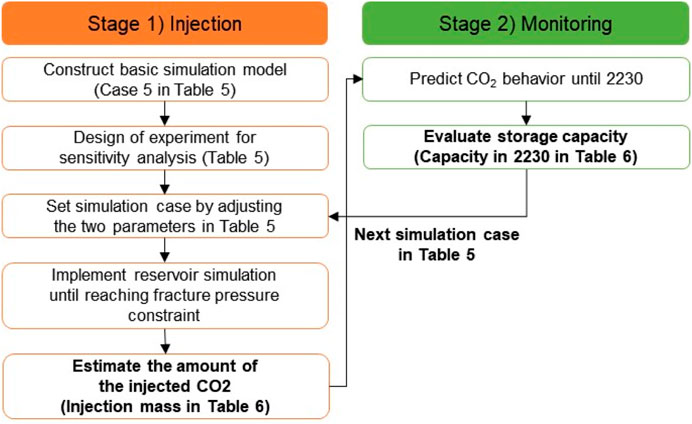
Figure 6. Workflow of sensitivity analysis to evaluate the pressure- and storage-limited capacities.
3 Results and discussion
3.1 Reference case
For the reference case (Case 5 in Table 5), the aquifer radius factor and fracture pressure were set as their base values of 3.5 and 22.05 MPa, respectively. In Case 5, CO2 injection was terminated on 1 March 2037, when the formation pressure reached 22.05 MPa (Figure 7A). During the injection period, a fan-shaped CO2 plume formed at a high injection rate of 1.89 Mt/year (Table 4). Regarding the storage mechanism, the injected CO2 primarily existed in the supercritical phase, particularly in the mobile phase (∼75.8%) during the injection period (Figure 7C). Only 5.1% of the CO2 was dissolved in water.
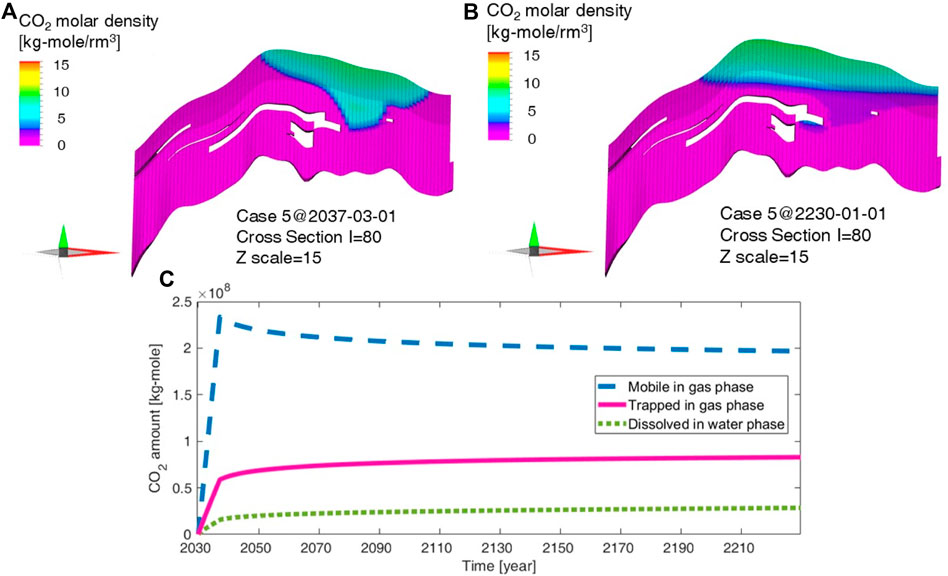
Figure 7. CO2 behaviour during the injection and monitoring periods in the default case (Case 5 in Table 5). Cross sections during the (A) injection and (B) monitoring periods; (C) Analysis of the storage mechanism. Both mobile and trapped CO2 indicate free gas in pore spaces; however, due to the relative permeability, the gas cannot move until the gas saturation reaches 8% (Table 3).
After the injection was completed, the injected CO2 moved to the upper part of the structure via buoyancy. The CO2 plume in the year 2230 was stabilized in the fan-shaped plume area by the trapped CO2 (Figure 7B), which was formed at the end of the injection period (Figure 7A). Additionally, the CO2 migrated out horizontally at the top of the structure. The year 2230 was selected as a reasonable time to end monitoring and evaluate the storage capacity because the CO2 storage mechanism can be considered stable at this time, as shown in Figure 7C.
Geological structures can act as reservoirs for stable CO2 sequestration (Figures 2A, 5B). Regardless of the mechanism of CO2 storage after injection, the injected CO2 can be secured in the geological structure, improving the accuracy of the sequestrated CO2 mass. Therefore, in this study, CO2 capacity was defined as the CO2 mass existing in a region of the geological structure through mobile, residual saturation, and dissolution mechanisms. The region assessed for storage capacity was defined as the inside of the closure, with a vertical depth ranging from the top of the crest to the spill point, as shown in Figure 5B. After confirming the typical CO2 behavior shown in Figure 2, a sensitivity analysis was performed in Section 3.2, based on the parameters outlined in Table 5.
3.2 Sensitivity analysis of aquifer radius factor and fracture pressure
3.2.1 Aquifer radius factor (Cases 4 and 6)
The aquifer radius factor substantially impacted the injection mass and storage performance, as shown in Figure 8 and Table 6. As the aquifer radius factor increased from 2 to 7, the CO2 injection mass increased with longer injection periods (Figures 8A, B). For example, in Cases 4 and 6, where the fracture pressure was held at the default value of 22.05 MPa, the difference in the aquifer radius factor led to a 676% increase in injection mass for Case 6 compared to Case 4.
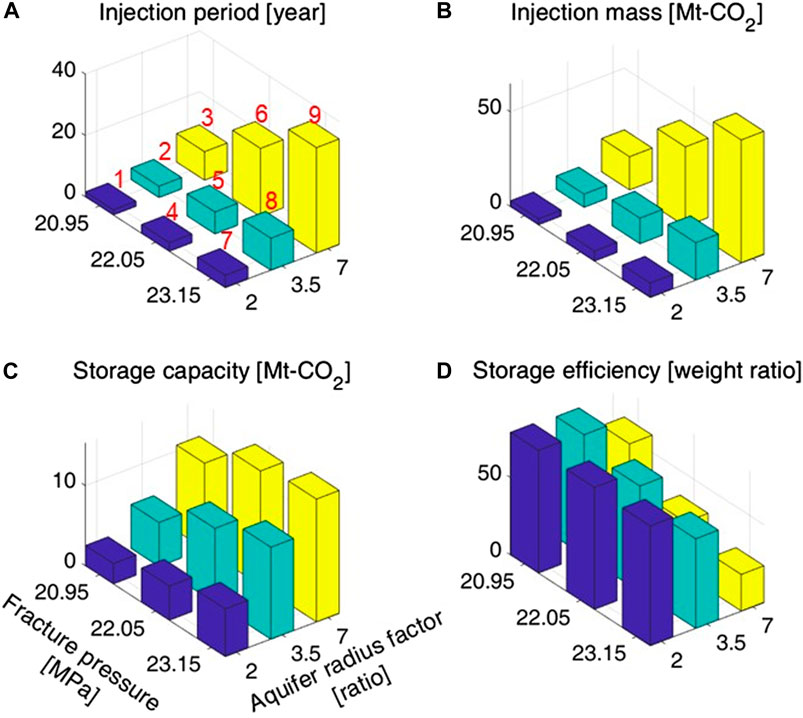
Figure 8. Sensitivity analysis for cases 1–9 in Table 5: (A) injection period, (B) injection mass, (C) storage capacity, and (D) storage efficiency. The numbers in red indicate the case number. The exact values can be found in Table 6.
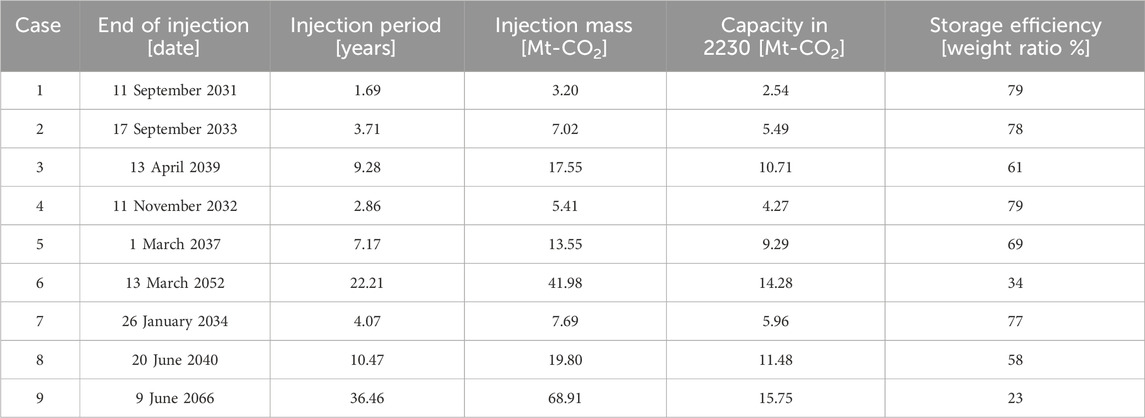
Table 6. Sensitivity analysis results for Cases 1–9 in Figure 8.
Figure 9 shows the pressure increase over time for Cases 4 and 6. Compared with the pressure gradient in Case 6 (large aquifer), that in Case 4 (small aquifer) was steeper. Therefore, the storage capacity increases (Figure 8C) as the aquifer radius factor increases. In the year 2230, Case 4 exhibited a storage capacity of only 4.27 Mt-CO2, whereas Case 6 increased to 14.28 Mt-CO2.
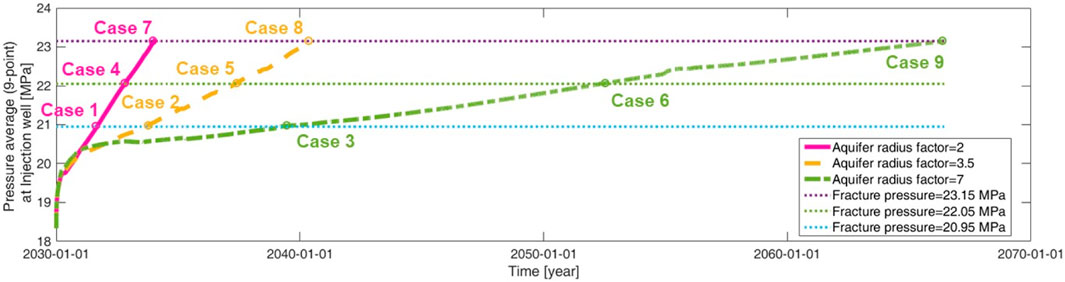
Figure 9. Increase in pressure over time for the smallest aquifer cases (Cases 1, 4, and 7), for the base aquifer cases (Cases 2, 5, and 8), and for the largest aquifer cases (Cases 3, 6, and 9).
However, the storage efficiency, which was evaluated using a fill-and-spill analysis, decreased as the aquifer radius factor increased (Figure 8D). For instance, the injection mass dramatically increased from 5.41 Mt-CO2 in Case 4 to 41.98 Mt-CO2 in Case 6, whereas the storage efficiency decreased from 79% to 34% (Table 6).
3.2.2 Fracture pressure (Cases 2 and 8)
As the fracture pressure, which determines the pressure-limited capacity, increased, the injection mass and storage capacity also increased. However, the storage efficiency decreased (Figure 8; Table 6). The reason for the decrease in storage efficiency is that, as the absolute amount of CO2 injected, the amount of CO2 outside the structure that is not accounted for in the space-limited capacity also increases. For Cases 1 and 7, where the absolute CO2 injection amount is relatively small, an increase in fracture pressure results in a 2%p reduction in storage efficiency. The outcomes of the sensitivity analysis regarding fracture pressure were similar to those of the aquifer radius factor. For example, for Cases 2 and 8, both with an identical aquifer radius factor set to the default value of 3.5, the variation in the injection mass between the two cases was attributed to the discrepancy in the fracture pressure. Specifically, Case 8 exhibited an 182% increase in injection mass compared to Case 2. However, Case 8 exhibited a lower storage efficiency (58%) than Case 2 (78%).
3.2.3 Discussion
As the aquifer size increases, it compensates for capacity limitations caused by low fracture pressures. For the lowest fracture pressure of 20.95 MPa for Cases 1, 2, and 3, Case 3 shows significant improvements in both the injection mass and storage capacity, as shown in Table 5. These improvements are attributed to Case 3, which possesses the highest aquifer radius factor, thereby compensating for the pressure-limited capacity due to the low fracture pressure. Additionally, injection mass and storage capacity were similar in Cases 7 and 2 (Table 6). Although Case 2 had the lowest fracture pressure, all indicators were similar to those of the highest fracture pressure case because of the larger aquifer size. Similar trends were observed in Cases 8 and 3.
In other words, the fracture pressure does not play a significant role in limiting the injection amount for a large aquifer, even in the case of a closed aquifer. For example, Case 3 presented the largest aquifer radius factor and the lowest fracture pressure, whereas Case 7 represented the opposite scenario (Table 5). When comparing these two cases in terms of the injection period and capacity by the year 2230, Case 3 exhibited significant increases of 128% and 80%, respectively, compared with Case 7 (Table 6).
This phenomenon can be attributed to the inverse relationship between the aquifer radius factor and the pressure increase rate, as shown in Figure 9. Although Case 3 exhibited the lowest fracture pressure (20.95 MPa), it reached the pressure constraint later than Case 7, which exhibited the highest fracture pressure (23.15 MPa). Figure 10 illustrates the behavior of CO2 at the end of the injection and monitoring in Case 7, which corresponds to the results of Case 5 in Figures 7A, B. While Case 7 had a higher fracture pressure than Case 3 (Table 5), the steepness of the pressure increase in Case 7 led to the premature termination of the injection by 3 years (Figure 9). This resulted in a reduction in the injection mass (Figures 7A, 10A) and consequently led to a decrease in the storage capacity (Figures 7B, 10B).
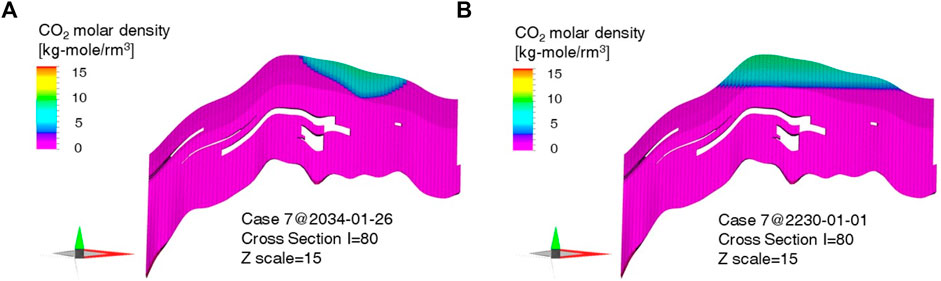
Figure 10. CO2 behaviour during the injection and monitoring periods in case 7 in Table 5: cross sections during the (A) injection period and (B) monitoring period.
However, an increase in the injection mass did not always lead to an increase in the storage capacity, as evidenced by the results of our fill-and-spill analysis. For example, despite Case 9 having an additional injection of 26.93 Mt-CO2 compared to Case 6, the storage capacity increased to only 1.47 Mt-CO2 as of the year 2230 (Table 6). Similarly, whereas a larger aquifer radius factor resulted in increased injection mass, a smaller aquifer radius factor resulted in higher efficiency. Particularly, smaller aquifers maintained a favorable storage efficiency of over 77% regardless of the fracture pressure, as observed in Cases 1, 4, and 7 in Table 6.
The relationship between injection mass and storage capacity for the nine sensitivity cases exhibited a logarithmic trend, as illustrated in the scatter plot in Figure 11. As the injection mass increases, the rate of increase in storage capacity decreases. When the injection mass increases beyond a certain level, the storage capacity tends to plateau with further increases in injection mass. When the aquifer radius factor was 2 or 3.5 (Cases 1, 2, 4, 5, 7, and 8), the storage capacity was limited by the pressure. In these six cases, the injection mass and storage capacity exhibited linearity, as shown in Figure 11. However, for the highest aquifer radius factor (Cases 3, 6, and 9), the storage capacity was constrained by the space within Region 2. These results illustrate the trends in pressure-limited capacity, as shown in Figure 1.
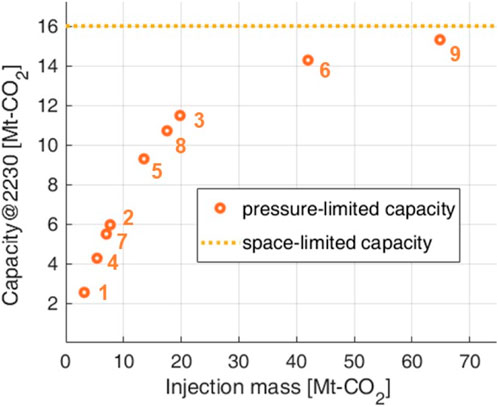
Figure 11. Storage capacity as a function of injection mass for the 9 cases in Table 5.
4 Conclusion
In this study, we evaluated the effects of two uncontrollable parameters, the aquifer radius factor and fracture pressure, on the amount of CO2 injected and stored. Based on a sensitivity analysis of these two parameters, we reached the following three main conclusions:
First, the fracture pressure constrains the injection mass by determining the pressure-limiting capacity. As the fracture pressure increases, the storage capacity increases due to an increase in the amount of injected CO2. Therefore, for a successful CCS project, it is essential to consider the effects of fracture pressure and its associated uncertainty.
Second, the aquifer radius factor can mitigate this problem at low fracture pressures. As the factor increased from 2 to 7, the injection mass and storage capacity increased, regardless of the fracture pressure. Therefore, when the aquifer radius factor was high, the pressure restriction imposed by the fracture pressure had a negligible effect on the injection mass. Case 3, with the highest aquifer radius factor and lowest fracture pressure, exhibited much better performances (17.55 Mt-CO2 injected and 10.71 Mt-CO2 stored) than Case 7 (7.69 Mt-CO2 injected and 5.96 Mt-CO2 stored), with the lowest aquifer radius factor and highest fracture pressure.
Third, storage efficiency tends to decrease due to space-limited constraints as the aquifer radius factor and fracture pressure increase. According to a fill-and-spill analysis of the anticline structure, an increase in the injection mass did not proportionally increase the storage capacity. From a CCS perspective, a higher injection mass does not always guarantee success if long-term storage is not feasible.
The findings of this study provide guidance on the two parameters that must be considered to reliably evaluate CCS projects from pressure- and space-limited perspectives. However, additional studies are needed to gain further insights into the fate of the injected CO2 region beyond the spill point, as well as to develop an integrated model with rock mechanics (Masson-Delmotte et al., 2018; Trupp et al., 2021).
Data availability statement
The original contributions presented in the study are included in the article/supplementary material, further inquiries can be directed to the corresponding author.
Author contributions
SJ: Formal Analysis, Investigation, Software, Visualization, Writing–original draft, Conceptualization, Data curation, Methodology, Validation, Writing–review and editing. KL: Formal Analysis, Investigation, Software, Visualization, Writing–original draft, Writing–review and editing.
Funding
The authors declare that financial support was received for the research, authorship, and/or publication of this article. SJ received financial support for this study from SK Earthon Co., Ltd. (http://www.skearthon.com/). KL was supported by the National Research Foundation of Korea (NRF) grant funded by the Ministry of Science and ICT (MSIT) (No. 2021R1C1C1004460), the Korea Agency for Infrastructure Technology Advancement (KAIA) grant funded by the Ministry of Land, Infrastructure and Transport (MOLIT) (Grant RS-2022-00143541), and the Korea Institute of Energy Technology Evaluation and Planning (KETEP) grant funded by the Ministry of Trade, Industry and Energy (MOTIE) (No. 20225B10300050). The funder was not involved in the study design, collection, analysis, interpretation of data, the writing of this article, or the decision to submit it for publication.
Acknowledgments
KL appreciates the SLB for providing the reservoir simulation software packages, including ECLIPSE, Intersect, and Petrel.
Conflict of interest
Author SJ was employed by SK Earthon Co., Ltd.
The remaining author declares that the research was conducted in the absence of any commercial or financial relationships that could be construed as a potential conflict of interest.
Author KL declared that he was an editorial board member of Frontiers, at the time of submission. This had no impact on the peer review process and the final decision.
Publisher’s note
All claims expressed in this article are solely those of the authors and do not necessarily represent those of their affiliated organizations, or those of the publisher, the editors and the reviewers. Any product that may be evaluated in this article, or claim that may be made by its manufacturer, is not guaranteed or endorsed by the publisher.
References
Abbaszadeh, M., and Shariatipour, S. M. (2018). Investigating the impact of reservoir properties and injection parameters on carbon dioxide dissolution in saline aquifers. Fluids 3 (4), 76. doi:10.3390/fluids3040076
Bachu, S., Bonijoly, D., Bradshaw, J., Burress, R., Holloway, S., Christensen, N. P., et al. (2007). CO2 storage capacity estimation: methodology and gaps. Int. J. Greenh. Gas. Control 1 (4), 430–443. doi:10.1016/s1750-5836(07)00086-2
Benisch, K., Wang, W., Delfs, J.-O., and Bauer, S. (2020). The OGS-Eclipse code for simulation of coupled multiphase flow and geomechanical processes in the subsurface. Comput. Geosci. 24 (3), 1315–1331. doi:10.1007/s10596-020-09951-8
Benson, S., Cook, P., Anderson, J., Bachu, S., Nimir, H., Basu, B., et al. (2005). Underground geological storage. Editors G. Borm, D. G. Hawkins, A. Lee, M. Loos, and L. Meyer IPCC special report on carbon dioxide capture and storage (Cambridge: Cambridge Univ. Press), 195–276.
Bergmo, P. E. S., Grimstad, A.-A., and Lindeberg, E. (2011). Simultaneous CO2 injection and water production to optimise aquifer storage capacity. Int. J. Greenh. Gas. Control 5 (3), 555–564. doi:10.1016/j.ijggc.2010.09.002
Blondes, M. S., Brennan, S. T., Merrill, M. D., Buursink, M. L., Warwick, P. D., Cahan, S. M., et al. (2013). National assessment of geologic carbon dioxide storage resources—methodology implementation. http://pubs.usgs.gov/of/2013/1055/.
Buscheck, T. A., Bielicki, J. M., White, J. A., Sun, Y., Hao, Y., Bourcier, W. L., et al. (2017). Managing geologic CO2 storage with pre-injection brine production in tandem reservoirs. Energy Procedia 114, 4757–4764. doi:10.1016/j.egypro.2017.03.1826
Cameron, D. A., and Durlofsky, L. J. (2012). Optimization of well placement, CO2 injection rates, and brine cycling for geological carbon sequestration. Int. J. Greenh. Gas. Control 10, 100–112. doi:10.1016/j.ijggc.2012.06.003
Carter, R., and Tracy, G. (1960). An improved method for calculating water influx. Trans. AIME 219 (01), 415–417. doi:10.2118/1626-g
Coats, K. H. (1962). A mathematical model water movement about bottom-water-drive reservoirs. SPE J. 2, 44–52. doi:10.2118/160-pa
Dean, R. H., and Schmidt, J. H. (2009). Hydraulic-fracture predictions with a fully coupled geomechanical reservoir simulator. SPE J. 14 (4), 707–714. doi:10.2118/116470-pa
Ellsworth, W. L., Giardini, D., Townend, J., Ge, S., and Shimamoto, T. (2019). Triggering of the Pohang, Korea, earthquake (M w 5.5) by enhanced geothermal system stimulation. Seismol. Res. Lett. 90 (5), 1844–1858. doi:10.1785/0220190102
Fetkovich, M. J. (1971). A simplified approach to water influx calculations—finite aquifer systems. J. Pet. Technol. 23 (7), 814–828. doi:10.2118/2603-pa
Frailey, S., Koperna, G., and Tucker, O. (2018). “The CO2 storage resources management system (SRMS): toward a common approach to classifying, categorizing, and quantifying storage resources,” in Proceedings of the 14th Greenhouse Gas Control Technologies Conference, Melbourne, Australia, October, 2018.
Fuss, S., Lamb, W. F., Callaghan, M. W., Hilaire, J., Creutzig, F., Amann, T., et al. (2018). Negative emissions—Part 2: costs, potentials and side effects. Environ. Res. Lett. 13 (6), 063002. doi:10.1088/1748-9326/aabf9f
Gai, X., Dean, R. H., Wheeler, M. F., and Liu, R. (2003). “Coupled geomechanical and reservoir modeling on parallel computers,” in proceedings of the SPE reservoir simulation symposium, Houston, TX, USA
Global CCS Institute (2021). Global status of CCS 2021. https://www.globalccsinstitute.com/resources/publications-reports-research/global-status-of-ccs-2021/.
Goater, A. L., Bijeljic, B., and Blunt, M. J. (2013). Dipping open aquifers—the effect of top-surface topography and heterogeneity on CO2 storage efficiency. Int. J. Greenh. Gas. Control 17, 318–331. doi:10.1016/j.ijggc.2013.04.015
Goertz-Allmann, B. P., Kühn, D., Oye, V., Bohloli, B., and Aker, E. (2014). Combining microseismic and geomechanical observations to interpret storage integrity at the in Salah CCS site. Geophys. J. Int. 198 (1), 447–461. doi:10.1093/gji/ggu010
Gorecki, C. D., Ayash, S. C., Liu, G., Braunberger, J. R., and Dotzenrod, N. W. (2015). A comparison of volumetric and dynamic CO2 storage resource and efficiency in deep saline formations. Int. J. Greenh. Gas. Control 42, 213–225. doi:10.1016/j.ijggc.2015.07.018
Gray, K. (2010). Carbon sequestration atlas of the United States and Canada. Georgia: US Department of Energy. doi:10.2172/1814019
Grude, S., Landrø, M., and Dvorkin, J. (2014). Pressure effects caused by CO2 injection in the Tubåen Fm., the Snøhvit field. Int. J. Greenh. Gas. Control 27, 178–187. doi:10.1016/j.ijggc.2014.05.013
Gu, F., and Chalaturnyk, J. (2005). Analysis of coalbed methane production by reservoir and geomechanical coupling simulation. J. Can. Pet. Technol. 44 (10), 33–42. doi:10.2118/05-10-03
Haszeldine, S., Cavanagh, A., Scott, V., Sohi, S., Masek, O., and Renforth, P. (2019). Greenhouse gas removal technologies: approaches and implementation pathways in scotland. Edinburgh: University of Edinburgh & Heriot Watt University.
International Energy Agency Greenhouse Gas R&D Programme (2009). Development of Storage Coefficients for CO2 storage in deep saline formations. Cheltenham: International Energy Agency.
Ismail, I., and Gaganis, V. (2003). Carbon capture, utilization, and storage in saline aquifers: subsurface policies, development plans, well control strategies and optimization approaches—a review. Clean. Technol. 5 (2), 609–637. doi:10.3390/cleantechnol5020031
Jeannin, L., Mainguy, M., Masson, R., and Vidal-Gilbert, S. (2007). Accelerating the convergence of coupled geomechanical-reservoir simulations. Int. J. Numer. Anal. Methods Geomech. 31 (10), 1163–1181. doi:10.1002/nag.576
Jung, S. (2023). Expansion of geological CO2 storage capacity in a closed aquifer by simultaneous brine production with CO2 injection. Sustainability 15 (4), 3499. doi:10.3390/su15043499
Le Guenan, T., and Rohmer, J. (2011). Corrective measures based on pressure control strategies for CO2 geological storage in deep aquifers. Int. J. Greenh. Gas. Control 5 (3), 571–578. doi:10.1016/j.ijggc.2010.05.009
Li, C., Maggi, F., Zhang, K., Guo, C., Gan, Y., El-Zein, A., et al. (2019). Effects of variable injection rate on reservoir responses and implications for CO2 storage in saline aquifers. Greenh. Gases Sci. Technol. 9 (4), 652–671. doi:10.1002/ghg.1888
Li, L., Chen, Z., Su, Y.-L., Fan, L.-Y., Tang, M.-R., and Tu, J.-W. (2021). Experimental investigation on enhanced-oil-recovery mechanisms of using supercritical carbon dioxide as prefracturing energized fluid in tight oil reservoir. SPE J. 26 (05), 3300–3315. doi:10.2118/202279-pa
Martin-Roberts, E., Scott, V., Flude, S., Johnson, G., Haszeldine, R. S., and Gilfillan, S. (2021). Carbon capture and storage at the end of a lost decade. One Earth 4 (11), 1569–1584. doi:10.1016/j.oneear.2021.10.002
Masson-Delmotte, V., Zhai, P., Pörtner, H.-O., Roberts, D., Skea, J., Shukla, P., et al. (2018). Global Warming of 1.5°C (IPCC special report). Geneva, Switzerland: Intergovernmental Panel on Climate Change. https://www.ipcc.ch/sr15/.
Okwen, R., Yang, F., and Frailey, S. (2014). Effect of geologic depositional environment on CO2 storage efficiency. Energy Procedia 63, 5247–5257. doi:10.1016/j.egypro.2014.11.556
Pruess, K., Garcia, J., Kovscek, T., Oldenburg, C., Rutqvist, J., Steefel, C., et al. (2004). Code intercomparison builds confidence in numerical simulation models for geologic disposal of CO2. Energy 29 (9–10), 1431–1444. doi:10.1016/j.energy.2004.03.077
Sarkarfarshi, M., Malekzadeh, F. A., Gracie, R., and Dusseault, M. B. (2014). Parametric sensitivity analysis for CO2 geosequestration. Int. J. Greenh. Gas. Control 23, 61–71. doi:10.1016/j.ijggc.2014.02.003
Szulczewski, M. L., MacMinn, C. W., Herzog, H. J., and Juanes, R. (2012). Lifetime of carbon capture and storage as a climate-change mitigation technology. Proc. Natl. Acad. Sci. 109 (14), 5185–5189. doi:10.1073/pnas.1115347109
Tatarewicz, I., Lewarski, M., Skwierz, S., Krupin, V., Jeszke, R., Pyrka, M., et al. (2021). The role of BECCS in achieving climate neutrality in the European Union. Energies 14 (23), 7842. doi:10.3390/en14237842
Thibeau, S., and Adler, F. (2023). Pressure-derived storage efficiency for open saline aquifer CO2 storage. Geoenergy 1 (1), geoenergy2022–003. doi:10.1144/geoenergy2022-003
Trupp, M., Ryan, S., Barranco Mendoza, I., Leon, D., and Scoby-Smith, L. (2021). Developing the world’s largest CO2 injection system–a history of the gorgon carbon dioxide injection system in proceedings of the 15th Greenhouse Gas Control Technologies Conference, Virtual conference. Virtual
United Nations Framework Convention on Climate Change (2015). Adoption of the Paris agreement. Geneva: United Nations Framework Convention on Climate Change.
van Everdingen, A., and Hurst, W. (1949). The application of the Laplace transformation to flow problems in reservoirs. J. Pet. Technol. 1 (12), 305–324. doi:10.2118/949305-g
Wang, Z., Li, S., Jin, Z., Li, Z., Liu, Q., and Zhang, K. (2023). Oil and gas pathway to net-zero: review and outlook. Energy Strategy Rev. 45, 101048. doi:10.1016/j.esr.2022.101048
Ya-nan, S., Weiting, L., Jinbao, J., Kai, L., Hua, K., and Yupeng, Y. (2021). Quantitative characterization of collapse and fracture pressure uncertainty based on Monte Carlo simulation. J. Pet. Explor. Prod. Technol. 11 (5), 2199–2206. doi:10.1007/s13202-021-01159-5
Yoon, H. C., Yoon, S., Lee, J. Y., and Kim, J. (2021). Multiple porosity model of a heterogeneous layered gas hydrate deposit in Ulleung Basin, East Sea, Korea: a study on depressurization strategies, reservoir geomechanical response, and wellbore stability. J. Nat. Gas. Sci. Eng. 96, 104321. doi:10.1016/j.jngse.2021.104321
Zahasky, C., and Krevor, S. (2020). Global geologic carbon storage requirements of climate change mitigation scenarios. Energy Environ. Sci. 13 (6), 1561–1567. doi:10.1039/d0ee00674b
Zhang, J., and Yin, S.-X. (2017). Fracture gradient prediction: an overview and an improved method. Pet. Sci. 14 (4), 720–730. doi:10.1007/s12182-017-0182-1
Keywords: CO2 storage, aquifer radius factor, fracture pressure, pressure-limited injection, space-limited storage
Citation: Jung S and Lee K (2024) Effects of aquifer size and formation fracture pressure on CO2 geological storage capacity. Front. Energy Res. 12:1381402. doi: 10.3389/fenrg.2024.1381402
Received: 03 February 2024; Accepted: 20 March 2024;
Published: 10 April 2024.
Edited by:
Xindi Sun, Slippery Rock University of Pennsylvania, United StatesReviewed by:
Zhoujie Wang, China University of Petroleum (East China), ChinaMingqiang Wei, Southwest Petroleum University, China
Copyright © 2024 Jung and Lee. This is an open-access article distributed under the terms of the Creative Commons Attribution License (CC BY). The use, distribution or reproduction in other forums is permitted, provided the original author(s) and the copyright owner(s) are credited and that the original publication in this journal is cited, in accordance with accepted academic practice. No use, distribution or reproduction is permitted which does not comply with these terms.
*Correspondence: Kyungbook Lee, a2JsZWVAa29uZ2p1LmFjLmty